Assessment of 135 794 Pediatric Patients Tested for Severe Acute Respiratory Syndrome Coronavirus 2 Across the United States
- PMID: 33226415
- PMCID: PMC7684518
- DOI: 10.1001/jamapediatrics.2020.5052
Assessment of 135 794 Pediatric Patients Tested for Severe Acute Respiratory Syndrome Coronavirus 2 Across the United States
Abstract
Importance: There is limited information on severe acute respiratory syndrome coronavirus 2 (SARS-CoV-2) testing and infection among pediatric patients across the United States.
Objective: To describe testing for SARS-CoV-2 and the epidemiology of infected patients.
Design, setting, and participants: A retrospective cohort study was conducted using electronic health record data from 135 794 patients younger than 25 years who were tested for SARS-CoV-2 from January 1 through September 8, 2020. Data were from PEDSnet, a network of 7 US pediatric health systems, comprising 6.5 million patients primarily from 11 states. Data analysis was performed from September 8 to 24, 2020.
Exposure: Testing for SARS-CoV-2.
Main outcomes and measures: SARS-CoV-2 infection and coronavirus disease 2019 (COVID-19) illness.
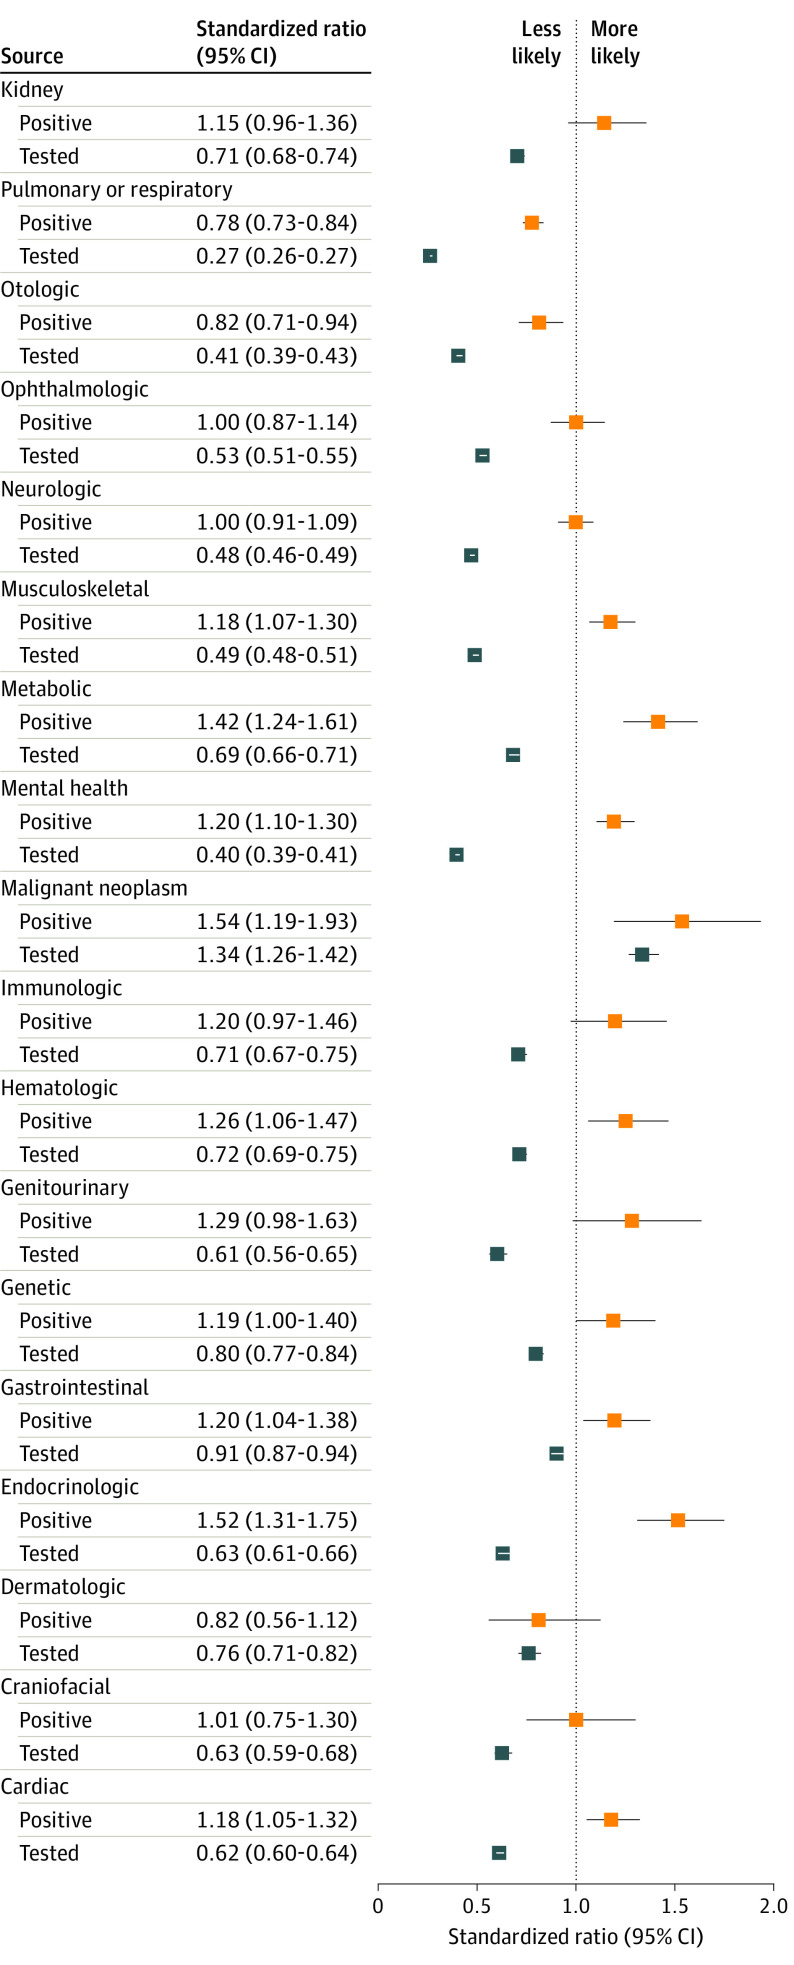
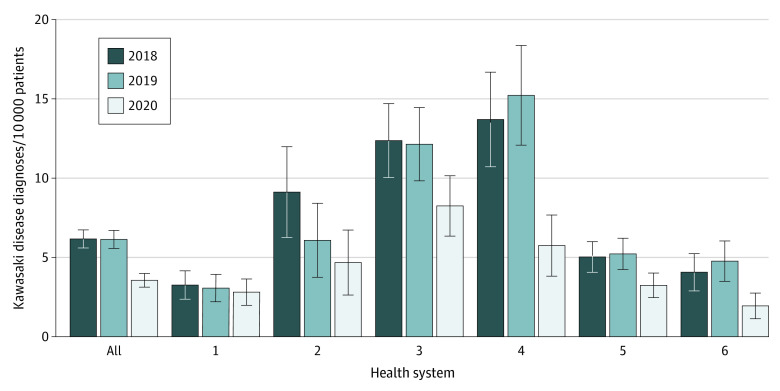
Results: A total of 135 794 pediatric patients (53% male; mean [SD] age, 8.8 [6.7] years; 3% Asian patients, 15% Black patients, 11% Hispanic patients, and 59% White patients; 290 per 10 000 population [range, 155-395 per 10 000 population across health systems]) were tested for SARS-CoV-2, and 5374 (4%) were infected with the virus (12 per 10 000 population [range, 7-16 per 10 000 population]). Compared with White patients, those of Black, Hispanic, and Asian race/ethnicity had lower rates of testing (Black: odds ratio [OR], 0.70 [95% CI, 0.68-0.72]; Hispanic: OR, 0.65 [95% CI, 0.63-0.67]; Asian: OR, 0.60 [95% CI, 0.57-0.63]); however, they were significantly more likely to have positive test results (Black: OR, 2.66 [95% CI, 2.43-2.90]; Hispanic: OR, 3.75 [95% CI, 3.39-4.15]; Asian: OR, 2.04 [95% CI, 1.69-2.48]). Older age (5-11 years: OR, 1.25 [95% CI, 1.13-1.38]; 12-17 years: OR, 1.92 [95% CI, 1.73-2.12]; 18-24 years: OR, 3.51 [95% CI, 3.11-3.97]), public payer (OR, 1.43 [95% CI, 1.31-1.57]), outpatient testing (OR, 2.13 [1.86-2.44]), and emergency department testing (OR, 3.16 [95% CI, 2.72-3.67]) were also associated with increased risk of infection. In univariate analyses, nonmalignant chronic disease was associated with lower likelihood of testing, and preexisting respiratory conditions were associated with lower risk of positive test results (standardized ratio [SR], 0.78 [95% CI, 0.73-0.84]). However, several other diagnosis groups were associated with a higher risk of positive test results: malignant disorders (SR, 1.54 [95% CI, 1.19-1.93]), cardiac disorders (SR, 1.18 [95% CI, 1.05-1.32]), endocrinologic disorders (SR, 1.52 [95% CI, 1.31-1.75]), gastrointestinal disorders (SR, 2.00 [95% CI, 1.04-1.38]), genetic disorders (SR, 1.19 [95% CI, 1.00-1.40]), hematologic disorders (SR, 1.26 [95% CI, 1.06-1.47]), musculoskeletal disorders (SR, 1.18 [95% CI, 1.07-1.30]), mental health disorders (SR, 1.20 [95% CI, 1.10-1.30]), and metabolic disorders (SR, 1.42 [95% CI, 1.24-1.61]). Among the 5374 patients with positive test results, 359 (7%) were hospitalized for respiratory, hypotensive, or COVID-19-specific illness. Of these, 99 (28%) required intensive care unit services, and 33 (9%) required mechanical ventilation. The case fatality rate was 0.2% (8 of 5374). The number of patients with a diagnosis of Kawasaki disease in early 2020 was 40% lower (259 vs 433 and 430) than in 2018 or 2019.
Conclusions and relevance: In this large cohort study of US pediatric patients, SARS-CoV-2 infection rates were low, and clinical manifestations were typically mild. Black, Hispanic, and Asian race/ethnicity; adolescence and young adulthood; and nonrespiratory chronic medical conditions were associated with identified infection. Kawasaki disease diagnosis is not an effective proxy for multisystem inflammatory syndrome of childhood.
Conflict of interest statement
Figures
References
-
- World Health Organization WHO Director-General’s opening remarks at the media briefing on COVID-19—11 March 2020. Published March 11, 2020. Accessed June 29, 2020. https://www.who.int/dg/speeches/detail/who-director-general-s-opening-re...
-
- Johns Hopkins University & Medicine COVID-19 dashboard by the Center for Systems Science and Engineering (CSSE) at Johns Hopkins University (JHU). Accessed June 29, 2020. https://coronavirus.jhu.edu/map.html
-
- Centers for Disease Control and Prevention COVIDView: a weekly surveillance summary of U.S. COVID-19 activity. Updated October 9, 2020. Accessed October 12, 2020. https://www.cdc.gov/coronavirus/2019-ncov/covid-data/covidview/index.html
Publication types
MeSH terms
LinkOut - more resources
Full Text Sources
Other Literature Sources
Medical
Research Materials
Miscellaneous