. 2021 Jul;74(1):281-295.
doi: 10.1002/hep.31652. Epub 2021 Jun 15.

Bile Acid Profiles in Primary Sclerosing Cholangitis and Their Ability to Predict Hepatic Decompensation

Affiliations

Bile Acid Profiles in Primary Sclerosing Cholangitis and Their Ability to Predict Hepatic Decompensation

Omar Y Mousa et al. Hepatology. 2021 Jul.

Abstract

Background and aims: Altered bile acid (BA) homeostasis is an intrinsic facet of cholestatic liver diseases, but clinical usefulness of plasma BA assessment in primary sclerosing cholangitis (PSC) remains understudied. We performed BA profiling in a large retrospective cohort of patients with PSC and matched healthy controls, hypothesizing that plasma BA profiles vary among patients and have clinical utility.

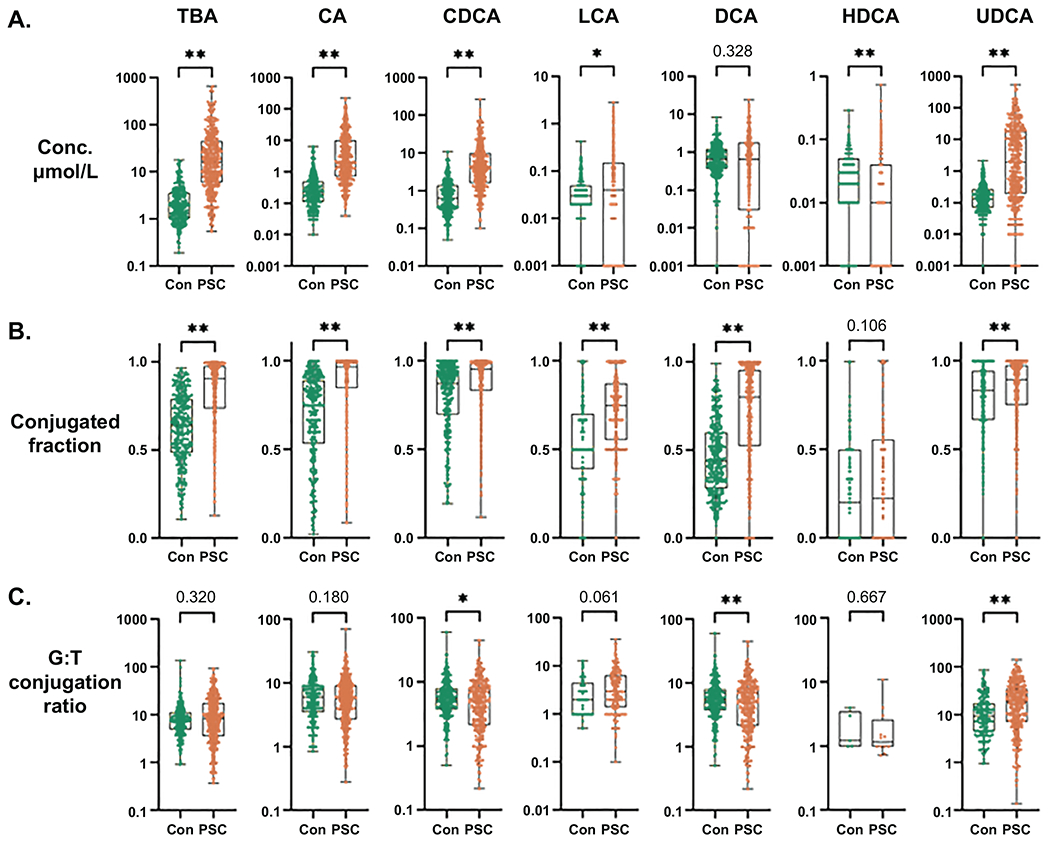
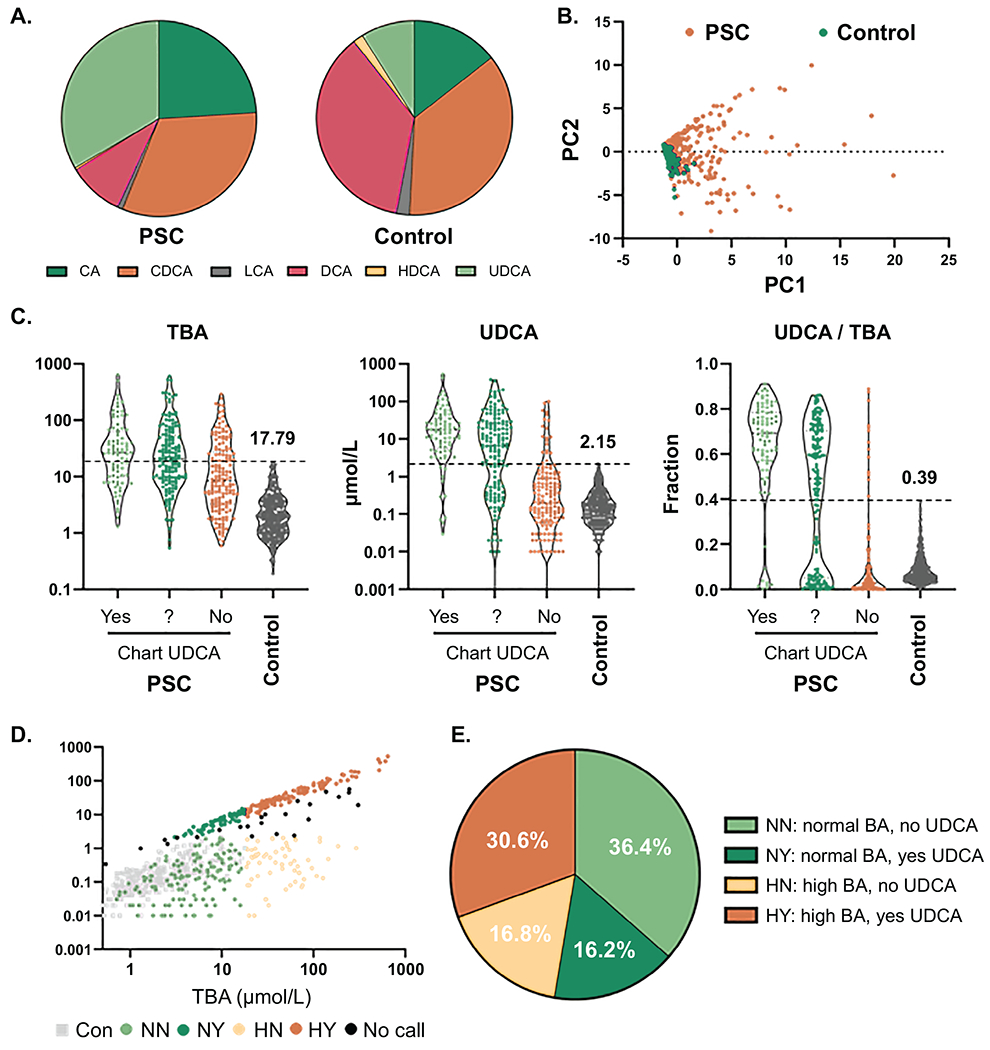
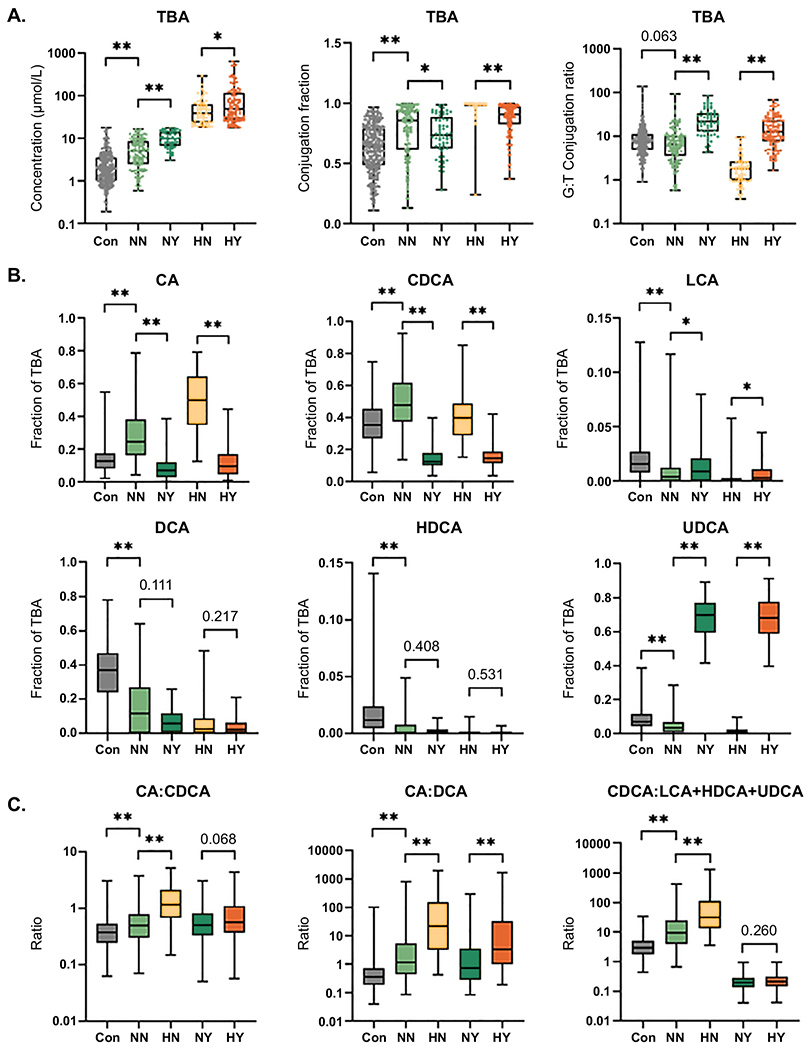
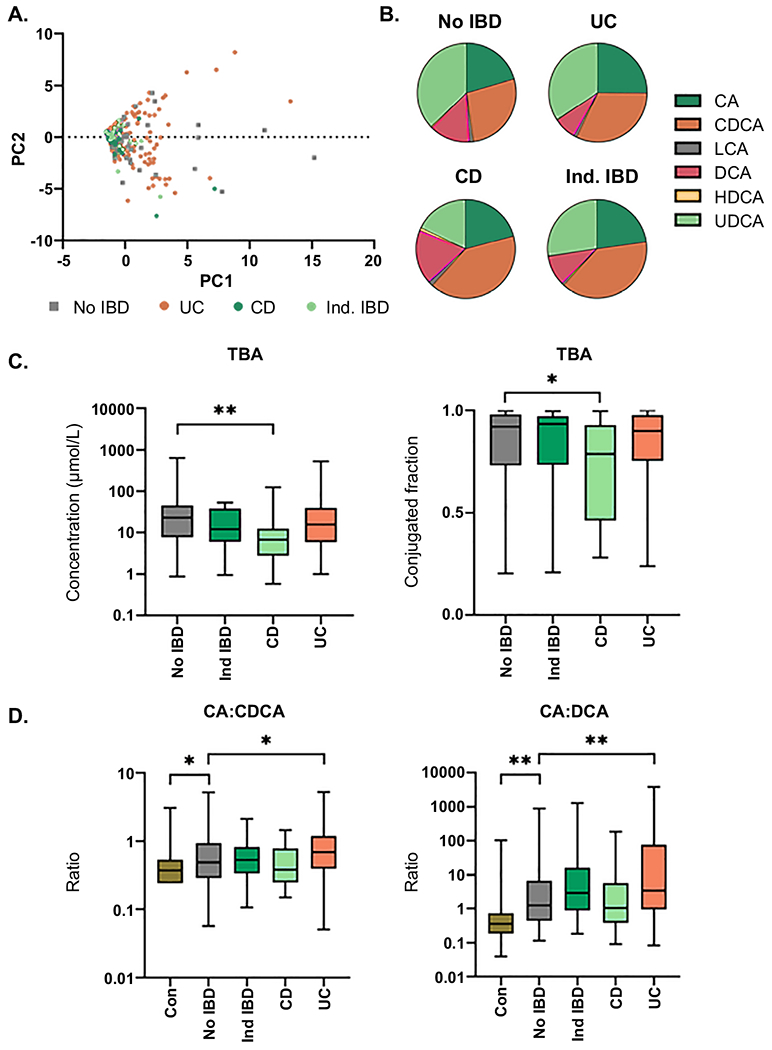
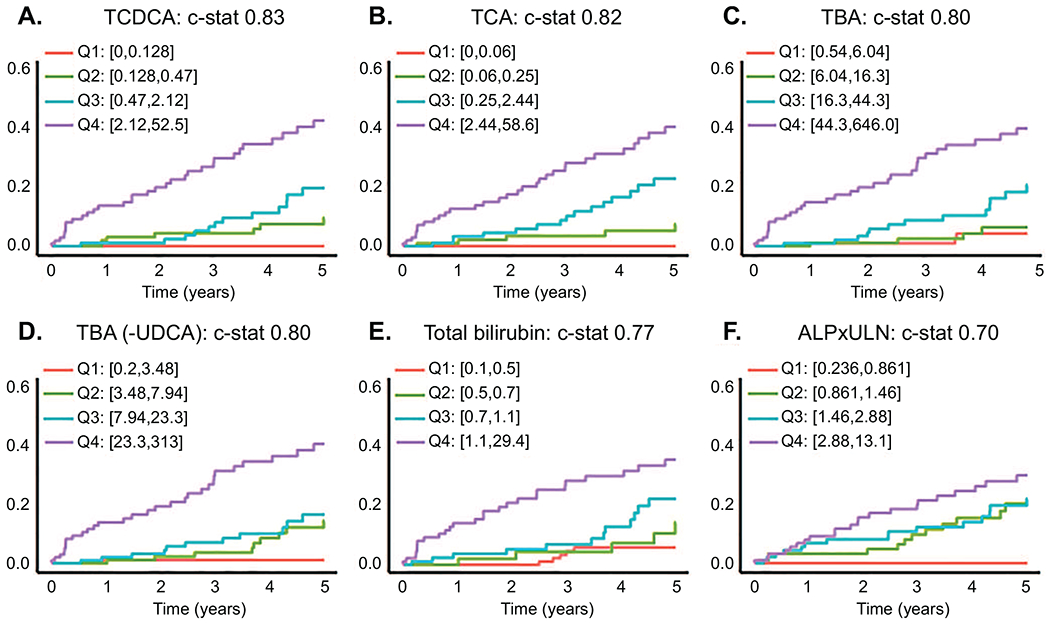
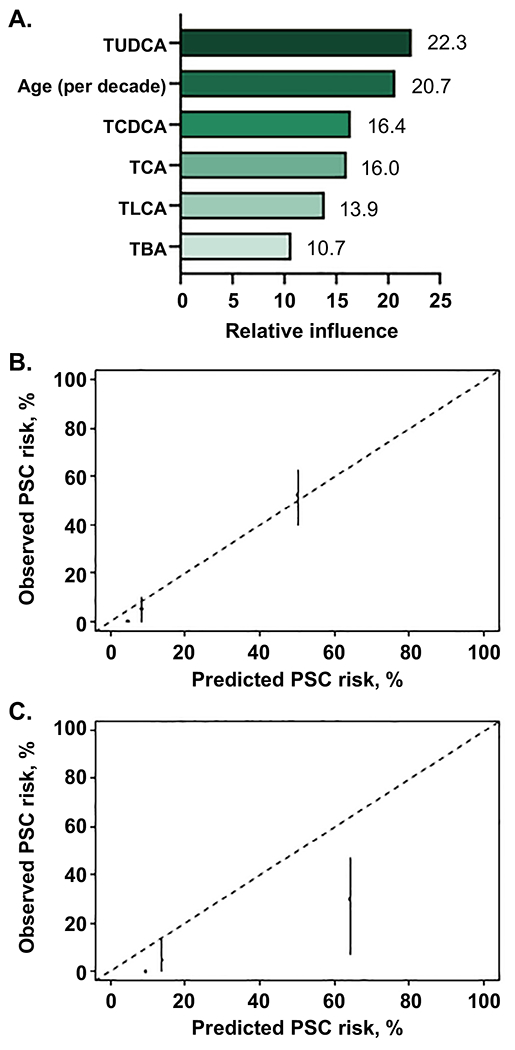
Approach and results: Plasma BA profiling was performed in the Clinical Biochemical Genetics Laboratory at Mayo Clinic using a mass spectrometry based assay. Cox proportional hazard (univariate) and gradient boosting machines (multivariable) models were used to evaluate whether BA variables predict 5-year risk of hepatic decompensation (HD; defined as ascites, variceal hemorrhage, or encephalopathy). There were 400 patients with PSC and 302 controls in the derivation cohort (Mayo Clinic) and 108 patients with PSC in the validation cohort (Norwegian PSC Research Center). Patients with PSC had increased BA levels, conjugated fraction, and primary-to-secondary BA ratios relative to controls. Ursodeoxycholic acid (UDCA) increased total plasma BA level while lowering cholic acid and chenodeoxycholic acid concentrations. Patients without inflammatory bowel disease (IBD) had primary-to-secondary BA ratios between those of controls and patients with ulcerative colitis. HD risk was associated with increased concentration and conjugated fraction of many BA, whereas higher G:T conjugation ratios were protective. The machine-learning model, PSC-BA profile score (concordance statistic [C-statistic], 0.95), predicted HD better than individual measures, including alkaline phosphatase, and performed well in validation (C-statistic, 0.86).

Conclusions: Patients with PSC demonstrated alterations of plasma BA consistent with known mechanisms of cholestasis, UDCA treatment, and IBD. Notably, BA profiles predicted future HD, establishing the clinical potential of BA profiling, which may be suited for use in clinical trials.


Figures

Fig. 1.
Fig. 1.. Bile acids in PSC patients and controls.
Comparisons of (A) Concentration (μmol/L), (B) Conjugated fraction and (C) G:T conjugation ratio of total bile acids (TBA) and each bile acid family (e.g., the CA family includes CA (unconjugated), GCA and TCA) between PSC patients and controls. Significance level: *p<0.05, **p≤0.001; Kruskal-Wallis rank sum test.
Fig. 2.
Fig. 2.. PSC patient subgrouping based on total bile acid levels and UDCA treatment.
(A) Plasma bile acid (BA) composition by BA family type in PSC patients and controls, (B) Principle components analysis of individual bile acid concentrations in PSC patients and controls, (C) Concentrations of total bile acids (TBA), UDCA and fraction of UDCA in TBA (UDCA/TBA) of PSC patients separated by chart-reviewed determination of UDCA treatment and controls. Values shown are maximum cut-offs observed in controls and were used to establish PSC patient subgroups based on TBA (normal: ≤ 17.79, high: > 17.79 μmol/L) and predicted UDCA treatment (no: UDCA conc. ≤ 2.15 and fraction ≤ 0.39, yes: UDCA conc. > 2.15 and fraction > 0.39). (D) UDCA and TBA concentrations in PSC patients and controls colored by TBA/UDCA groups, (E) proportion of PSC patients in each of the TBA/UDCA groups.
Fig. 3.
Fig. 3.. Bile acids in controls and PSC patient TBA/UDCA subgroups.
Comparisons of (A) Concentration (μmol/L), Conjugated fraction and G:T conjugation ratio of total bile acids (TBA) and (B) Concentration of each BA family as fraction of TBA between (1) controls and NN PSC patients, (2) NN and NY PSC patients and (3) HN and HY PSC patients. (C) Comparison of CA:CDCA, CA:DCA and CDCA:LCA+HDCA+UDCA ratios between (1) controls and NN PSC patients, (2) NN and HN PSC patients and (3) NY and HY PSC patients. Significance level: *p<0.05, **p≤0.001; Kruskal-Wallis rank sum test.
Fig. 4.
Fig. 4.. Inflammatory bowel disease and bile acids in PSC.
(A) Principle components analysis (PCA) of individual BA concentrations in PSC patients with No IBD, ulcerative colitis (UC), Crohn’s Disease (CD) or indeterminate IBD (Ind IBD); (B) Plasma BA composition by BA family type in PSC patients by IBD group; (C) Comparison of concentration (μmol/L) and conjugated fraction of total bile acids (TBA) between PSC patients with No IBD and PSC patients with Ind IBD, CD or UC; (D) Comparison of CA:CDCA and CA:DCA ratios between (1) Controls and PSC patients with No IBD and (2) PSC patients with No IBD and PSC patients with Ind IBD, CD or UC. Significance level: *p<0.05, **p≤0.001; Kruskal-Wallis rank sum test. Non-significant comparisons (p≥0.05) are not highlighted in this figure.
Fig. 5.
Fig. 5.. Univariate analysis of bile acid variables for time-to-event (hepatic decompensation) in PSC.
(A) TCDCA, (B) TCA and (C) total bile acids (TBA) were the top 3 variables capable of predicting hepatic decompensation (HD; defined as ascites, esophageal varices or encephalopathy) in PSC over a 5 year window. (D) TBA with UDCA and it’s conjugates subtracted performed similar to TBA. These variables outperformed (E) Total bilirubin and (F) alkaline phosphatase expressed as times upper limit of normal (ALPxULN). Cox proportional hazard models were used to evaluate risk of HD (p<0.001 all variables). The Harrell’s concordance statistic (c-stat) was used to measure discrimination ability of the variables. Data is presented using Aalen-Johansen curves based on quartiles of variable values, accounting for death and liver transplantation as competing risks.
Fig. 6.
Fig. 6.. Predictive model for hepatic decompensation in PSC using machine learning and the bile acid profile: PSC-BAP score.
(A) Variables included in the model and their relative importance, (B) derivation cohort and (C) validation cohort model calibration by tertiles (low, medium, high) of predicted risk.

References

    1. Lazaridis KN, LaRusso NF. Primary Sclerosing Cholangitis. N Engl J Med 2016;375:2501–2502. - PubMed
    1. Poropat G, Giljaca V, Stimac D, Gluud C. Bile acids for primary sclerosing cholangitis. Cochrane Database Syst Rev 2011:CD003626. - PMC - PubMed
    1. Fickert P, Wagner M. Biliary bile acids in hepatobiliary injury - What is the link? J Hepatol 2017;67:619–631. - PubMed
    1. de Krijger M, Wildenberg ME, de Jonge WJ, Ponsioen CY. Return to sender: Lymphocyte trafficking mechanisms as contributors to primary sclerosing cholangitis. J Hepatol 2019;71:603–615. - PubMed
    1. Ji SG, Juran BD, Mucha S, Folseraas T, Jostins L, Melum E, et al. Genome-wide association study of primary sclerosing cholangitis identifies new risk loci and quantifies the genetic relationship with inflammatory bowel disease. Nat Genet 2017;49:269–273. - PMC - PubMed

Publication types

MeSH terms

Substances