

A Real-World Prospective Study of the Safety and Effectiveness of the Loop Open Source Automated Insulin Delivery System
- PMID: 33226840
- PMCID: PMC8080906
- DOI: 10.1089/dia.2020.0535
A Real-World Prospective Study of the Safety and Effectiveness of the Loop Open Source Automated Insulin Delivery System
Abstract
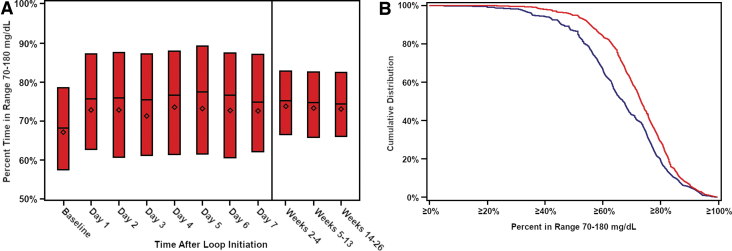
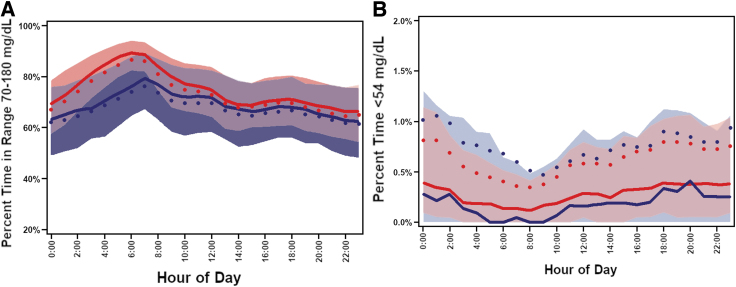
Objective: To evaluate the safety and effectiveness of the Loop Do-It-Yourself automated insulin delivery system. Research Design and Methods: A prospective real-world observational study was conducted, which included 558 adults and children (age range 1-71 years, mean HbA1c 6.8% ± 1.0%) who initiated Loop either on their own or with community-developed resources and provided data for 6 months. Results: Mean time-in-range 70-180 mg/dL (TIR) increased from 67% ± 16% at baseline (before starting Loop) to 73% ± 13% during the 6 months (mean change from baseline 6.6%, 95% confidence interval [CI] 5.9%-7.4%; P < 0.001). TIR increased in both adults and children, across the full range of baseline HbA1c, and in participants with both high- and moderate-income levels. Median time <54 mg/dL was 0.40% at baseline and changed by -0.05% (95% CI -0.09% to -0.03%, P < 0.001). Mean HbA1c was 6.8% ± 1.0% at baseline and decreased to 6.5% ± 0.8% after 6 months (mean difference = -0.33%, 95% CI -0.40% to -0.26%, P < 0.001). The incidence rate of reported severe hypoglycemia events was 18.7 per 100 person-years, a reduction from the incidence rate of 181 per 100 person-years during the 3 months before the study. Among the 481 users providing Loop data at 6 months, median continuous glucose monitoring use was 96% (interquartile range [IQR] 91%-98%) and median time Loop modulating basal insulin was at least 83% (IQR 73%-88%). Conclusions: The Loop open source system can be initiated with community-developed resources and used safely and effectively by adults and children with type 1 diabetes.
Keywords: Automated insulin delivery; Closed-loop control; Continuous glucose monitors; Safety; Type 1 diabetes.
Conflict of interest statement
J.W.L. reports receiving consulting fees, paid to his institution, from Bigfoot Biomedical, Tandem Diabetes Care, and Eli Lilly. R.J.B., V.B.L., D.N., K.K.H., J.P., and P.C. have no disclosures to report. R.A.L. is supported by NIDDK (K23 DK122017) and reports receiving consulting fees from Abbott Diabetes Care, Biolinq, Capillary Biomedical, Morgan Stanley, and Tidepool. B.A. and A.S.B. are employees of Tidepool, a 501(c)(3) nonprofit dedicated to making diabetes data more accessible, actionable, and meaningful for people with diabetes, their care teams, and researchers. D.J.D. reports receiving consulting fees from Dexcom and Insulet. R.W.B. reports receiving consulting fees, paid to his institution, from Insulet, Bigfoot Biomedical, vTv Therapeutics, and Eli Lilly, grant support and supplies, provided to his institution, from Tandem and Dexcom, and supplies from Ascensia and Roche.
Figures
References
-
- Bergenstal RM, Garg S, Weinzimer SA, et al. Safety of a hybrid closed-loop insulin delivery system in patients with type 1 diabetes. JAMA 2016;316:1407–1408 - PubMed
Publication types
MeSH terms
Substances
Grants and funding
LinkOut - more resources
Full Text Sources
Medical
