Comparative Study
. 2020 Nov 23;16(11):e1008397.
doi: 10.1371/journal.pcbi.1008397. eCollection 2020 Nov.

Integrative analysis of structural variations using short-reads and linked-reads yields highly specific and sensitive predictions

Affiliations
Comparative Study

Integrative analysis of structural variations using short-reads and linked-reads yields highly specific and sensitive predictions

Riccha Sethi et al. PLoS Comput Biol. .

Abstract

Genetic diseases are driven by aberrations of the human genome. Identification of such aberrations including structural variations (SVs) is key to our understanding. Conventional short-reads whole genome sequencing (cWGS) can identify SVs to base-pair resolution, but utilizes only short-range information and suffers from high false discovery rate (FDR). Linked-reads sequencing (10XWGS) utilizes long-range information by linkage of short-reads originating from the same large DNA molecule. This can mitigate alignment-based artefacts especially in repetitive regions and should enable better prediction of SVs. However, an unbiased evaluation of this technology is not available. In this study, we performed a comprehensive analysis of different types and sizes of SVs predicted by both the technologies and validated with an independent PCR based approach. The SVs commonly identified by both the technologies were highly specific, while validation rate dropped for uncommon events. A particularly high FDR was observed for SVs only found by 10XWGS. To improve FDR and sensitivity, statistical models for both the technologies were trained. Using our approach, we characterized SVs from the MCF7 cell line and a primary breast cancer tumor with high precision. This approach improves SV prediction and can therefore help in understanding the underlying genetics in various diseases.


Conflict of interest statement

I have read the journal's policy and the authors of this manuscript have the following competing interests: Ugur Sahin is co-founder and shareholder of TRON, co-founder and CEO of BioNTech SE.

Figures
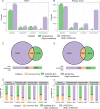
Fig 1
Fig 1. cWGS and 10XWGS predict a variable number of SVs with low proportion of common predictions.
(A and B) Number of different types of SVs predicted with high confidence by cWGS and 10XWGS pipelines for (A) MCF7 and (B) primary breast tumor. (C and D) Number of high confidence SVs commonly predicted by both technologies for (C) MCF7 and (D) primary breast tumor. (E and F) Percentages of the indicated high confidence SVs commonly predicted by the two approaches for (E) MCF7 and (F) primary breast tumor.
Fig 2
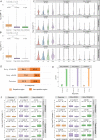
Fig 2. Requantification support and GEM coverage for SVs common between cWGS and 10XWGS is higher than that predicted by a single technology.
(A) Distribution of GEMs containing SVs that were predicted by both the technologies (common) or only by one technology (only cWGS or only 10XWGS) for MCF7. (B) Shown is the combined requantification support (JRS) as the sum of junction and spanning reads from cWGS data for common SVs and SVs predicted only by cWGS or 10XWGS for MCF7. p-values were calculated using Kruskal-wallis test and pairwise Wilcoxon rank sum test. **** represents a p-value <0.0001. (C) Comparison of requantification support (Junction reads-JR, Spanning pairs-SP, JRS = JR+SP) and GEMs for different type of SVs that are common between technologies and only predicted by 10XWGS or cWGS for MCF7. The black lines in the boxes represent median (centre line), upper quartile (upper line) and lower quartile (lower line), respectively. The area of violin plots is scaled to the number of observations. (D) Percentage of breakpoints of high confidence SVs from two technologies covered by repetitive regions. (E) Percentage of breakpoints of high confidence SVs from two technologies covered by unique mappability regions. (F) Distribution of normalized local coverage around the positions of high confidence SVs (size >10 kb), calculated from cWGS and 10XWGS aligned reads respectively. p-values were calculated by pairwise Wilcoxon rank sum test and ‘M’ is median of normalized local coverage.
Fig 3
Fig 3. Orthogonal validation of SVs using PCR and Sanger sequencing.
(A) SVs within the MCF7 dataset were selected for validation by PCR and Sanger sequencing. From the PCR-amplified products, a subset was further confirmed by Sanger sequencing. Shown are representative results involving seven SVs. (B) Number and percentage of PCR-validated SVs for the three categories: SVs common between cWGS and 10XWGS (common SVs), SVs only predicted by cWGS pipeline (only cWGS SVs) and SVs only predicted by 10XWGS pipeline (only 10XWGS SVs) are shown. (C) The difference in normalized counts of combined requantification support (JRS from cWGS reads) and GEM for PCR-validated SVs is shown. Each data point represents counts for PCR tested SVs and box-and-whisker plots represent lower quartile, median and upper quartile. p-values were derived from Wilcoxon rank sum test. (D) Percentage and number of repetitive element classes in PCR validated SVs for three categories: common, only cWGS and only 10XWGS SVs.
Fig 4
Fig 4. Prediction of SVs by trained models for the cWGS and 10XWGS technology.
Two logistic regression models were trained on PCR tested SVs from the respective technologies. (A) The table depicts the performance of different categories of SVs or technologies derived from PCR tested SVs. (B) Numbers and percentage of SVs common between the technologies before (lighter shades) and after (darker shades) applying the respective trained models. (C) Number of SVs predicted by the cWGS technology within the MCF7, and percentage predicted positive by the combined models. (D) Number of SVs predicted by the 10XWGS technology within the MCF7, and percentage predicted positive by the combined models. (E) Plot for performance of combined model and all other tools on internally validated SVs.

Similar articles

Cited by

References

    1. Hurles ME, Dermitzakis ET and Tyler-Smith C. The functional impact of structural variation in humans. Trends Genet 2008; 24(5):238–45. 10.1016/j.tig.2008.03.001 - DOI - PMC - PubMed
    1. Nowell C. The minute chromosome (Ph1) in chronic granulocytic leukemia. Blut 1962; 8(2):65–6. - PubMed
    1. Treangen TJ SSL. Repetitive DNA and next-generation sequencing: Computational challenges and solutions. Nat Rev Genet 2011; 13(1):36–46. 10.1038/nrg3117 - DOI - PMC - PubMed
    1. Chaisson MJ, Sanders AD, Zhao X, Malhotra A, Porubsky D, Rausch T, Gardner EJ, Rodriguez OL, Guo L, Collins RL and Fan X. Multi-platform discovery of haplotype-resolved structural variation in human genomes. Nat Commun 2019; 10(1):1784 10.1038/s41467-018-08148-z - DOI - PMC - PubMed
    1. Sedlazeck FJ, Lee H, Darby CA and Schatz MC. Piercing the dark matter: bioinformatics of long-range sequencing and mapping. Nature reviews Genetics 2018; 19(6):329–46. 10.1038/s41576-018-0003-4 - DOI - PubMed

Publication types

MeSH terms