. 2020 Nov 23;16(11):e1009163.
doi: 10.1371/journal.pgen.1009163. eCollection 2020 Nov.

Genome-wide association study identifies 16 genomic regions associated with circulating cytokines at birth

Affiliations

Genome-wide association study identifies 16 genomic regions associated with circulating cytokines at birth

Yunpeng Wang et al. PLoS Genet. .

Abstract

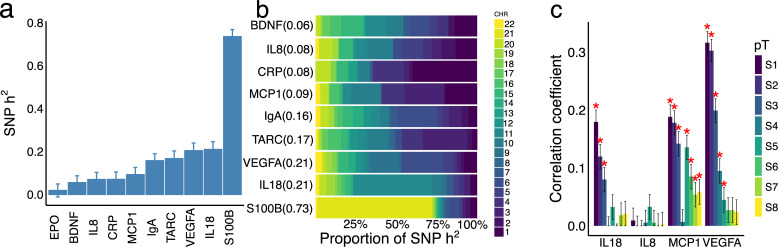
Circulating inflammatory markers are essential to human health and disease, and they are often dysregulated or malfunctioning in cancers as well as in cardiovascular, metabolic, immunologic and neuropsychiatric disorders. However, the genetic contribution to the physiological variation of levels of circulating inflammatory markers is largely unknown. Here we report the results of a genome-wide genetic study of blood concentration of ten cytokines, including the hitherto unexplored calcium-binding protein (S100B). The study leverages a unique sample of neonatal blood spots from 9,459 Danish subjects from the iPSYCH initiative. We estimate the SNP-heritability of marker levels as ranging from essentially zero for Erythropoietin (EPO) up to 73% for S100B. We identify and replicate 16 associated genomic regions (p < 5 x 10⁻⁹), of which four are novel. We show that the associated variants map to enhancer elements, suggesting a possible transcriptional effect of genomic variants on the cytokine levels. The identification of the genetic architecture underlying the basic levels of cytokines is likely to prompt studies investigating the relationship between cytokines and complex disease. Our results also suggest that the genetic architecture of cytokines is stable from neonatal to adult life.


Conflict of interest statement

The authors have declared that no competing interests exist.

Figures

Fig 1
Fig 1. SNP heritability of circulating protein levels.
The variation of circulating marker levels captured by a. all the genotyped SNP; b. SNPs on each autosome and c. polygenic scores computed from independent sample are shown. Cytokine SNP-heritabilities were shown in a by point estimates and standard errors. These point estimates were also shown in parentheses following the cytokine names on b. The Pearson’s correlation coefficients between polygenic scores and measured protein levels in the discovery sample are stratified by different p value thresholds (pT) of association in the discovery sample (S1, P<1x10⁻⁶; S2, P <1x10⁻⁵; S3,1x10-4; S4, P <0.001; S5, P < 0.01; S6, P < 0.1; S7, P <0.5; S8, P <1.0). The effect sizes used to compute polygenic scores are derived from Ahola-Olli et al.[17].
Fig 2
Fig 2. Distribution of association statistics for inflammation marker level a.
The empirical cumulative distribution function of the log10(-log10(P)) for the association of SNPs (P<5x10⁻⁹) with each inflammation marker. Colors indicate different markers. b. Distribution of SNPs (P<1x10⁻⁹) in different minor allele frequency (MAF) bins is shown for each marker. Colors indicate different MAF intervals. Numbers in the figure shows the proportion of SNPs in the region.
Fig 3
Fig 3. Prediction of inflammation marker levels by genetic variants.
a. The distribution of the normalized S100B level in the replication sample is shown in the three genotype groups of rs62224256 (0: AA, 1, AG and 2 GG). A simple linear regression line(red) is added in the figure to show the trend. b. The Pearson’s correlation coefficients between polygenic scores and normalized S100B level in the replication sample are stratified by different p value threshold(pT) of association in the discovery sample (S1, P<1x10⁻⁶; S2, P<1x10⁻⁵; S3, P<1x10⁻⁴; S4, P <0.001; S5, P< 0.01; S6, P< 0.1; S7, P<0.5; S8, P<1.0). Standard errors are show by the error bar. Stars indicate significant correlations (P<0.00125 = 0.05/40). c. A scatter plot shows the predicted S100B level (normalized, fitted strait line) in the replication sample by SNPs with P<1x10⁻⁶ in the discovery sample.
Fig 4
Fig 4. Annotation of the region indexed by rs62224256 associated with S100B.
The top panel shows the regional plot. P values bellow 1x10-100 were censored at 1x10-100 for the clearness of illustration. Genes located in this region are shown in the middle panel. The sub-region contains rs662224256 is zoomed in approximately. Two enhancers are represented by the black and red bars. Genes regulated by the enhancers are underscored by red line and shaded bar when they are regulated by both enhancers. The log10 Bayesian Factor (LBF), posterior inclusion probability(PIP) of being included in the causal set and association p values (P) scales are shown in the same order as SNP rs-numbers. The genomic coordinates (build hg19) of SNPs and enhancers are shown on the lower-left panel.

References

    1. Lackie J. Dictionary of Biomedicine—Oxford Reference 1 ed Oxford, UK: Oxford University Press; 2010.
    1. Zhang J-M, An J. Cytokines, Inflammation, and Pain. Int Anesthesiol Clin. 2007;45(2):27–37. 10.1097/AIA.0b013e318034194e - DOI - PMC - PubMed
    1. Dranoff G. Cytokines in cancer pathogenesis and cancer therapy. Nat Rev Cancer. 2004;4(1):11–22. 10.1038/nrc1252 - DOI - PubMed
    1. Braunwald E. Biomarkers in heart failure. N Engl J Med. 2008;358(20):2148–59. 10.1056/NEJMra0800239 - DOI - PubMed
    1. Hotamisligil GS. Inflammation, metaflammation and immunometabolic disorders. Nature. 2017;542:177–85. 10.1038/nature21363 - DOI - PubMed

Publication types

MeSH terms

LinkOut - more resources