. 2021 May 6;137(18):2463-2480.
doi: 10.1182/blood.2019004547.

Single-cell RNA-seq reveals developmental plasticity with coexisting oncogenic states and immune evasion programs in ETP-ALL

Affiliations

Single-cell RNA-seq reveals developmental plasticity with coexisting oncogenic states and immune evasion programs in ETP-ALL

Praveen Anand et al. Blood. .

Abstract

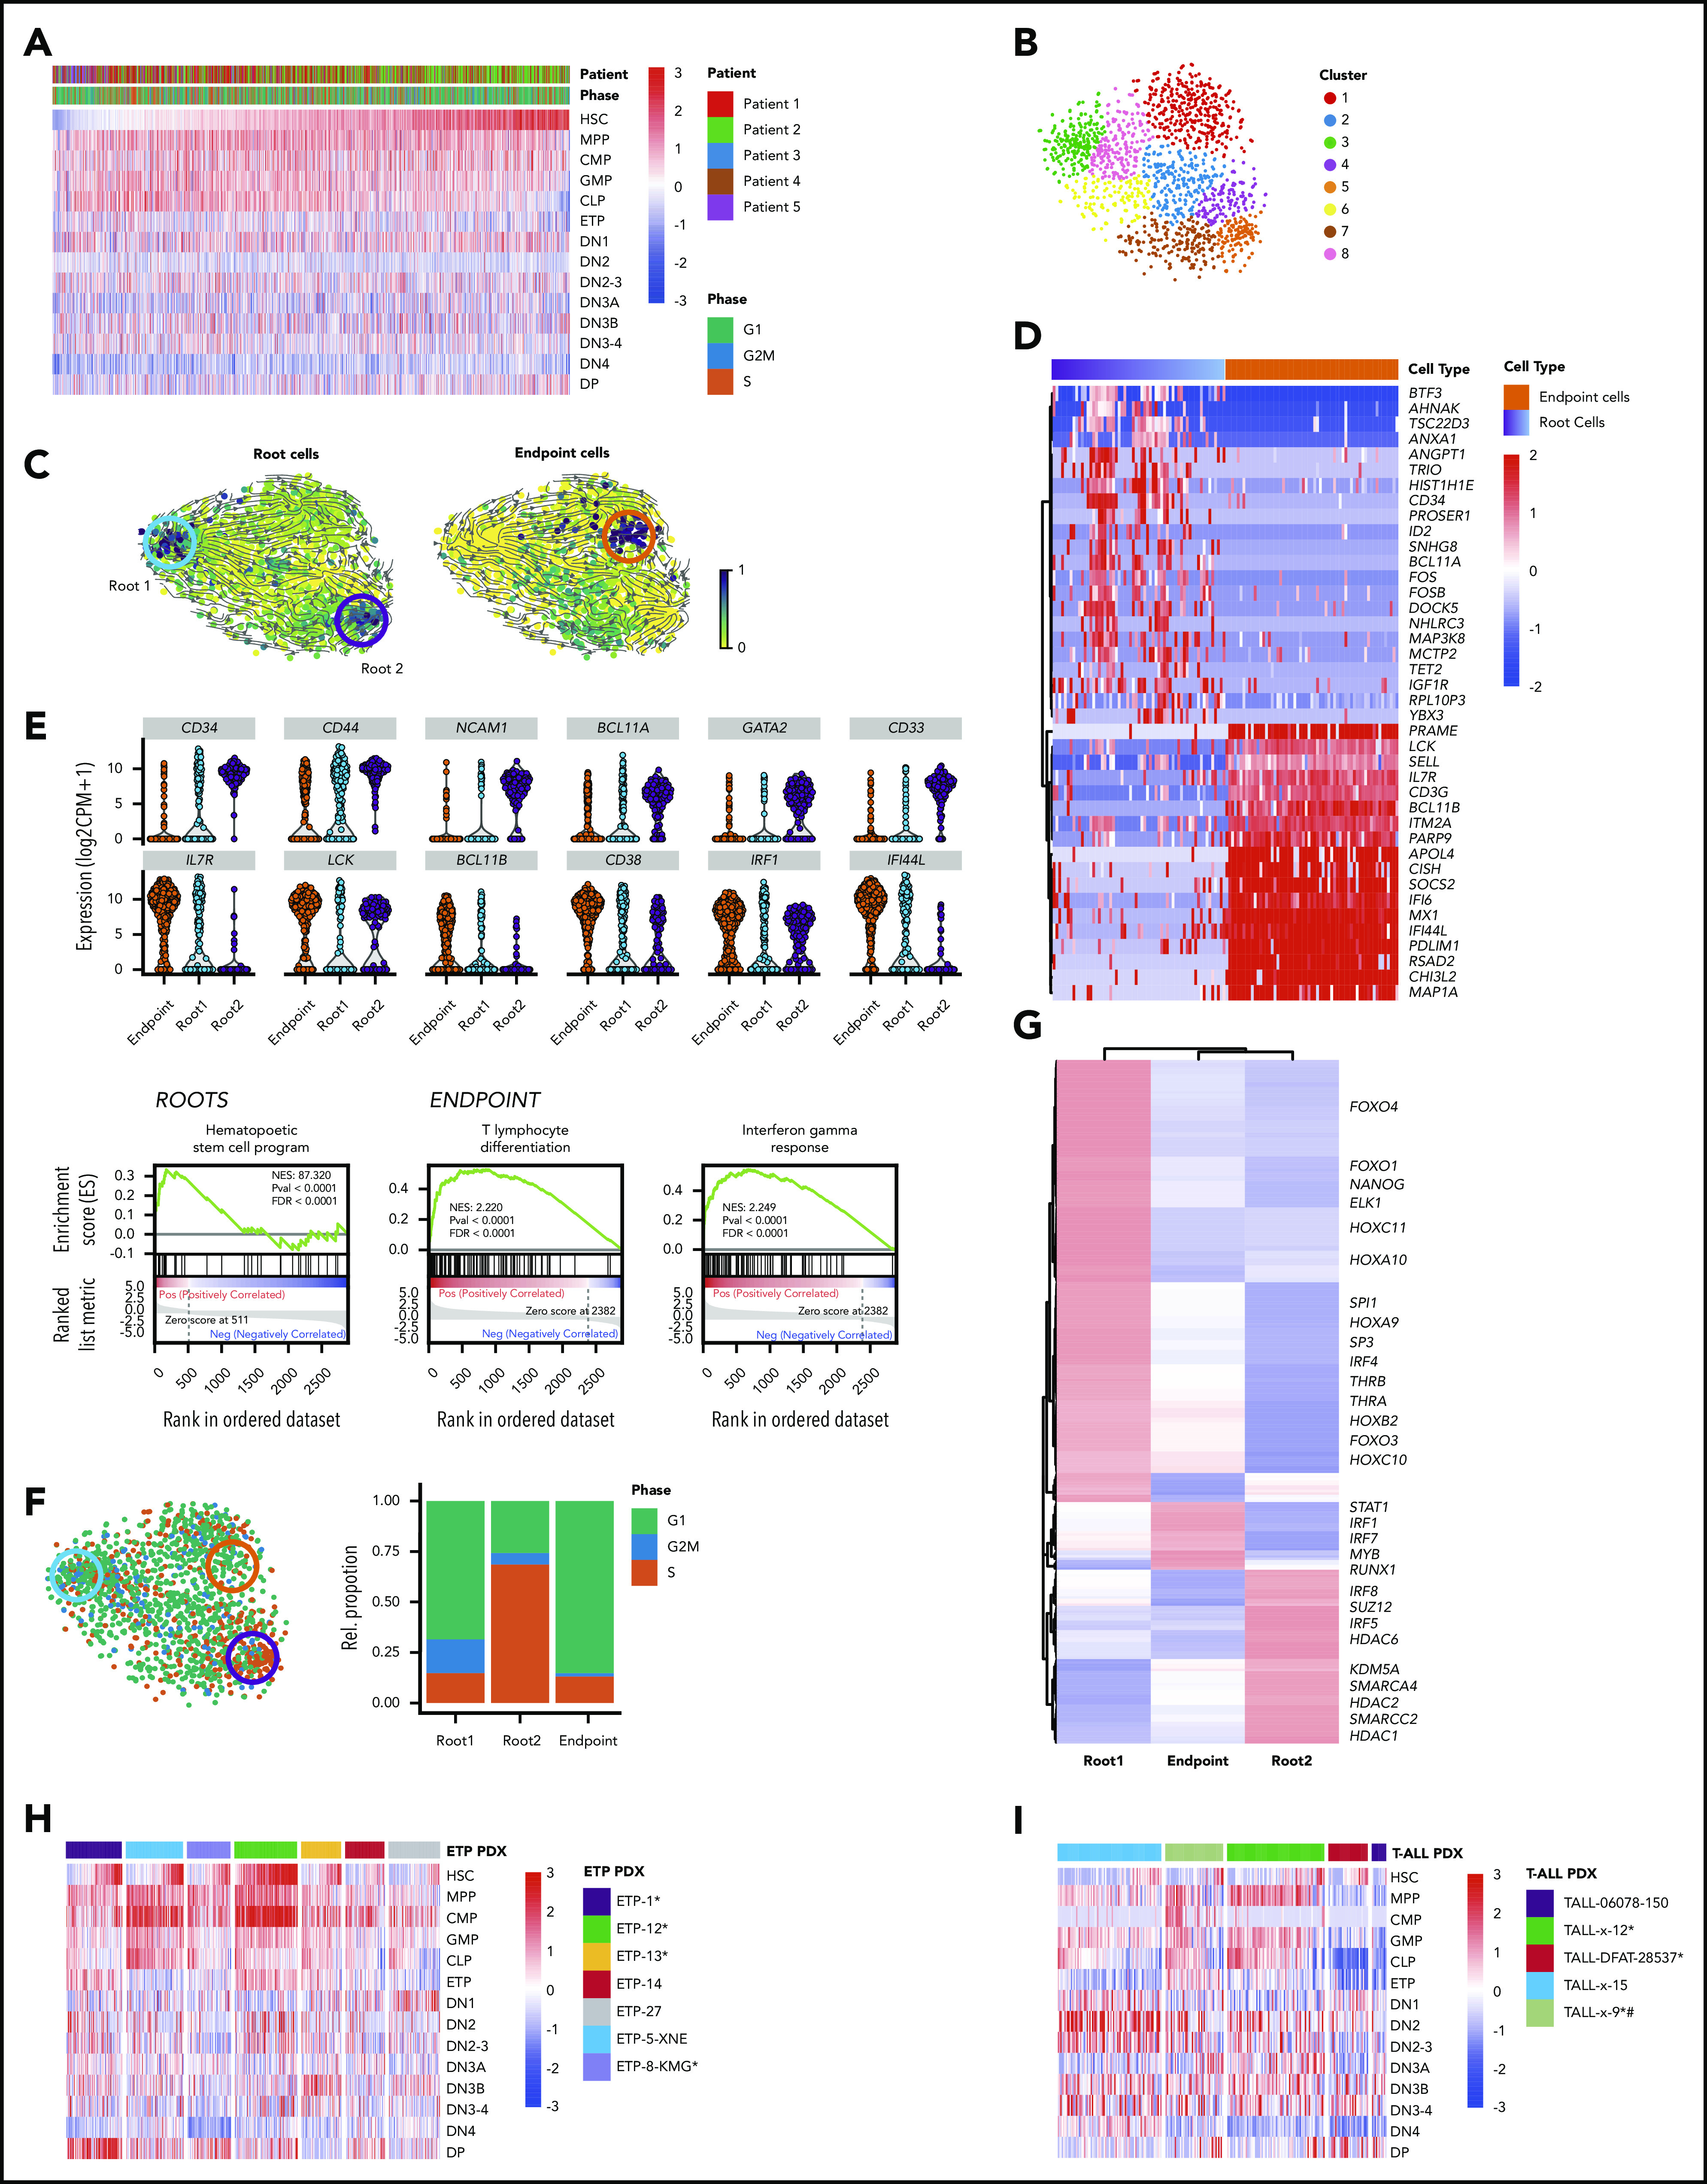
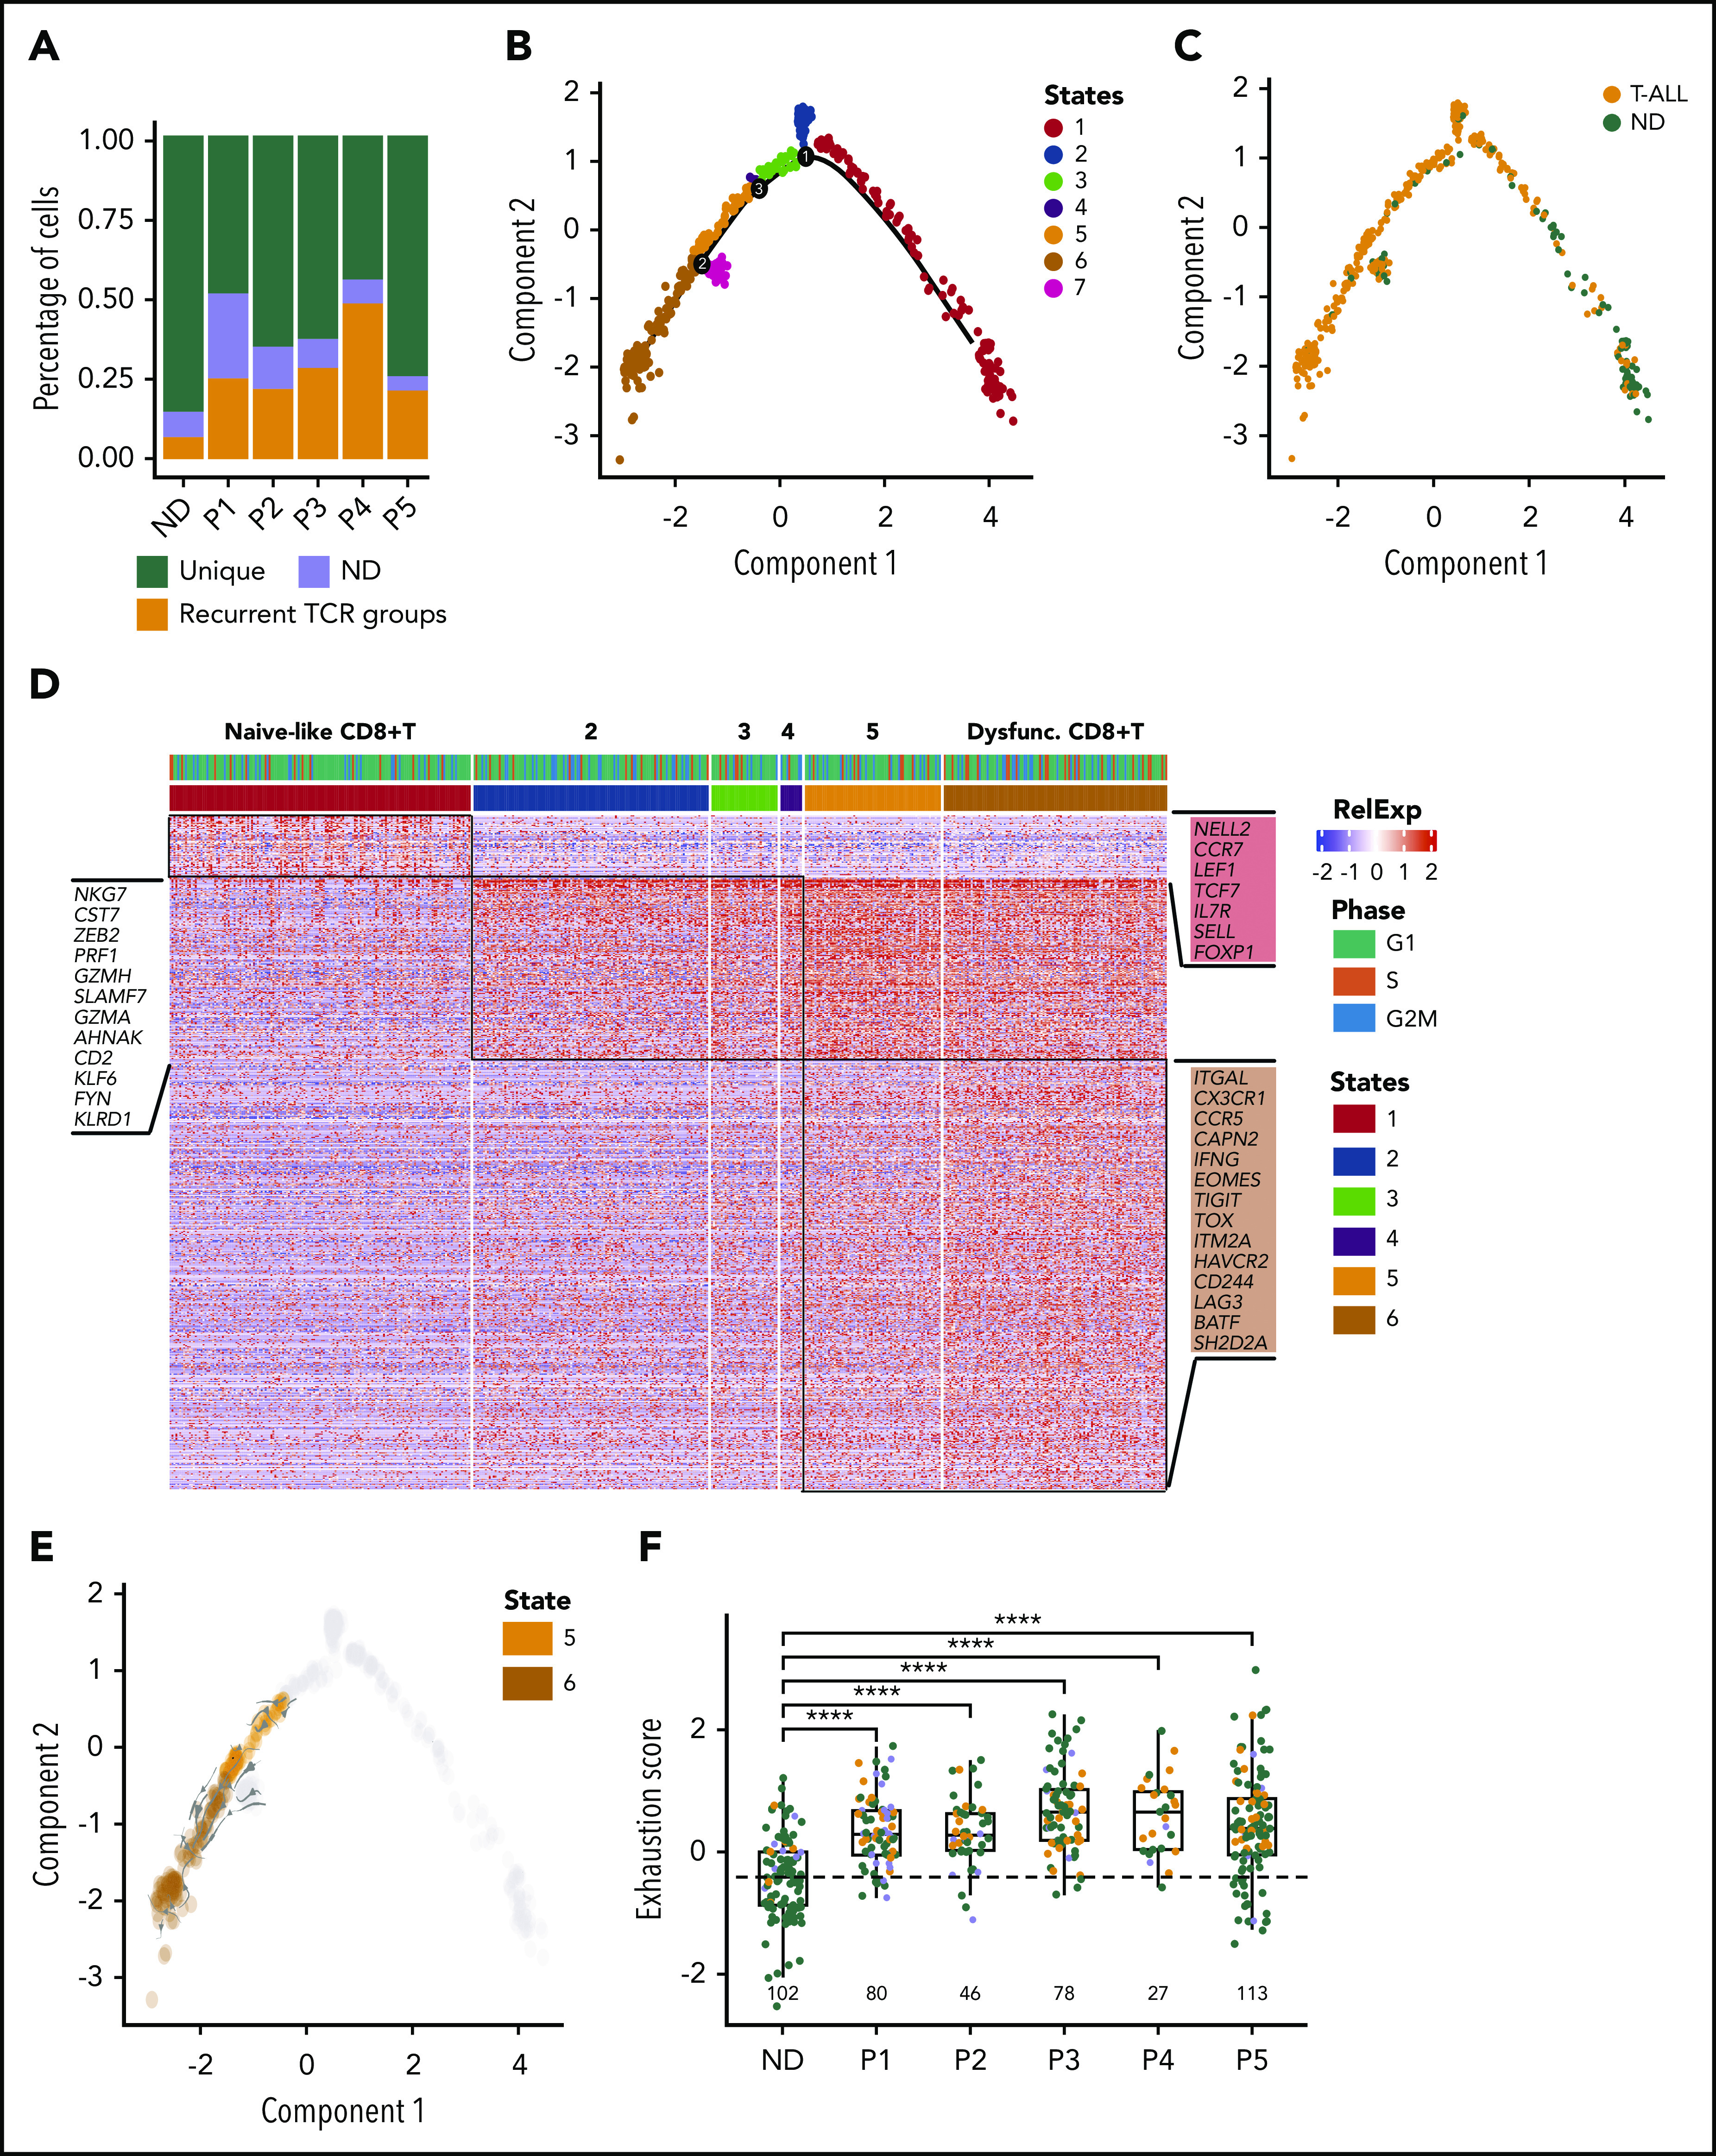
Lineage plasticity and stemness have been invoked as causes of therapy resistance in cancer, because these flexible states allow cancer cells to dedifferentiate and alter their dependencies. We investigated such resistance mechanisms in relapsed/refractory early T-cell progenitor acute lymphoblastic leukemia (ETP-ALL) carrying activating NOTCH1 mutations via full-length single-cell RNA sequencing (scRNA-seq) of malignant and microenvironmental cells. We identified 2 highly distinct stem-like states that critically differed with regard to cell cycle and oncogenic signaling. Fast-cycling stem-like leukemia cells demonstrated Notch activation and were effectively eliminated in patients by Notch inhibition, whereas slow-cycling stem-like cells were Notch independent and rather relied on PI3K signaling, likely explaining the poor efficacy of Notch inhibition in this disease. Remarkably, we found that both stem-like states could differentiate into a more mature leukemia state with prominent immunomodulatory functions, including high expression of the LGALS9 checkpoint molecule. These cells promoted an immunosuppressive leukemia ecosystem with clonal accumulation of dysfunctional CD8+ T cells that expressed HAVCR2, the cognate receptor for LGALS9. Our study identified complex interactions between signaling programs, cellular plasticity, and immune programs that characterize ETP-ALL, illustrating the multidimensionality of tumor heterogeneity. In this scenario, combination therapies targeting diverse oncogenic states and the immune ecosystem seem most promising to successfully eliminate tumor cells that escape treatment through coexisting transcriptional programs.


Conflict of interest statement

Conflict-of-interest disclosure: J.G.L. receives research funding from Celgene for an unrelated research project and is an advisor for T2 Biosystems. B.E.B. discloses financial interests in Fulcrum Therapeutics, 1CellBio, HiFiBio, Arsenal Biosciences, Cell Signaling Technologies, and Nohla Therapeutics. J.C.A. is an advisor for Cellestia, Ayala, and Epizyme. The remaining authors declare no competing financial interests.

Figures

None
Graphical abstract
Figure 1.
Figure 1.
ETP-ALL cells have distinct transcriptional profile. (A) Schematic depicting the cohort, sample collection, processing and sorting of cells for single-cell transcriptional profiling using SMART-seq2 protocol. (B) t-SNE of the processed single-cell RNA-seq gene expression data reveals distinct patient-specific clusters along with heterogeneous clusters. (C) Clusters were further analyzed using PAGODA2 to identify the cell type of individual cells. (D) Correlation distance matrix (1-Pearson correlation coefficient) derived from normalized gene expression values of individual malignant cells. The silhouette plot on top of the matrix depicts the uniqueness of each of the patient-specific malignant clusters. (E) Marker gene analyses identify heterogeneous clusters as CD4+ T cells, CD8+ T cells, natural killer (NK) cells, B cells, and myeloid cells. Expression of the top marker genes for each of the clusters containing normal cells is depicted as heatmap. (F) Cells from normal donors are highlighted in the heatmap (top) and fall into normal cell clusters. Malignant clusters identified by calling of those pathogenic variants (SNVs and CNVs) in single cells that were identified in individual patients by clinical targeted sequencing (middle; Table 1). Expression of transcription factors (TFs) distinguishing malignant cells from nonmalignant cells sequenced in this study (as inferred from random forest model). *NFE2 was ranked lower when only untreated leukemic cells were used to build the model, whereas *BCL11A was ranked higher.
Figure 2.
Figure 2.
Functional heterogeneity in ETP-ALL reveals deranged developmental hierarchy with coexisting stem-like states and ineffectual lineage commitment. (A) Heatmap demonstrates expression of HSC, MPP, CMP, GMP, CLP, ETP, DN1, DN2, DN2-3, DN3A, DN3B, DN3-4, DN4, and DP signatures as defined by xcell in individual leukemic cells. (B) t-SNE plot of all malignant cells using genes involved in HSC, CLP, and CMP progenitor programs. Clusters are derived using the Louvain algorithm. (C) RNA velocities projected on the t-SNE plot containing leukemic cells with root and endpoint cells highlighted (circles). (D) Heatmap depicting the expression of marker genes in the identified root and endpoint cells. (E) Violin plots depicting expression of key marker genes in root cells (top) and endpoint cells (bottom). Gene set enrichment analysis plots depicting the enrichment of HSC signature in root cells (left), differentiating T-lymphocyte signature (middle), and interferon-γ response (right) in endpoint cells. (F) t-SNE plot of leukemic cells colored based on the predicted cell-cycle phase (left), and relative percentage of cell-cycle phase in stacked bar plot for roots and endpoint states (right). (G) Heatmap depicting clustered transcriptional regulons (predicted transcription factor activity based on target gene expression) in root and endpoint cells (“Materials and methods”). (H-I) Heatmaps demonstrate expression of HSC, MPP, CMP, GMP, CLP, ETP, DN1, DN2, DN2-3, DN3A, DN3B, DN3-4, DN4, and DP signatures in ETP-ALL and T-ALL PDX models. *NOTCH1 mutated. #PTEN deleted.
Figure 3.
Figure 3.
Notch inhibition expands preexisting cells with PI3K signaling activity that coexist with Notch-dependent cells and demonstrate opposing differentiation trajectories. (A) t-SNE plot of leukemic cells colored based on GSI treatment with roots and endpoint highlighted as in Figure 2C. (B) Heatmap depicts the relative activity of various signaling pathways as inferred by PROGENy in all cells comprising the 2 root states. (C) Heatmap demonstrating preexisting cells with PI3K activity in untreated patients. (D) Violin plots show decreasing Notch activity with increasing PI3K activity upon GSI treatment in patient 5 (P5). (E) Violin plots depicting expression of Notch1 target genes (top) and PI3K pathway genes (bottom) in untreated and GSI-treated single cells of P5. (F) Scatter plot depicting negative correlation between relative Notch activity and PI3K activity in leukemic cells from all patients. Cells are colored based on GSI treatment. (G) Projection of RNA velocity vectors onto untreated leukemic cells plotted by PI3K and Notch activity (subclusters defined by monocle; supplemental Figure 14G). (H) Leukemic cells belonging to 2 different root states are highlighted and fall into either high PI3K or high Notch activity clusters. (I) Enrichment of endpoint cells at the interface of converging velocity trajectories. (J) Leukemic cells with high PI3K activity persist after GSI treatment with preserved directionality of RNA velocity (subclusters identified by monocle; supplemental Figure 14G). ****P ≤ .0001 using Kruskal-Wallis test.
Figure 4.
Figure 4.
Targeting preexisting drug-resistant leukemic cells with Notch/PI3K-directed combination therapy. (A) Heatmap depicts the relative activity of PI3K, Notch, PIM, and MYC activation signatures in single cells of ETP-ALL and T-ALL PDX samples. (B) Relative percentage of cell-cycle phase for root cells in ETP-ALL and T-ALL PDXs demonstrating lower cell-cycle activity in root 1 vs root 2. (C) Violin plots show Notch and PI3K activation in root 1 (PI3K high) and root 2 (Notch high) in ETP and T-ALL PDXs. (D) GSI and buparlisib are synergistic in KOPT-K1 T-ALL cells. Cell survival as assayed by CellTiter-Glo after 7-day culture (error bars reflect standard deviation [SD] from 3 replicates; left). Combination index analyses (3 replicates; right). (E) KOPT-K1 cells were pretreated with 1 μM buparlisib or DMSO for 3 days and then immediately sorted or cultured for an additional 24 hours without drug (Washout). Single cells from each of these populations were sorted into individual wells of 96-well plates and cultured with GSI (1 μM) or DMSO for 6 weeks. Bar plots indicate the fraction of single cells that form colonies in GSI (n = 480 wells). Pretreatment with buparlisib eliminates preexisting GSI-tolerant cells from untreated T-ALL populations, which cannot be reversed by 24-hour washout (error bars reflect SD, averaged from 5 plates, using 2-sided Student t test). (F) Flow cytometry demonstrating subpopulation of CD34+ cells with p4E-BP1(S65) and pAKT (Thr308) staining in KOPT-K1 cells (overlay histogram gated on CD34+ or CD34 cells, respectively; left). CD34+ population decreases with buparlisib treatment (barplot below; error bars reflect SD from 3 replicates). *NOTCH1 mutated, #PTEN deleted (A), **P < .01, ****P < .0001 using Kruskal-Wallis test (C), ****P < .0001 using 2-sided Student t test (E), *P < .05 using 2-sided t test (F). CI, combination index; Fa, fraction affected.
Figure 5.
Figure 5.
CD8+ T-cell dysfunction in ETP-ALL. (A) Stacked bar plots depict percentage of clonal CD8+ T cells observed in individuals as inferred from TCR group use. (B-C) Pseudotime trajectory of CD8+ T cells inferred using monocle. Cells color coded based on monocle states (B) and source of CD8+ T cells (C). (D) Heatmap depicting expression of state-specific markers obtained through monocle. Canonical marker genes for naïve CD8+ T cells, activation and exhaustion/dysfunction are annotated in the heatmap. (E) Projection of RNA velocity vectors on the CD8+ T-cell states 5 and 6. (F) Boxplots depict exhaustion score calculated for each CD8+ T cell of all individuals from relative gene expression values of canonical naïve and exhaustion gene markers (“Materials and methods”; green, unique TCR; orange, recurrent TCR; blue, not determined [n.d.]). ****P ≤ .0001. ND, normal donor.
Figure 6.
Figure 6.
HAVCR2-LGALS9 interactions on dysfunctional CD8+ T cells and leukemic blasts. (A) Violin plots depict expression of coinhibitory receptors (on dysfunctional CD8+ T cells, shown as open circles) and their interacting ligands (on malignant T-ALL cells, depicted as triangles). Colors represent malignant clusters based on PAGODA2 (Figure 1). Each box corresponds to expression of the indicated coinhibitory receptor-ligand combination. (B) Receptor-ligand interaction scores inferred from expression of receptors (in CD8+ T cells) and ligands (in T-ALL cells), respectively, pointing toward prominent HAVCR2-LGALS9 interaction. (C) IHC of LGALS9 and HAVCR2 on bone marrow from representative ETP-ALL patient (P2) demonstrates strong staining of LGALS9 on leukemic blasts and interspersed HAVCR2 staining on microenvironmental cells (magnification ×60). (D) Intracellular immunofluorescent staining of LGALS9 and isotype control in DND-41 T-ALL cells. (E) mRNA expression of T-cell dysfunction markers (HAVCR2 and TIGIT) and effector cytokines (GZMB, IL-2, and IFNγ) on normal donor activated CD8+ T cells cultured with T-ALL supernatant vs control media. *P < .05, **P < .01, ***P < .001, averaged from 3 technical replicates using 2-sided Student t test.

Comment in

References

    1. Belver L, Ferrando A. The genetics and mechanisms of T cell acute lymphoblastic leukaemia. Nat Rev Cancer. 2016;16(8):494-507. - PubMed
    1. Haydu JE, Ferrando AA. Early T-cell precursor acute lymphoblastic leukaemia. Curr Opin Hematol. 2013;20(4):369-373. - PMC - PubMed
    1. Ntziachristos P, Tsirigos A, Van Vlierberghe P, et al. . Genetic inactivation of the polycomb repressive complex 2 in T cell acute lymphoblastic leukemia. Nat Med. 2012;18(2):298-301. - PMC - PubMed
    1. Zhang J, Ding L, Holmfeldt L, et al. . The genetic basis of early T-cell precursor acute lymphoblastic leukaemia. Nature. 2012;481(7380):157-163. - PMC - PubMed
    1. Maude SL, Dolai S, Delgado-Martin C, et al. . Efficacy of JAK/STAT pathway inhibition in murine xenograft models of early T-cell precursor (ETP) acute lymphoblastic leukemia. Blood. 2015;125(11):1759-1767. - PMC - PubMed

Publication types

MeSH terms