. 2020 Nov 19;17(22):8570.
doi: 10.3390/ijerph17228570.

Isokinetic Testing: Sensitivity of the Force-Velocity Relationship Assessed through the Two-Point Method to Discriminate between Muscle Groups and Participants' Physical Activity Levels

Affiliations

Isokinetic Testing: Sensitivity of the Force-Velocity Relationship Assessed through the Two-Point Method to Discriminate between Muscle Groups and Participants' Physical Activity Levels

Danica Janicijevic et al. Int J Environ Res Public Health. .

Abstract

Background: Isokinetic testing has been routinely used to assess the capacities of individual muscle groups. In this study we aimed to evaluate the sensitivity of the force-point (F-v) relationship assessed through the two-point method to discriminate between antagonist muscle groups and males with different physical activity levels.

Methods: The concentric force output of the knee, hip, elbow, and shoulder flexors and extensors of 27 active and 13 non-active men was recorded at 60 and 180°/s to determine the F-v relationship parameters (maximum force [F0], maximum velocity [v0], and maximum power [Pmax]).

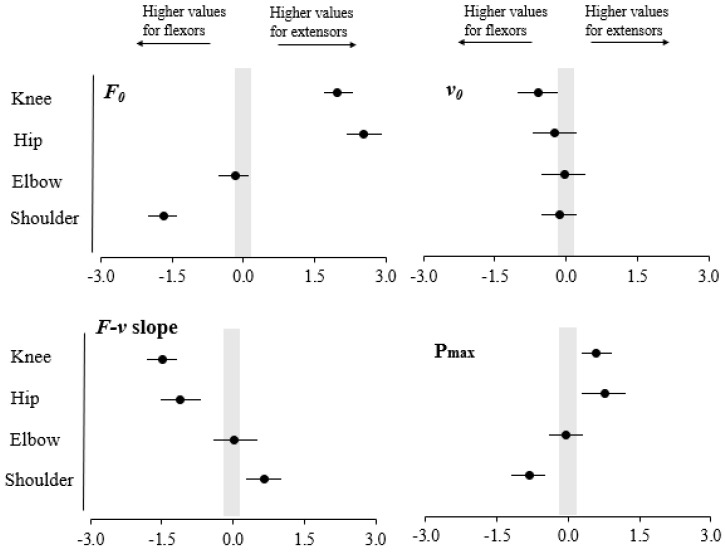
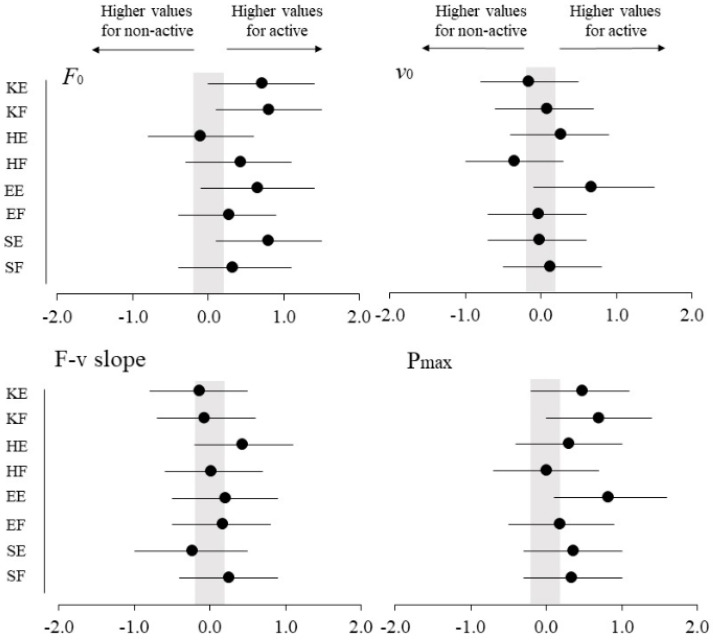
Results: F0 and Pmax were higher for knee extensors (effect size [ES] = 1.97 and 0.57, respectively), hip extensors (ES = 2.52 and 0.77, respectively), and shoulder flexors (ES = 1.67 and 0.83, respectively) compared to their antagonist muscles, while v0 was higher for knee flexors compared to knee extensors (ES = 0.59). Active males revealed higher F0 for knee extensors (ES = 0.72) and knee flexors (ES = 0.83) and higher Pmax for knee flexors (ES = 0.70), elbow extensors (ES = 0.83) and shoulder extensors (ES = 0.36).

Conclusions: The sensitivity of the two-point method for testing the maximal mechanical capacities was high for the knee, moderate for the hip and shoulder, and low for the elbow joint.

Keywords: elbow; extensors; flexors; hip; knee; shoulder.


Conflict of interest statement

The authors declare no conflict of interest

Figures

Figure 1
Figure 1
Linear regression models obtained from the force and velocity data averaged across the participants during the knee extension and flexion (upper-left panel), elbow extension and flexion (lower-left panel), hip extension and flexion (upper-right panel) and shoulder extension and flexion (lower-right panel) tasks. Straight and dashed lines represent extensor and flexor muscles, respectively. The error bars represent the standard deviation obtained by flexors (squares) and extensors (circles) groups.
Figure 2
Figure 2
Standardized differences (Effect sizes and 95% confidence intervals) for maximum force (F0; upper-left panel), maximum velocity (v0; upper-right panel), force-velocity slope (F-v slope; lower-left panel) and maximum power (Pmax; lower-right panel) between the antagonist muscle pairs acting on the knee, hip, elbow and shoulder joints (Effect size = Extensor mean − Flexor mean/SDboth). The probability that the true difference was trivial (ES from −0.20 to 0.20) or substantial is depicted.
Figure 3
Figure 3
Standardized differences (Effect sizes and 95% confidence intervals) for maximum force (F0; upper-left panel), maximum velocity (v0; upper-right panel), force-velocity slope (F-v slope; lower-left panel) and maximum power (Pmax; lower-right panel) between active and non-active groups for each muscle group. ES, effect size. KE, knee extension; KF, knee flexion; HE, hip extension; HF, hip flexion; EE, elbow extension; EF, elbow flexion; SE, shoulder extension; SF, shoulder flexion. (Effect size = Active mean − Non-active mean/SDboth). The probability that the true difference was trivial (ES from −0.20 to 0.20) or substantial is depicted.

Similar articles

Cited by

References

    1. Osternig L.R. Isokinetic dynamometry: Implications for muscle testing and rehabilitation. Exerc. Sport Sci. Rev. 1986;14:45–80. doi: 10.1249/00003677-198600140-00005. - DOI - PubMed
    1. Mayhew T.P., Rothstein J.M., Finucane S.D.G., Lamb R.L. Performance characteristics of the Kin-Com® dynamometer. Phys. Ther. 1994;74:1047–1054. doi: 10.1093/ptj/74.11.1047. - DOI - PubMed
    1. Drouin J.M., Valovich-McLeod T.C., Shultz S.J., Gansneder B.M., Perrin D.H. Reliability and validity of the Biodex system 3 pro isokinetic dynamometer velocity, torque and position measurements. Eur. J. Appl. Physiol. 2004;91:22–29. doi: 10.1007/s00421-003-0933-0. - DOI - PubMed
    1. Meyer C., Corten K., Wesseling M., Peers K., Simon J.P., Jonkers I., Desloovere K. Test-retest reliability of innovated strength tests for hip muscles. PLoS ONE. 2013;8:e81149. doi: 10.1371/journal.pone.0081149. - DOI - PMC - PubMed
    1. Holmes J.R., Alderink G.J. Isokinetic strength characteristics of the quadriceps femoris and hamstring muscles in high school students. Phys. Ther. 1984;64:914–918. doi: 10.1093/ptj/64.6.914. - DOI - PubMed

Publication types