Review
. 2020 Nov 19;12(11):1112.
doi: 10.3390/pharmaceutics12111112.

Particle Detection and Characterization for Biopharmaceutical Applications: Current Principles of Established and Alternative Techniques

Affiliations
Review

Particle Detection and Characterization for Biopharmaceutical Applications: Current Principles of Established and Alternative Techniques

Julia Gross-Rother et al. Pharmaceutics. .

Abstract

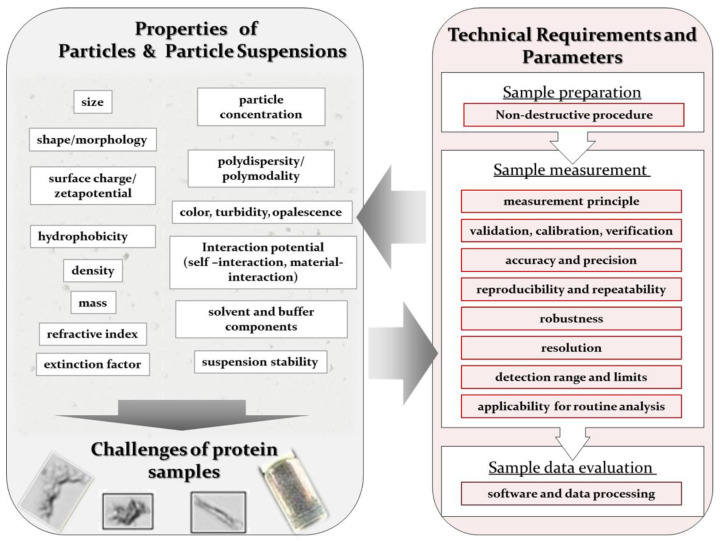
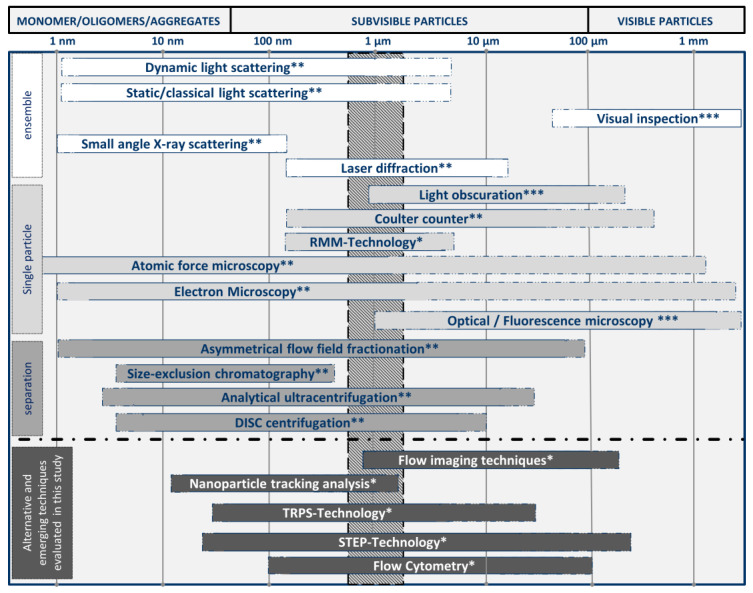
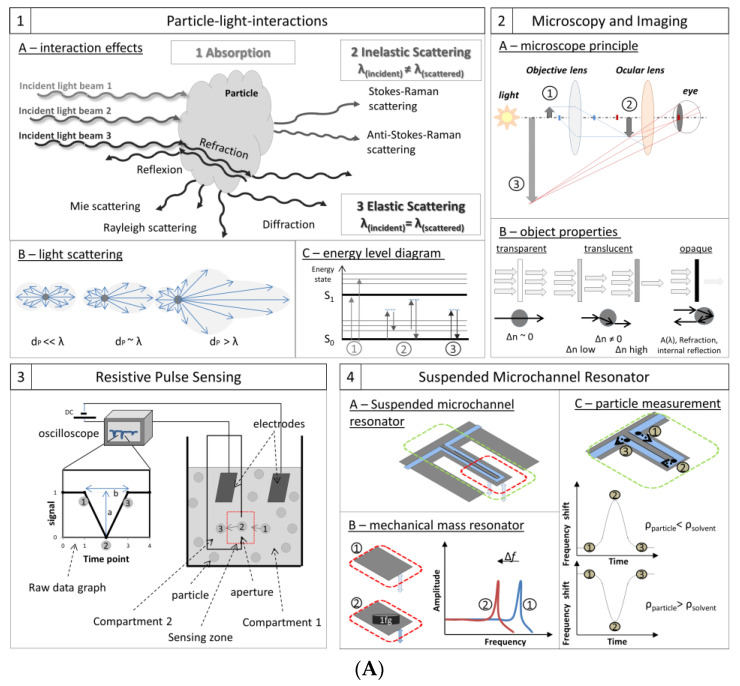
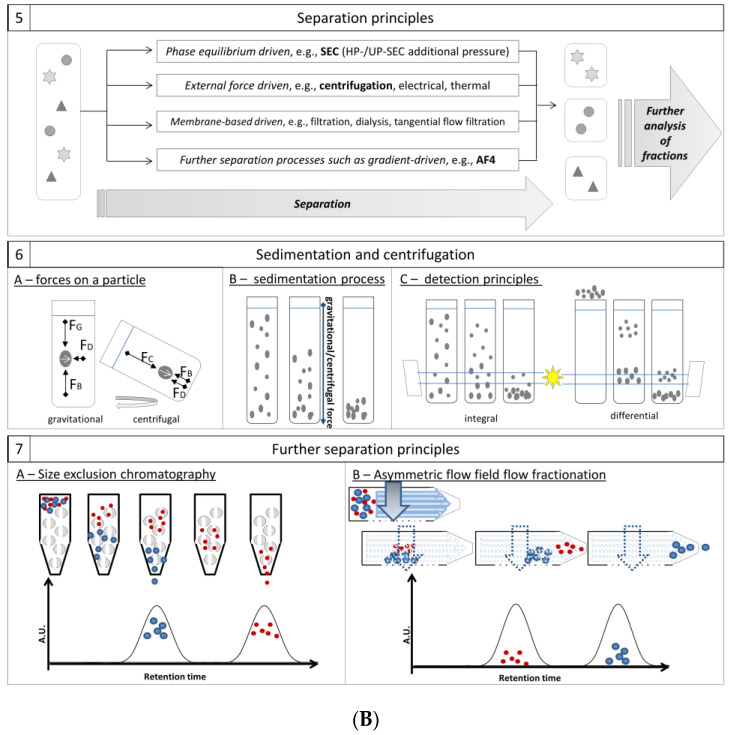
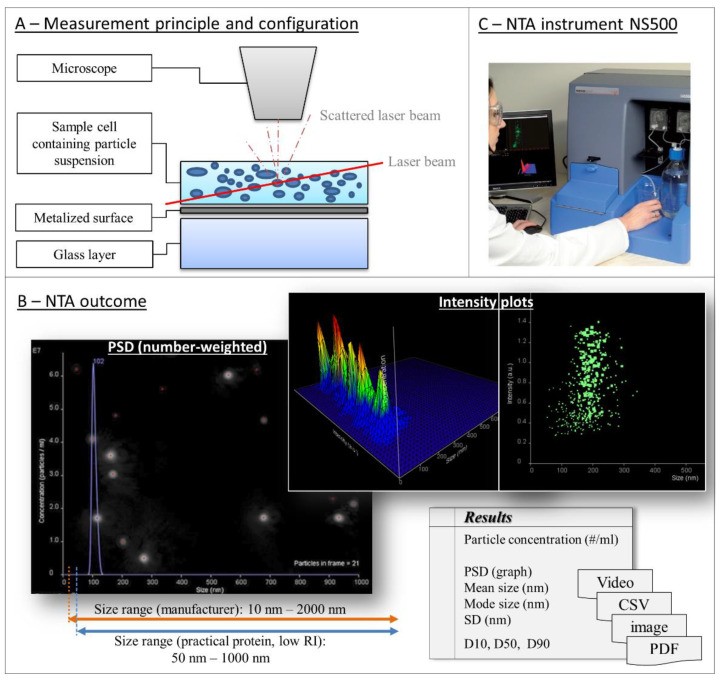
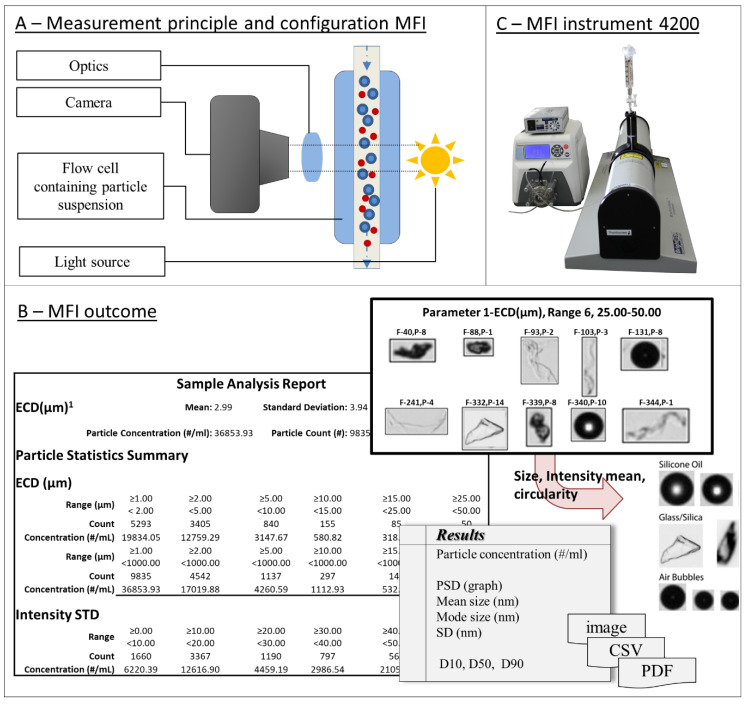
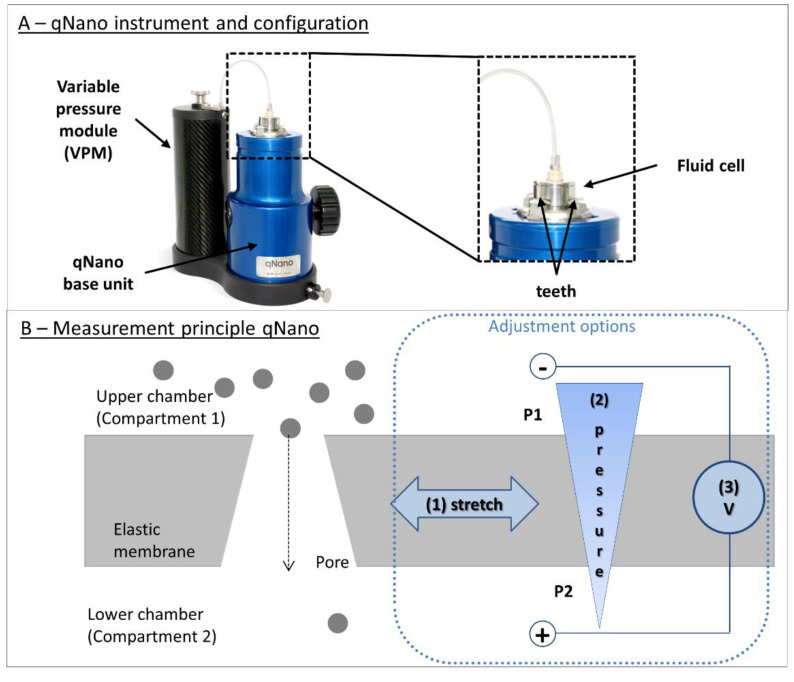
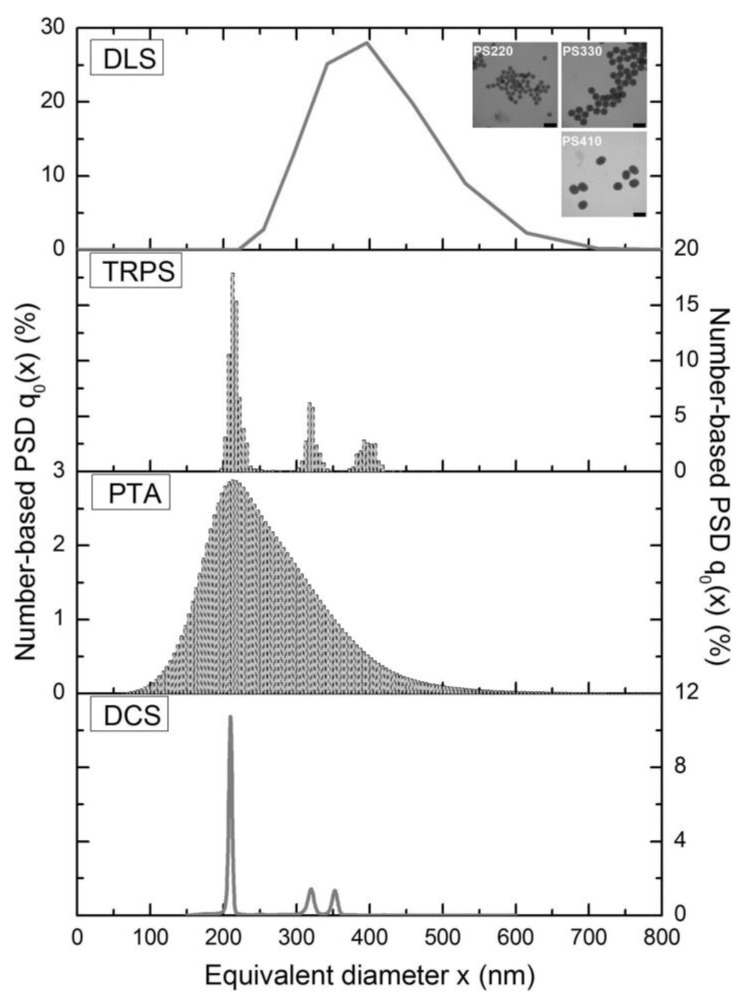
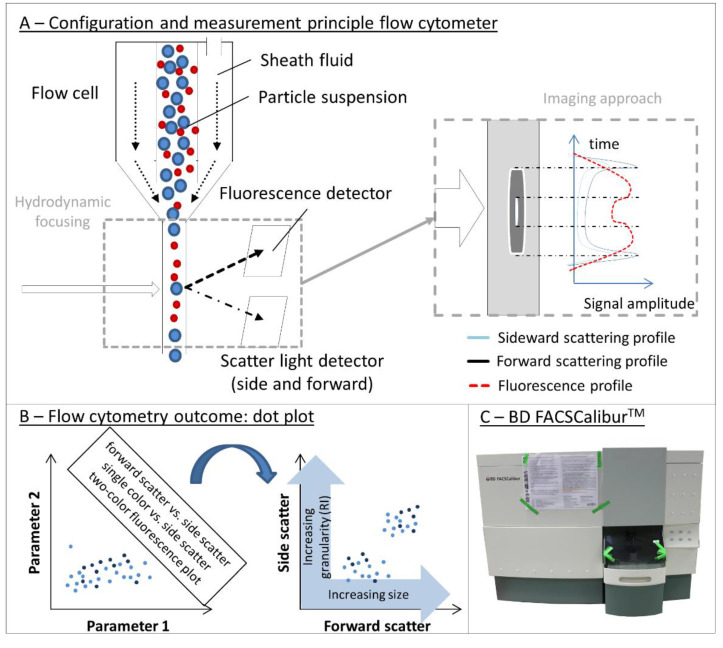
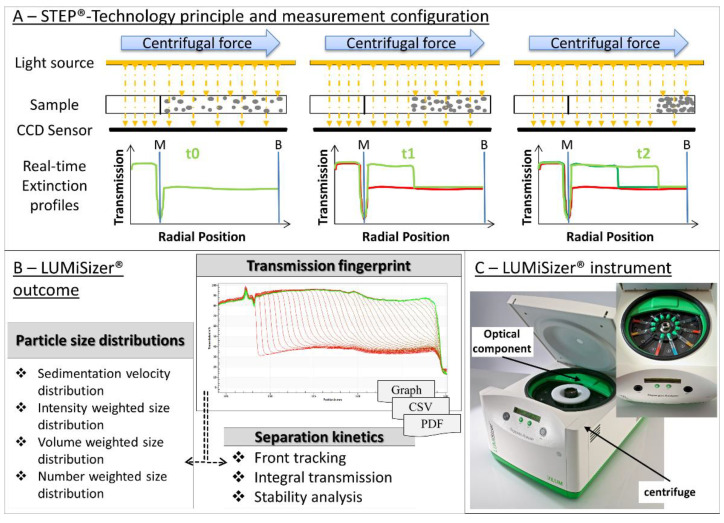
Detection and characterization of particles in the visible and subvisible size range is critical in many fields of industrial research. Commercial particle analysis systems have proliferated over the last decade. Despite that growth, most systems continue to be based on well-established principles, and only a handful of new approaches have emerged. Identifying the right particle-analysis approach remains a challenge in research and development. The choice depends on each individual application, the sample, and the information the operator needs to obtain. In biopharmaceutical applications, particle analysis decisions must take product safety, product quality, and regulatory requirements into account. Biopharmaceutical process samples and formulations are dynamic, polydisperse, and very susceptible to chemical and physical degradation: improperly handled product can degrade, becoming inactive or in specific cases immunogenic. This article reviews current methods for detecting, analyzing, and characterizing particles in the biopharmaceutical context. The first part of our article represents an overview about current particle detection and characterization principles, which are in part the base of the emerging techniques. It is very important to understand the measuring principle, in order to be adequately able to judge the outcome of the used assay. Typical principles used in all application fields, including particle-light interactions, the Coulter principle, suspended microchannel resonators, sedimentation processes, and further separation principles, are summarized to illustrate their potentials and limitations considering the investigated samples. In the second part, we describe potential technical approaches for biopharmaceutical particle analysis as some promising techniques, such as nanoparticle tracking analysis (NTA), micro flow imaging (MFI), tunable resistive pulse sensing (TRPS), flow cytometry, and the space- and time-resolved extinction profile (STEP®) technology.

Keywords: biopharmaceuticals; emerging particle techniques; particle characterization; particle detection; particle quantification; protein aggregates.


Conflict of interest statement

The authors declare no conflict of interest. J.G.-R., M.B. and P.G. are from Boehringer Ingelheim Pharma GmbH & Co. KG, Innovation Unit., the company had no role in the design of the study; in the collection, analyses, or interpretation of data; in the writing of the manuscript, or in the decision to publish the results.

Figures

Figure 1
Figure 1
Particle properties and resulting technical requirements. The left part summarizes some of the most investigated properties of particles. The right part monitors the analytic workflow and points out technical parameters essential for particle detection techniques. Both parts need to be considered to identify a suitable technique and to interpret the results of an analysis.
Figure 2
Figure 2
Overview particle detection techniques. Established (top part) and emerging (lower part) particle detection techniques are summarized according to their size measurement range. Their applicable size range is illustrated by the logarithmic scale at the top and the detection gap around 1 µm is highlighted by a grey bar. Further the techniques are classified into ensemble, single particle, and separation techniques. Stars indicate their current state: * emerging technique; ** established and often used techniques for pharmaceutical applications; *** techniques mentioned in US Pharmacopeia. RMM = Resonant Mass Measurement, DISC = Disc based centrifugation, TRPS = Tunable Resistive Pulse Sensing, STEP = Space- and Time-resolved Extinction Profile.
Figure 3
Figure 3
(A) Schematic illustration of important particle detection principles. The major principles of particle detection techniques, particle–light interactions (1), microscopy and imaging (2), resistive pulse sensing or Coulter principle (3), and suspended microchannel resonators (4) are summarized. (1A) There are different effects of particle–light interaction after an incident light beam encounters a particle. (1B) Based on the Mie theory light scattering intensities in a spatial cross area are characteristic for specific particle sizes (dP) depending on the wavelengths of the incident light beam. (1C) The final effects are determined by the energetic state the photon causes in the molecule. (2A) Microscopic magnification of tiny objects is based on a complex optical system. A reel image 2 of the object 1 is achieved by the objective lenses. This image is subsequently magnified by the ocular lenses to the virtual image 3. (2B) Depending on the optical properties of particles, e.g., the refractive index and its difference to the surrounding fluid, these particles show different effects and behavior by light interactions: transparent, translucent, or opaque. (3) A Coulter counter consists of two compartments filled with an electrolyte and connected by a small pore. In each compartment, an electrode is present, and a direct current is applied. Adding the particle to one compartment, they pass (1→2→3) the pore inducing a resistive pulse in the applied current. This pulse is monitored and gives information about the size by its amplitude, a, and its shape by the blockage duration, b. Furthermore, the pulse event frequency is correlated to the particle concentration. (4A) Schematic representation of a suspended microchannel resonator (SMR). (4B) Already the addition of 1 femtogram causes a frequency shift. (4C) If particles pass the microchannel the frequency changes. Depending on the density difference between particle and fluid, peaks appear either positive or negative. (B) Schematic illustration of important particle detection principles (i.e., general separation principles (5), sedimentation and centrifugation (6), and further established separation techniques (7)). (5) Overview about the general separation process and typical principles. (6A) The phenomenon of sedimentation/centrifugation is caused by the balance of three forces: FG gravity force, FD drag force, and FB buoyancy force. For centrifugal sedimentation the gravity force is replaced by the centrifugal force FC. (6B) During naturally occurring sedimentation processes, particles in suspension settle down (gravitational or centrifugal) in the direction of the gravitational or centrifugal force with a sedimentation velocity depending on their particle size and density. (6C) The sedimentation can either be detected and analyzed by an integral method (left) or by a differential method (right). (7A) The separation principle of size exclusion chromatography based on the molecular size is illustrated. The sample passes a resin containing pores and depending on particle size they either enter this pore leading to a delayed retention compared to larger particles that just flow through without entering. (7B) The separation principle of asymmetric flow-field flow fractionation based on hydrodynamic diffusion behavior is illustrated. The sample passes a channel with pores moving in a vertical flow. The application of a cross flow causes a separation of smaller particles that move faster in the parabolic flow and the larger particles closer to the channel wall.
Figure 3
Figure 3
(A) Schematic illustration of important particle detection principles. The major principles of particle detection techniques, particle–light interactions (1), microscopy and imaging (2), resistive pulse sensing or Coulter principle (3), and suspended microchannel resonators (4) are summarized. (1A) There are different effects of particle–light interaction after an incident light beam encounters a particle. (1B) Based on the Mie theory light scattering intensities in a spatial cross area are characteristic for specific particle sizes (dP) depending on the wavelengths of the incident light beam. (1C) The final effects are determined by the energetic state the photon causes in the molecule. (2A) Microscopic magnification of tiny objects is based on a complex optical system. A reel image 2 of the object 1 is achieved by the objective lenses. This image is subsequently magnified by the ocular lenses to the virtual image 3. (2B) Depending on the optical properties of particles, e.g., the refractive index and its difference to the surrounding fluid, these particles show different effects and behavior by light interactions: transparent, translucent, or opaque. (3) A Coulter counter consists of two compartments filled with an electrolyte and connected by a small pore. In each compartment, an electrode is present, and a direct current is applied. Adding the particle to one compartment, they pass (1→2→3) the pore inducing a resistive pulse in the applied current. This pulse is monitored and gives information about the size by its amplitude, a, and its shape by the blockage duration, b. Furthermore, the pulse event frequency is correlated to the particle concentration. (4A) Schematic representation of a suspended microchannel resonator (SMR). (4B) Already the addition of 1 femtogram causes a frequency shift. (4C) If particles pass the microchannel the frequency changes. Depending on the density difference between particle and fluid, peaks appear either positive or negative. (B) Schematic illustration of important particle detection principles (i.e., general separation principles (5), sedimentation and centrifugation (6), and further established separation techniques (7)). (5) Overview about the general separation process and typical principles. (6A) The phenomenon of sedimentation/centrifugation is caused by the balance of three forces: FG gravity force, FD drag force, and FB buoyancy force. For centrifugal sedimentation the gravity force is replaced by the centrifugal force FC. (6B) During naturally occurring sedimentation processes, particles in suspension settle down (gravitational or centrifugal) in the direction of the gravitational or centrifugal force with a sedimentation velocity depending on their particle size and density. (6C) The sedimentation can either be detected and analyzed by an integral method (left) or by a differential method (right). (7A) The separation principle of size exclusion chromatography based on the molecular size is illustrated. The sample passes a resin containing pores and depending on particle size they either enter this pore leading to a delayed retention compared to larger particles that just flow through without entering. (7B) The separation principle of asymmetric flow-field flow fractionation based on hydrodynamic diffusion behavior is illustrated. The sample passes a channel with pores moving in a vertical flow. The application of a cross flow causes a separation of smaller particles that move faster in the parabolic flow and the larger particles closer to the channel wall.
Figure 4
Figure 4
Nanoparticle tracking analysis (NTA): instrument, measuring principle, and final outcome. (A) Schematic illustration of the measurement principle of the NTA instrument (Nanosight Ltd.). The particle suspension is pumped into the sample cell where the laser beam encounters the particle causing light scattering. The light scattering centers of each particle are recorded and afterwards used to determine the Brownian motion of each particle indirectly by the motion of the scatter center. (B) Example of a measurement result using the provided instrument software. The recorded scattering centers are tracked and finally the number-weighted PSD, 2D and 3D intensity plots and a total particle concentration are provided. The results are obtained as video file, graph image files, text file (.csv), and PDF-file. (C) NTA instrument NS500 (Nanosight Ltd.). Adapted with permission from [195], Elsevier, 2011.
Figure 5
Figure 5
Micro-flow imaging (MFI): instrument, measuring principle, and final result. (A) Schematic illustration of the measurement principle of the MFI instruments (Protein Simple). The particle suspension is pumped into the flow cell where the camera captures bright field images as raw data. (B) After analyzing the images by an imaging software considering the amount and the greyscale of each pixel a report is generated. This report contents number-weighted PSD as well as example images of single particles. Due to properties like size, intensity mean, or circularity, filters can be applied to obtain and analyze particles with specific properties. The results are obtained as particle image files, text file (.csv), and PDF-file. (C) MFI instrument DPA 4200 (Protein Simple).
Figure 6
Figure 6
Tunable resistive pulse sensing technology (TRPS): instrument, specific pores, and measurement principle. (A) Configuration of the qNano instrument using the TRPS technology (Izon Science Ltd.) zooming from the complete device (left) to the specimen with the tunable nanopore (right). Image adapted with permission from a product of Izon Science Ltd., 2020. (B) Schematic illustration of the measurement principle of the qNano instrument. The suspended particles in the upper compartment pass through the pore and cause the resistive pulse. There are three options to adjust the instrument for optimal settings for the specific sample: mechanical pore stretching, pressure difference adjustment, and the applied direct current voltage (right).
Figure 7
Figure 7
Comparison study of dynamic light scattering, tunable resistive pulse sensing, nanoparticle tracking analysis, and disc centrifugation concerning the resolution of a trimodal polystyrene particle suspension. Three polystyrene particle standards with sizes of 220, 330, and 410 nm—as seen in the images—have been analyzed as a trimodal mixture. This mixture was subsequently analyzed by dynamic light scattering (DLS), (nano-)particle tracking analysis (PTA), disc centrifugation (DCS), and tunable resistive pulse sensing (TRPS). In result only TRPS showed sufficient accuracy, resolution, and precision for the polymodal suspension. Adapted with permission from [34], Elsevier, 2013.
Figure 8
Figure 8
Flow cytometry (FC): instrument, measuring principle, and final outcome. (A) Schematic illustration of the measurement principle of a flow cytometry instrument. The particle suspension is injected into a flow cell. On the outer side a sheath fluid is applied and results into a hydrodynamic focusing. After this focusing the suspension enters a narrow capillary. At a fixed position of the capillary a light beam encounters the particle and the fluorescence signal as well as the scattered light (sideward and forward) is detected (left part). An emerging approach is the recording of a specific signal profile (right part) which leads to a more detailed characterization and even visualization of each particle. (B) The final results of FC measurements are dot plots considering multiple detected parameters, e.g., fluorescence, forward scattering or sideward scattering. (C) Exemplary, the BD FACS Calibur as a flow cytometer enabling particle detection and characterization.
Figure 9
Figure 9
Space- and time-resolved extinction profile (STEP): instrument, measuring principle, and final outcome. (A) Schematic illustration of the STEP® technology measurement principle. The particle suspension is homogenously distributed. Light is applied the over the whole sample and the transmission light is detected behind the sample over the whole lengths. The application of a centrifugal force leads to particle movement from the meniscus M to the cuvette bottom B. The clarification over time and a specific sedimentation velocity can be calculated. (B) The direct result achieved is the transmission fingerprint. Based on this various data analysis possibilities are provided by the software. Depending on the information known about the sample particles a wide variety of analysis and data evaluations are possible. The results are obtained as video file, graph image files, text file (.csv), and PDF-file. (C) LUMiSizer STEP® instrument (LUM GmbH) Image adapted with permission from a product of LUM GmbH, 2020.

Similar articles

Cited by

References

    1. Singh S.K., Vaidya Y., Gulati M., Bhattacharya S., Garg V., Pandey N.K. Nanosuspension: Principles, Perspectives and Practices. Curr. Drug Deliv. 2016;13:1222–1246. doi: 10.2174/1567201813666160101120452. - DOI - PubMed
    1. Silva A.L., Soema P.C., Slütter B., Ossendorp F., Jiskoot W. PLGA particulate delivery systems for subunit vaccines: Linking particle properties to immunogenicity. Hum. Vaccin. Immunother. 2016;12:1056–1069. doi: 10.1080/21645515.2015.1117714. - DOI - PMC - PubMed
    1. Cai C., Bakowsky U., Rytting E., Schaper A.K., Kissel T. Charged nanoparticles as protein delivery systems: A feasibility study using lysozyme as model protein. Eur. J. Pharm. Biopharm. 2008;69:31–42. doi: 10.1016/j.ejpb.2007.10.005. - DOI - PubMed
    1. Loureiro J.A., Gomes B., Fricker G., Coelho M.A.N., Rocha S., Pereira M.C. Cellular uptake of PLGA nanoparticles targeted with anti-amyloid and anti-transferrin receptor antibodies for Alzheimer’s disease treatment. Colloids Surf. B Biointerfaces. 2016;145:8–13. doi: 10.1016/j.colsurfb.2016.04.041. - DOI - PubMed
    1. Estep P., Caffry I., Yu Y., Sun T., Cao Y., Lynaugh H., Jain T., Vásquez M., Tessier P.M., Xu Y. An alternative assay to hydrophobic interaction chromatography for high-throughput characterization of monoclonal antibodies. MAbs. 2015;7:553–561. doi: 10.1080/19420862.2015.1016694. - DOI - PMC - PubMed

LinkOut - more resources