. 2020 Nov 19;12(11):3438.
doi: 10.3390/cancers12113438.

Sonic Hedgehog Signature in Pediatric Primary Bone Tumors: Effects of the GLI Antagonist GANT61 on Ewing's Sarcoma Tumor Growth

Affiliations

Sonic Hedgehog Signature in Pediatric Primary Bone Tumors: Effects of the GLI Antagonist GANT61 on Ewing's Sarcoma Tumor Growth

Mathilde Mullard et al. Cancers (Basel). .

Abstract

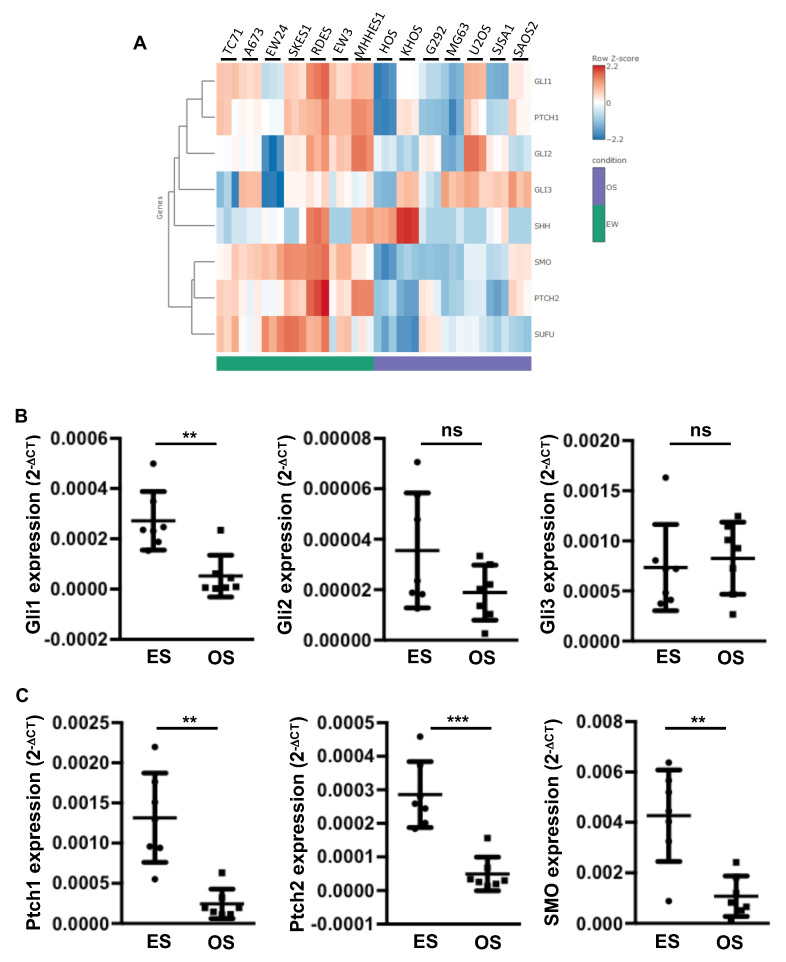
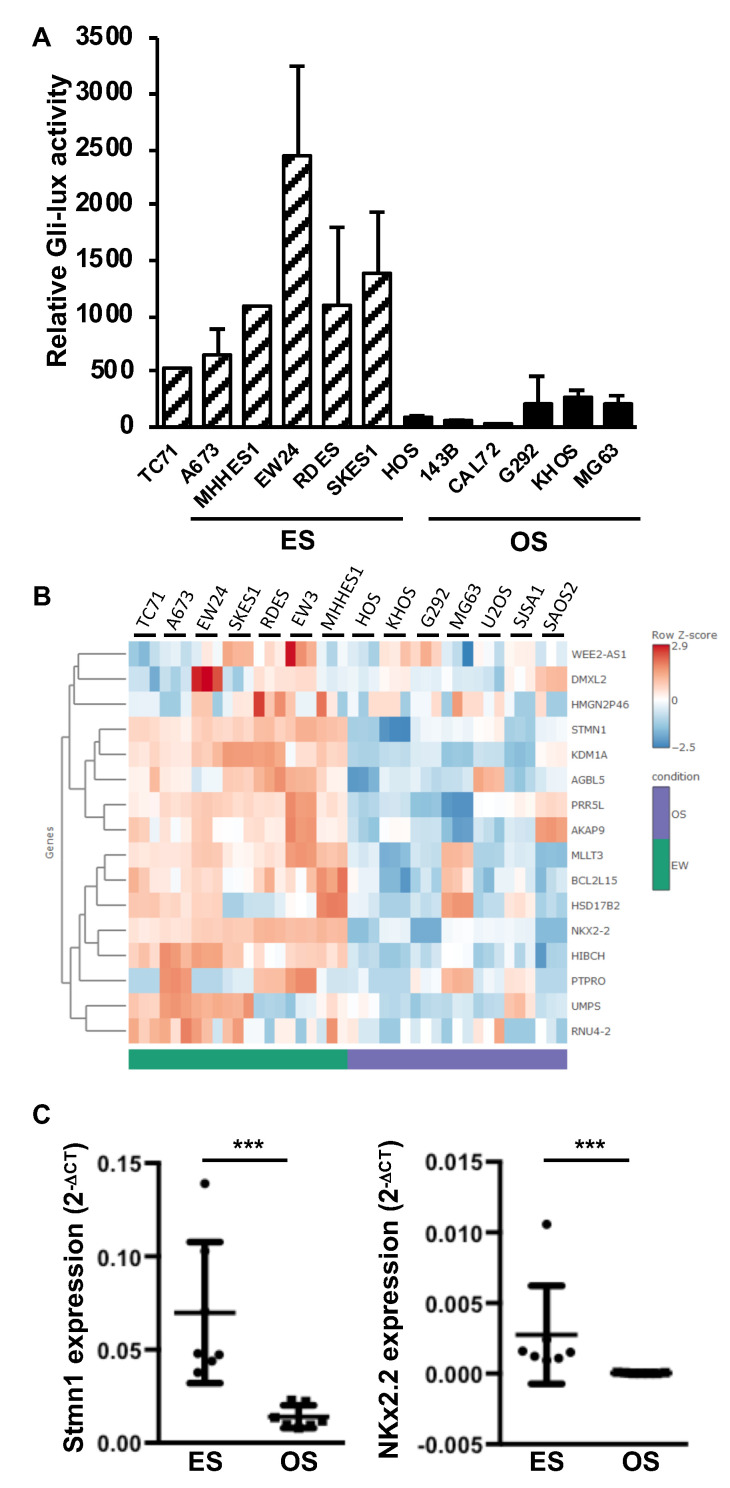
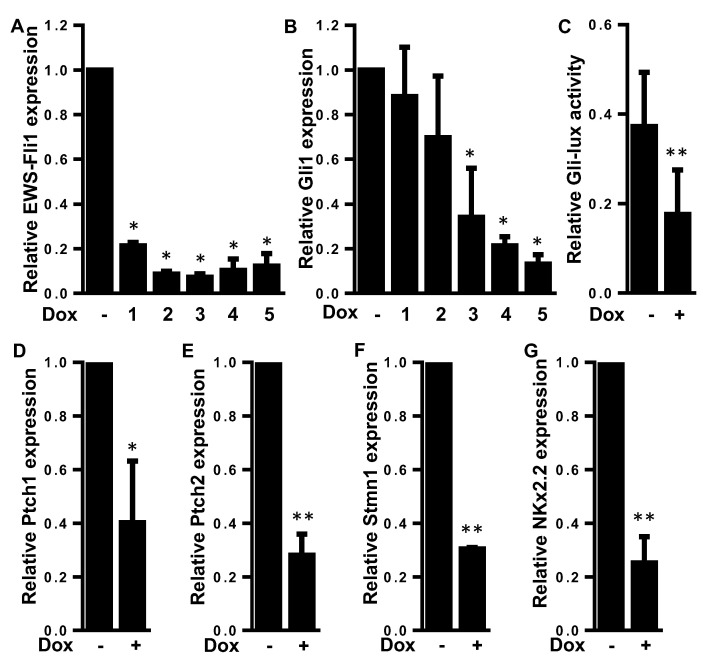
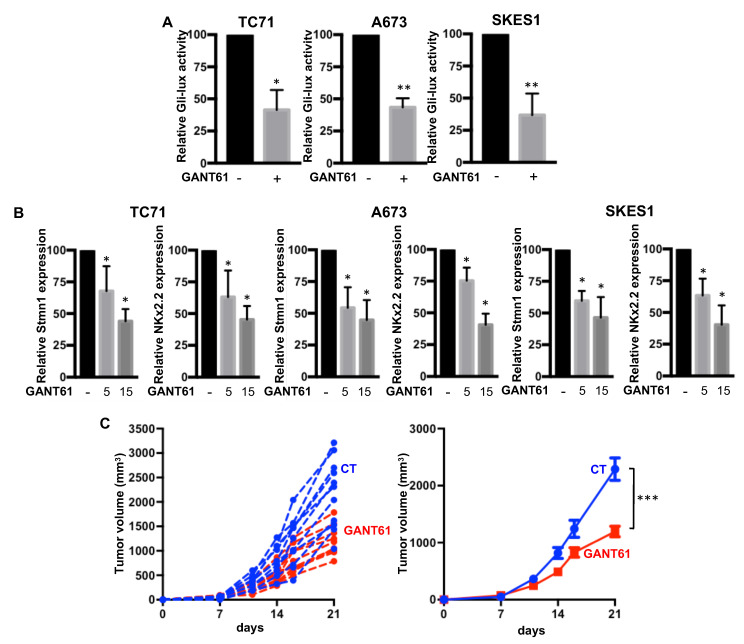
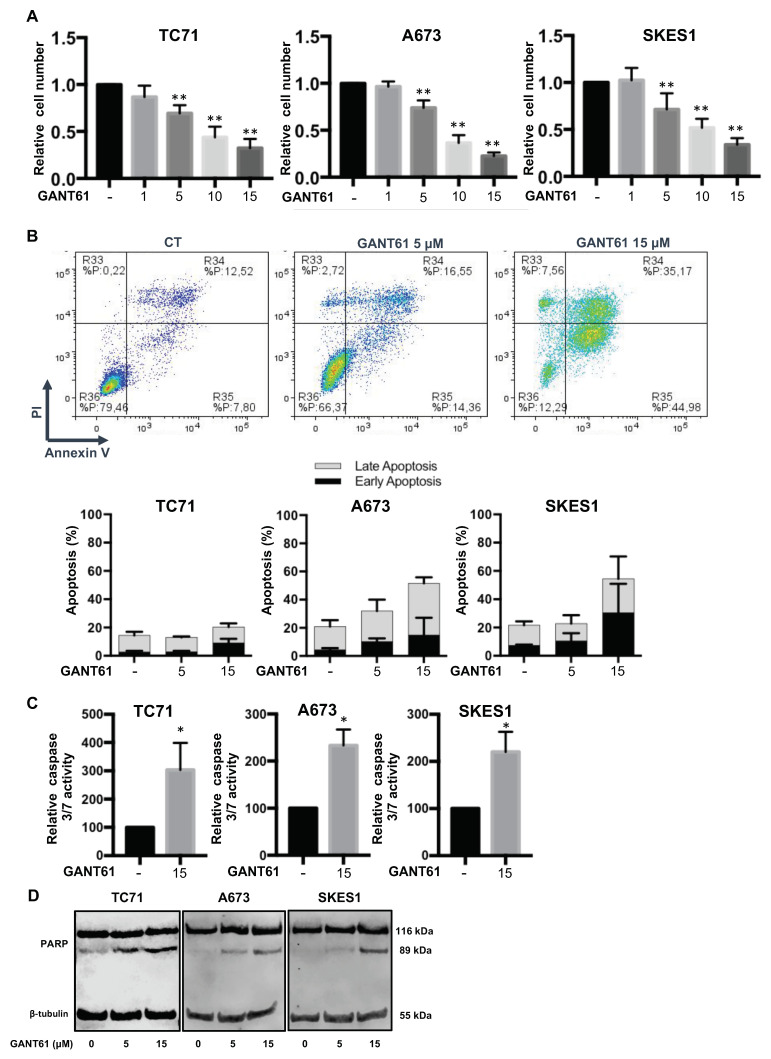
Osteosarcoma (OS) and Ewing's sarcoma (ES) are the most common malignant bone tumors in children and adolescents. In many cases, the prognosis remains very poor. The Sonic hedgehog (SHH) signaling pathway, strongly involved in the development of many cancers, regulate transcription via the transcriptional factors Gli1-3. In this context, RNAseq analysis of OS and ES cell lines reveals an increase of some major compounds of the SHH signaling cascade in ES cells, such as the transcriptional factor Gli1. This increase leads to an augmentation of the transcriptional response of Gli1 in ES cell lines, demonstrating a dysregulation of Gli1 signaling in ES cells and thus the rationale for targeting Gli1 in ES. The use of a preclinical model of ES demonstrates that GANT61, an inhibitor of the transcriptional factor Gli1, reduces ES primary tumor growth. In vitro experiments show that GANT61 decreases the viability of ES cell, mainly through its ability to induce caspase-3/7-dependent cell apoptosis. Taken together, these results demonstrates that GANT61 may be a promising therapeutic strategy for inhibiting the progression of primary ES tumors.

Keywords: GANT61; Gli1; SHH; ewing’s sarcoma; osteosarcoma; primary tumor growth.


Conflict of interest statement

The authors declare no conflict of interest.

Figures

Figure 1
Figure 1
Increased expression of the Sonic hedgehog (SHH) cascade compounds in Ewing’s sarcoma (ES) cell lines. (A) heatmap showing color-coded expression of SHH cascade compounds in seven osteosarcoma (OS) cells and seven ES cells following bioinformatics analysis of RNAseq data. High expression (red); low expression (blue). (B,C) Gli1, Gli2, Gli3 (B) and Patch (Ptch)1, Ptch2 and Smoothened (SMO) (C) mRNA steady-state levels were quantified by RT-qPCR analysis of seven OS cells and seven ES cells (each point represents the value of one cell line, bars indicate means ± SD of 3 independent experiments, each performed in triplicate, ** p < 0.005; *** p < 0.001).
Figure 2
Figure 2
Elevation of Gli1 target gene expression in ES cell lines. (A) six ES cells (TC71, A673, MHHES1, EW24, RDES and SKES1) and six OS cells (HOS, 143B, CAL72, G292, KHOS and MG63) were transiently transfected with the Gli-lux construct. Bars indicate means ± SD of 3 independent experiments, each performed in duplicate. (B) heatmap showing color-coded expression of SHH target genes in six OS cells and six ES cells following bioinformatics analysis of RNAseq data. High expression (red); low expression (blue). (C) Stmn1 and NKX2.2 mRNA steady-state levels were quantified by RT-qPCR analysis of seven OS cells and seven ES cells (each point represents the value of one cell line, bars indicate means ± SD of three independent experiments, each performed in triplicate, *** p < 0.001).
Figure 3
Figure 3
EWS-FLI1 drives the expression of Gli1 and the Gli transcriptional response in ES. (A,B) A673-1c ES cells were treated or not with doxycycline (1 μg/mL) during 1 to 5 days. EWS-FLI1 (A) and Gli1 (B) mRNA steady-state levels were quantified by RT-qPCR analysis. Bars indicate means ± SD of three independent experiments, each performed in triplicate (* p < 0.05). (C) A673-1c ES cells were treated or not with doxycycline (1 μg/mL). Then, 48 h after cells were transfected with the Gli-specific construct Gli-lux, and treated or not with doxycycline for another 24 h. Bars indicate means ± SD of three independent experiments, each performed in duplicate (** p < 0.005). (DG) A673-1c ES cells were treated with doxycycline (1 μg/mL) for 24 h. Ptch1 (D), Ptch2 (E), Stmn1 (F) and NKx2.2 (G) mRNA steady-state levels were quantified by RT-qPCR analysis. Bars indicate means ± SD of three independent experiments, each performed in triplicate (* p < 0.05; ** p < 0.005).
Figure 4
Figure 4
GANT61 inhibits the transcriptional activity of Gli1 and primary tumor growth in an orthotopic model of ES. (A) ES cells (TC71, A673 or SKES1, as indicated) were transfected with the Gli-specific construct Gli-lux. Then, 24 h after transfection, cells were treated or not with 5 µM GANT61 for 24 h. Bars indicate means ± SD of three independent experiments, each performed in duplicate (* p < 0.05; ** p < 0.005). (B) Stmn1 and NKx2.2 mRNA steady-state levels were quantified by RT-qPCR analysis in ES cells in the presence or absence of GANT61, as indicated (5 or 15 µM, for 24 h). Bars indicate means ± SD of three independent experiments, each performed in triplicate (* p < 0.05). (C) intramuscular paratibial injections of 1.106 TC71 cells were performed in two groups of 10 nude mice treated with vehicle (blue) or GANT61 (red, 50 mg/kg), as indicated. Tumor volumes were measured two times per week for three weeks. Left panel: Individual tumor volume. Right panel: Mean ± SEM; *** p < 0.001.
Figure 5
Figure 5
GANT61 induces in vitro cell death in ES cell lines. (A) three ES cell lines (TC71, A673 and SKES1) were treated or not for 48 h with GANT61, as indicated. Cell viability was evaluated as described in the material and methods section. For each cell line, the graph indicates the relative cell viability compared to untreated cells. The mean ± SD of at least five independent experiments, each performed in sextuplicate, is presented (** p < 0.005). (B) upper panels: Representative dot plots of SKES1 cells treated or not with 5 or 15 µM GANT61 for 24 h are shown (representative graphs of three experiments). Lower panels: ES cells were treated or not with 5 or 15 µM GANT61 for 24 h. Bars indicate the means ± SD of the relative number of cells in early- or late-phase apoptosis (3 independent experiments). (C) ES cells were treated with 15 µM GANT61 for 24 h. Relative caspase-3/7 activity was evaluated as described in the material and methods section. Bars indicate the caspase-3/7 activity (mean ± SD) of at least two independent experiments, each performed in triplicate (* p < 0.05). (D) ES cells were treated or not with 5 or 15 µM GANT61, as indicated, for 24 h. After incubation, PARP cleavage levels were detected by Western blot analysis. Representative blots of three experiments are shown.

References

    1. Heare T., Hensley M.A., Dell’Orfano S. Bone tumors: Osteosarcoma and Ewing’s sarcoma. Curr. Opin. Pediatrics. 2009;21:365–372. doi: 10.1097/MOP.0b013e32832b1111. - DOI - PubMed
    1. Moore D.D., Luu H.H. Osteosarcoma. Cancer Treat. Res. 2014;162:65–92. doi: 10.1007/978-3-319-07323-1_4. - DOI - PubMed
    1. Eccles S.A., Welch D.R. Metastasis: Recent discoveries and novel treatment strategies. Lancet. 2007;369:1742–1757. doi: 10.1016/S0140-6736(07)60781-8. - DOI - PMC - PubMed
    1. Grier H.E., Krailo M.D., Tarbell N.J., Link M.P., Fryer C.J.H., Pritchard D.J., Gebhardt M.C., Dickman P.S., Perlman E.J., Meyers P.A., et al. Addition of ifosfamide and etoposide to standard chemotherapy for Ewing’s sarcoma and primitive neuroectodermal tumor of bone. N. Engl. J. Med. 2003;348:694–701. doi: 10.1056/NEJMoa020890. - DOI - PubMed
    1. Meyers P.A., Schwartz C.L., Krailo M.D., Healey J.H., Bernstein M.L., Betcher D., Ferguson W.S., Gebhardt M.C., Goorin A.M., Harris M., et al. Osteosarcoma: The addition of muramyl tripeptide to chemotherapy improves overall survival—a report from the Children’s Oncology Group. J. Clin. Oncol. Off. J. Am. Soc. Clin. Oncol. 2008;26:633–638. doi: 10.1200/JCO.2008.14.0095. - DOI - PubMed