. 2020 Nov 23;21(1):824.
doi: 10.1186/s12864-020-07235-0.

Transcriptomic profiling of adipose tissue inflammation, remodeling, and lipid metabolism in periparturient dairy cows (Bos taurus)

Affiliations

Transcriptomic profiling of adipose tissue inflammation, remodeling, and lipid metabolism in periparturient dairy cows (Bos taurus)

David Salcedo-Tacuma et al. BMC Genomics. .

Abstract

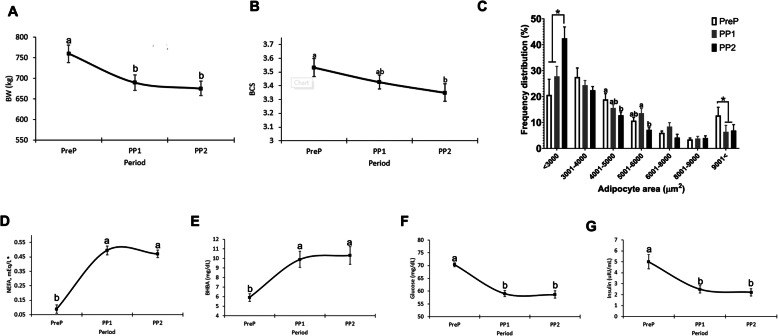
Background: Periparturient cows release fatty acid reserves from adipose tissue (AT) through lipolysis in response to the negative energy balance induced by physiological changes related to parturition and the onset of lactation. However, lipolysis causes inflammation and structural remodeling in AT that in excess predisposes cows to disease. The objective of this study was to determine the effects of the periparturient period on the transcriptomic profile of AT using NGS RNAseq.

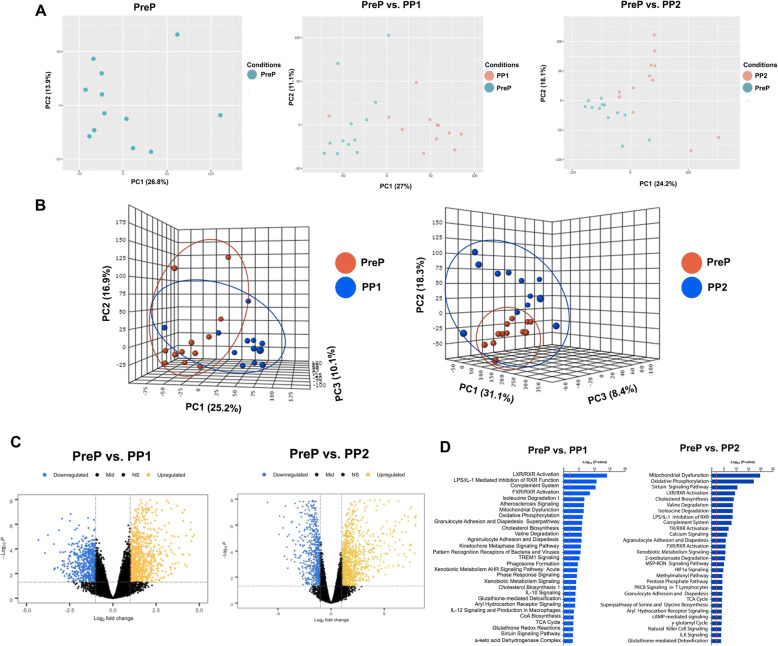
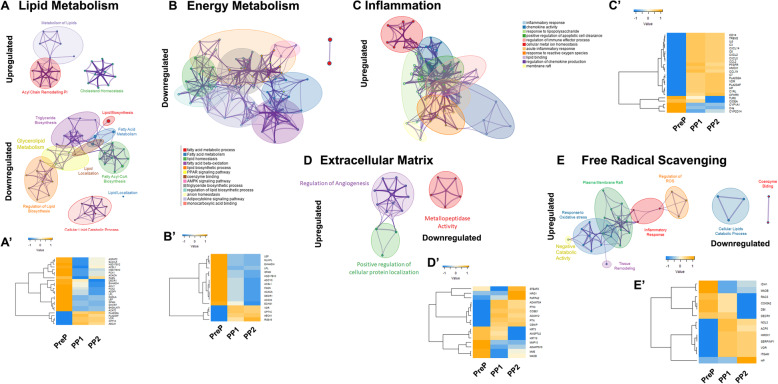
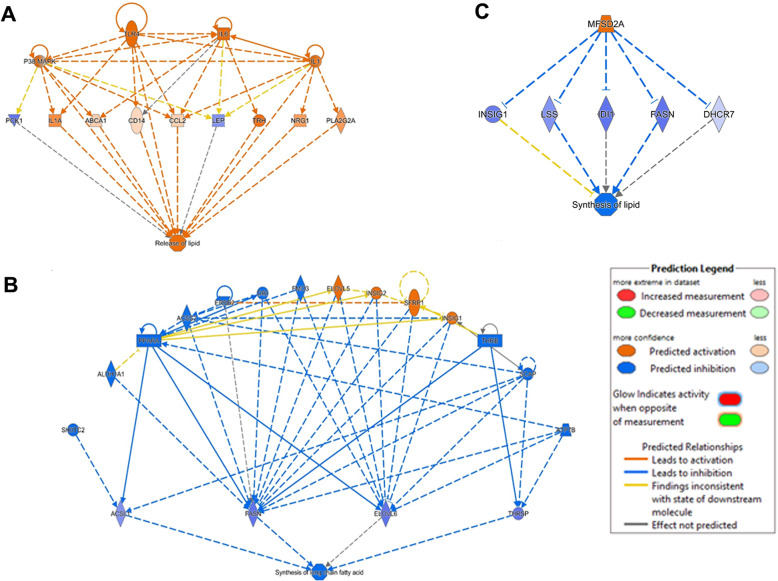
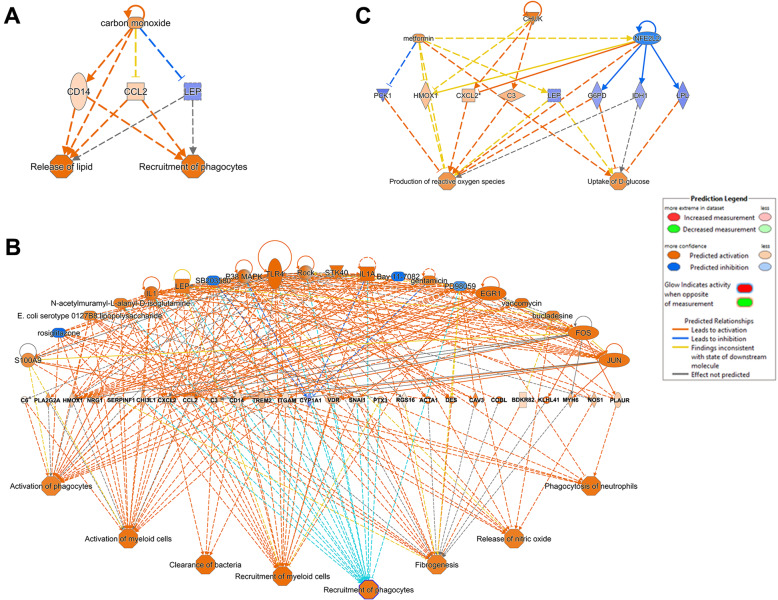
Results: Subcutaneous AT samples were collected from Holstein cows (n = 12) at 11 ± 3.6 d before calving date (PreP) and at 6 ± 1d (PP1) and 13 ± 1.4d (PP2) after parturition. Differential expression analyses showed 1946 and 1524 DEG at PP1 and PP2, respectively, compared to PreP. Functional Enrichment Analysis revealed functions grouped in categories such as lipid metabolism, molecular transport, energy production, inflammation, and free radical scavenging to be affected by parturition and the onset of lactation (FDR < 0.05). Inflammation related genes such as TLR4 and IL6 were categorized as upstream lipolysis triggers. In contrast, FASN, ELOVL6, ACLS1, and THRSP were identified as upstream inhibitors of lipid synthesis. Complement (C3), CXCL2, and HMOX1 were defined as links between inflammatory pathways and those involved in the generation of reactive oxygen species.

Conclusions: Results offer a comprehensive characterization of gene expression dynamics in periparturient AT, identify upstream regulators of AT function, and demonstrate complex interactions between lipid mobilization, inflammation, extracellular matrix remodeling, and redox signaling in the adipose organ.

Keywords: Adipose tissue inflammation; Lipogenesis; Lipolysis; Periparturient period.


Conflict of interest statement

The authors declare that they have no competing interests.

Figures

Fig. 1
Fig. 1
Lipolysis increases postpartum and reduces adipose mass and adipocyte size. Blood and adipose tissue samples were collected from Holstein cows (n = 12) at 11 ± 3.6 d before calving date (PreP) and at 6 ± 1d (PP1) and 13 ± 1.4d (PP2) after parturition. a Body weight; b Body condition score (BCS); c Frequency of adipocyte sizes in subcutaneous adipose tissues; d Circulating free fatty acids (NEFA); e circulating beta-hydroxybutyrate (BHB); f Blood glucose and g Insulin. Data are means ± SEM or * median ± SEM. Significant differences are indicated by * and letters a, b, c (P < 0.05)
Fig. 2
Fig. 2
The transcriptomic profile of subcutaneous adipose tissue is altered after parturition and the onset of lactation. Adipose tissue samples were collected from Holstein cows (n = 12) at 11 ± 3.6 d before calving date (PreP) and at 6 ± 1d (PP1) and 13 ± 1.4d (PP2) after parturition. a 2D and b 3D Principal components analysis (PCA) of adipose tissue transcriptomics data at PreP, PreP vs. PP1, and PreP vs. PP2. c Volcano plots of differentially expressed genes at PP1 and PP2 when compared to PreP samples. d Enrichment of differentially expressed genes (DEG) analyzed based on canonical pathways categories using Ingenuity Pathway Analysis (IPA). The x-axis indicates the –log10(p-value) and red line indicates a threshold of p = 0.05 [−log10(0.05) =1.3]
Fig. 3
Fig. 3
Essential gene networks clusters in adipose tissue of dairy cows are altered after parturition and the onset of lactation. Enrichment network visualization through Metascape showing the functional cluster similarities of enriched terms for differentially up and downregulated genes. Each network matches a heatmap of the differential expressed genes included in the networks. (A, A’) Lipid Metabolism; (B, B′) Energy metabolism; (C, C′) Inflammation; (D, D’) Extracellular matrix; (E, E’) Free Radical Scavenging. (FDR < 0.01). Cluster annotations are color-coded
Fig. 4
Fig. 4
Impact of transcriptional profile changes after parturition and the onset of lactation on upstream regulators and biological functions as predicted by IPA analysis. Network analyses combined differentially expressed genes with upstream regulators and physiological functions to identify factors related to the activation or inactivation of lipid mobilization biological processes (p ≤ 0.05). After parturition, hubs in the networks colored orange are predicted to have activation, and those in blue are predicted to be inhibited. Color lines connecting hubs indicate IPA prediction of hubs whose activity lead to upregulation (orange line) or downregulation (blue line). Networks analyzed: (a) Release of lipids; (b) Inhibition of long-chain fatty acids synthesis; (c) Inhibition of lipid synthesis of lipids
Fig. 5
Fig. 5
Impact of transcriptional profile changes after parturition and the onset of lactation on upstream regulators and biological functions as predicted by IPA analysis. Network analysis combined differentially expressed genes with upstream regulators and biological functions to identify factors related to the activation or inactivation of lipid mobilization biological processes (p ≤ 0.05). After parturition, hubs in the network colored orange are predicted to have activation, and those in blue are predicted to be inhibited. Color lines connecting hubs indicate IPA prediction of hubs whose activity lead to upregulation (orange line) or downregulation (blue line). Networks analyzed: (a) Activation of phagocytes recruitment and lipid release; (b) Activation of immune response; (c) Production of ROS and glucose uptake

Similar articles

Cited by

References

    1. Bauman DE, Currie WB. Partitioning of nutrients during pregnancy and lactation: a review of mechanisms involving homeostasis and homeorhesis. J Dairy Sci. 1980;63(9):1514–1529. doi: 10.3168/jds.S0022-0302(80)83111-0. - DOI - PubMed
    1. Baumgard LH, Collier RJ, Bauman DE. A 100-year review: regulation of nutrient partitioning to support lactation. J Dairy Sci. 2017;100(12):10353–10366. doi: 10.3168/jds.2017-13242. - DOI - PubMed
    1. Bell AW, Burhans WS, Overton TR. Protein nutrition in late pregnancy, maternal protein reserves and lactation performance in dairy cows. Proc Nutr Soc. 2000;59(1):119–126. doi: 10.1017/S0029665100000148. - DOI - PubMed
    1. Contreras GA, Strieder-Barboza C, Raphael W. Adipose tissue lipolysis and remodeling during the transition period of dairy cows. J Anim Sci Biotechnol. 2017;8:41. doi: 10.1186/s40104-017-0174-4. - DOI - PMC - PubMed
    1. Ospina PA, McArt JA, Overton TR, Stokol T, Nydam DV. Using nonesterified fatty acids and β-hydroxybutyrate concentrations during the transition period for herd-level monitoring of increased risk of disease and decreased reproductive and milking performance. Vet Clin North Am Food Anim Pract. 2013;29(2):387–412. doi: 10.1016/j.cvfa.2013.04.003. - DOI - PubMed