Comparative Study
. 2020 Nov 23;13(1):178.
doi: 10.1186/s12920-020-00826-6.

A random forest based biomarker discovery and power analysis framework for diagnostics research

Affiliations
Comparative Study

A random forest based biomarker discovery and power analysis framework for diagnostics research

Animesh Acharjee et al. BMC Med Genomics. .

Abstract

Background: Biomarker identification is one of the major and important goal of functional genomics and translational medicine studies. Large scale -omics data are increasingly being accumulated and can provide vital means for the identification of biomarkers for the early diagnosis of complex disease and/or for advanced patient/diseases stratification. These tasks are clearly interlinked, and it is essential that an unbiased and stable methodology is applied in order to address them. Although, recently, many, primarily machine learning based, biomarker identification approaches have been developed, the exploration of potential associations between biomarker identification and the design of future experiments remains a challenge.

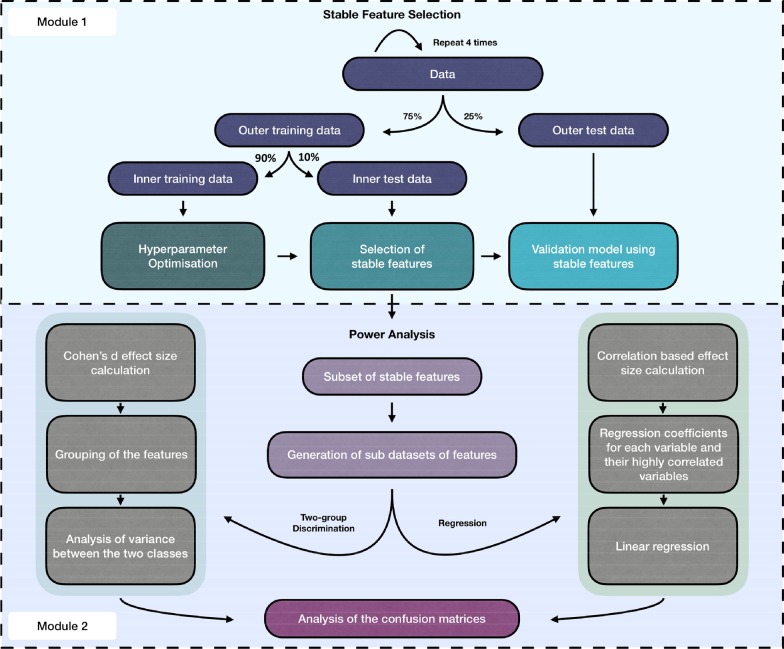
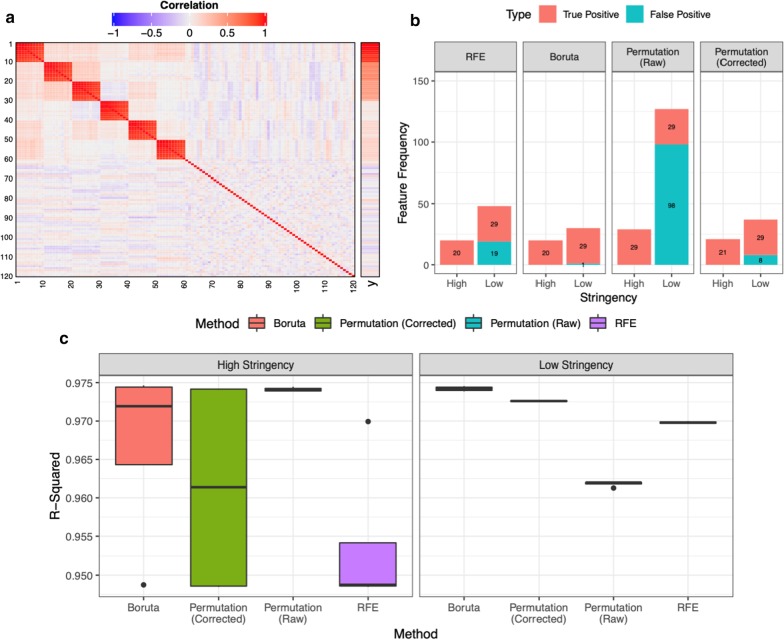
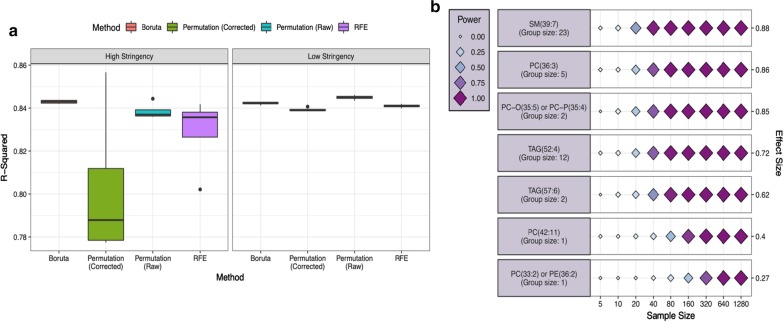
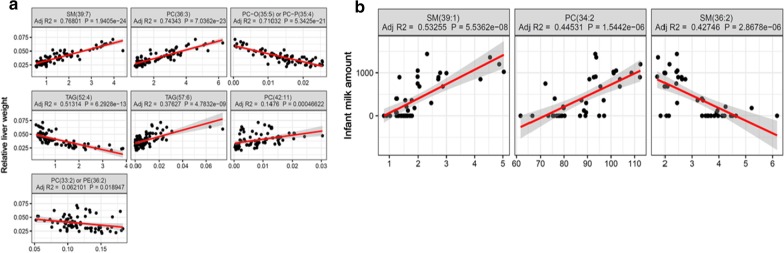
Methods: In this study, using both simulated and published experimentally derived datasets, we assessed the performance of several state-of-the-art Random Forest (RF) based decision approaches, namely the Boruta method, the permutation based feature selection without correction method, the permutation based feature selection with correction method, and the backward elimination based feature selection method. Moreover, we conducted a power analysis to estimate the number of samples required for potential future studies.

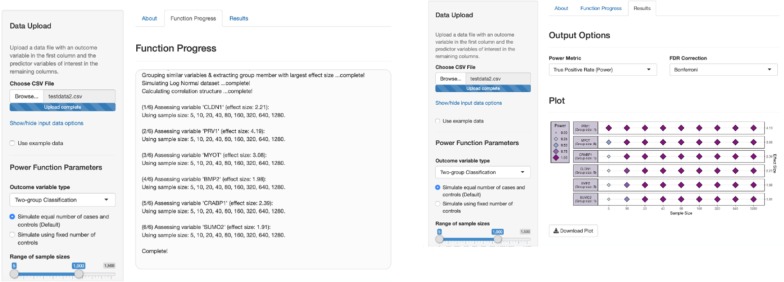
Results: We present a number of different RF based stable feature selection methods and compare their performances using simulated, as well as published, experimentally derived, datasets. Across all of the scenarios considered, we found the Boruta method to be the most stable methodology, whilst the Permutation (Raw) approach offered the largest number of relevant features, when allowed to stabilise over a number of iterations. Finally, we developed and made available a web interface ( https://joelarkman.shinyapps.io/PowerTools/ ) to streamline power calculations thereby aiding the design of potential future studies within a translational medicine context.

Conclusions: We developed a RF-based biomarker discovery framework and provide a web interface for our framework, termed PowerTools, that caters the design of appropriate and cost-effective subsequent future omics study.

Keywords: Biomarker; Feature selection; Power study; Random forest.


Conflict of interest statement

The authors declare that they have no competing interests.

Figures

Fig. 1
Fig. 1
Schematic diagram of the simulation set up and the published experimentally derived (real) data analysis
Fig. 2
Fig. 2
Results from the simulation study in RF regression mode. a The structure of the simulated predictor data from uniform distribution and the association with outcome variable (y) is described. Only V1-V120 are shown of full dataset featuring 5000 variables. b The number of features stably selected by each approach in at least 5/100 iterations (Low Stringency) or a minimum of 90/100 iterations (High Stringency) are shown. True positive: V1–V30, False positive: V3–V5000. Values describing the number of times each feature is chosen by a particular approach are averaged across those achieved after 100 iterations for each of the four inner loop test datasets. c The variance in predictive accuracy (R-Squared), across all four outer loop cross-validation repeats, is shown for RFs trained using only the high or LS stable features selected by each feature selection approach using the relevant inner loop test dataset
Fig. 3
Fig. 3
Validation model performance and power analysis of published experimentally derived data 1, regression mode. a Boxplots displaying the variance in the observed R-squared value of validation models trained using the stable features selected by each feature selection approach, across four outer-loop CV repeats. Values are shown for models trained using either the features selected by each approach in at least 5/100 iterations (Low Stringency) or a minimum of 90/100 iterations (High Stringency). b The three groups of correlated features identified by the power function are represented by the group member with the largest observed effect size. The effect size of each assessed variable is shown along the y axis and a series of sample sizes along the x axis. Power values determined for each effect/sample size combination using a simulated dataset with the same correlation structure as input data and displayed using variably sized/coloured rhombi
Fig. 4
Fig. 4
Results from public dataset identified by the module 1 of the workflow is listed above with probability values < 0.05. a Stable metabolic markers and their variance explained with relative liver weight is shown. b Lipids associated with amount of milk in the 3 m old infants are listed
Fig. 5
Fig. 5
Screenshots of the open- source web application ‘PowerTools’, for efficient and accessible simulation based power calculations

References

    1. Wang Z, Gerstein M, Snyder M. RNA-Seq: a revolutionary tool for transcriptomics. Nat Rev Genet. 2009;10:57–63. doi: 10.1038/nrg2484. - DOI - PMC - PubMed
    1. Clark TA. Genomewide analysis of mRNA processing in yeast using splicing-specific microarrays. Science. 2002;296:907–910. doi: 10.1126/science.1069415. - DOI - PubMed
    1. McGrath CM, Young SP. Can metabolomic profiling predict response to therapy? Nat Rev Rheumatol. 2019;15:129–130. doi: 10.1038/s41584-018-0136-z. - DOI - PubMed
    1. Patti GJ, Yanes O, Siuzdak G. Metabolomics: the apogee of the omics trilogy. Nat Rev Mol Cell Biol. 2012;13:263–269. doi: 10.1038/nrm3314. - DOI - PMC - PubMed
    1. Domon B. Mass spectrometry and protein analysis. Science. 2006;312:212–217. doi: 10.1126/science.1124619. - DOI - PubMed

Publication types

LinkOut - more resources