. 2021 Feb:114:104161.
doi: 10.1016/j.jmbbm.2020.104161. Epub 2020 Nov 7.

Reconstructing vascular homeostasis by growth-based prestretch and optimal fiber deposition

Affiliations

Reconstructing vascular homeostasis by growth-based prestretch and optimal fiber deposition

Jiacheng Wu et al. J Mech Behav Biomed Mater. 2021 Feb.

Abstract

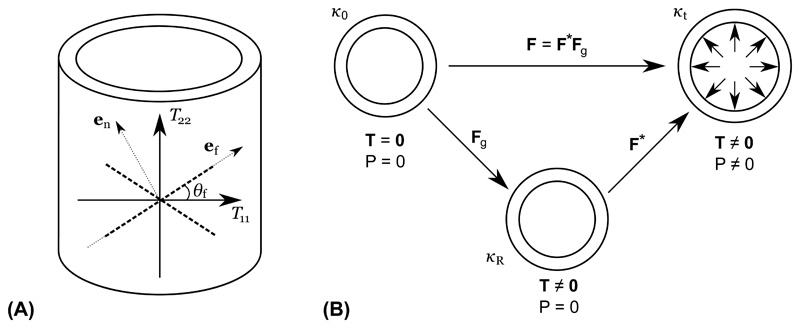
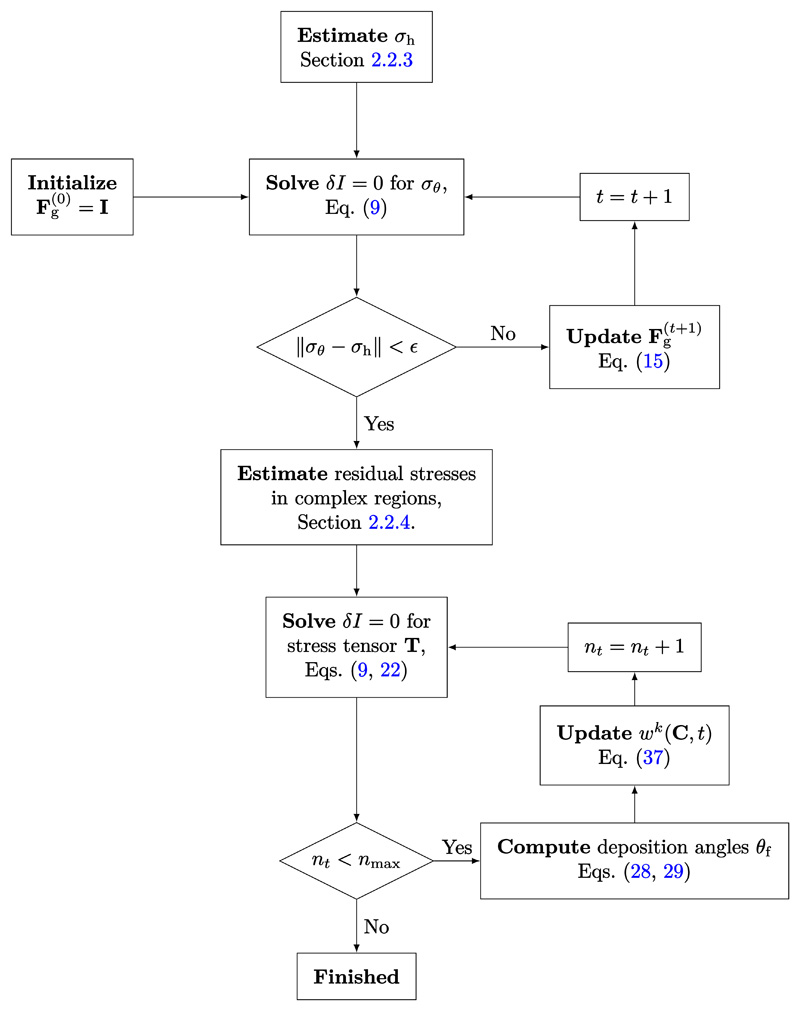
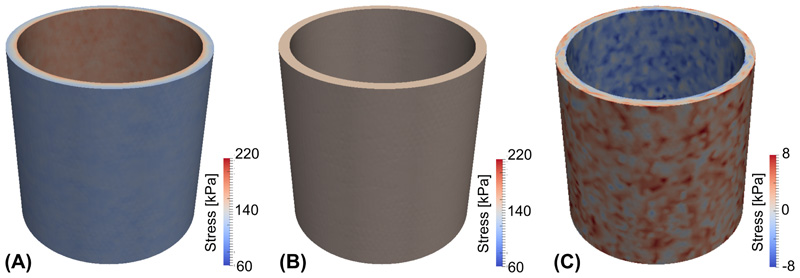
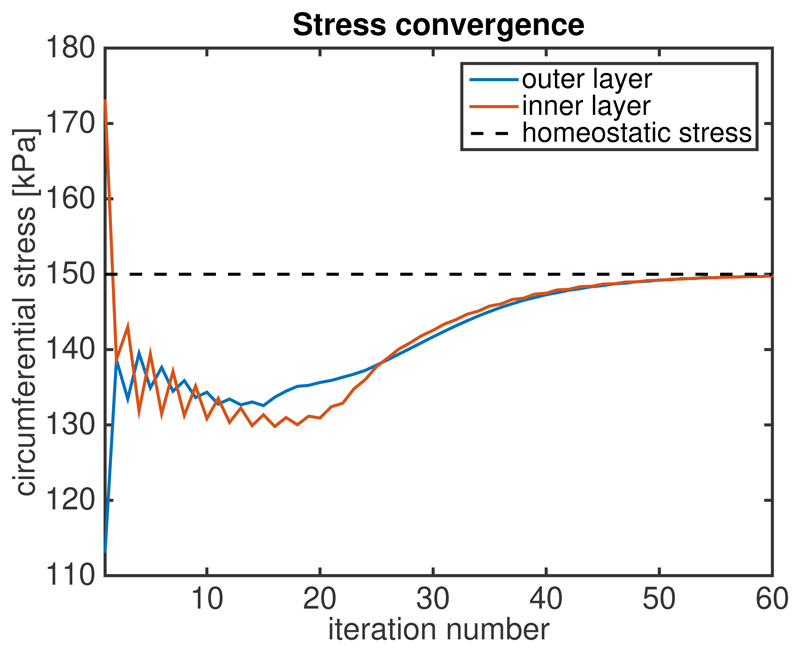
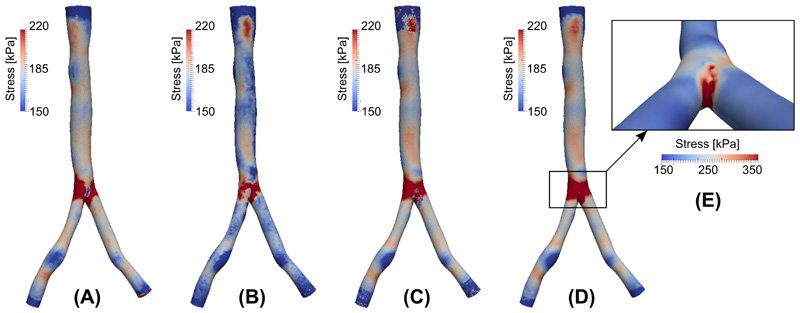
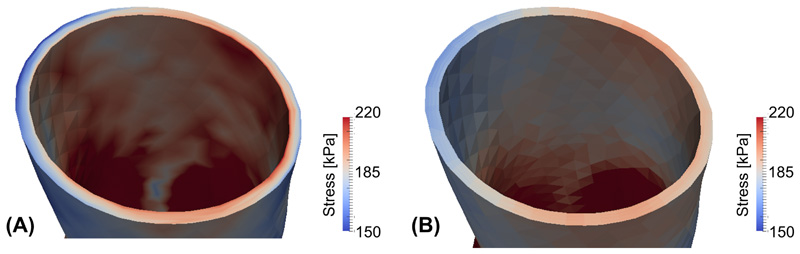
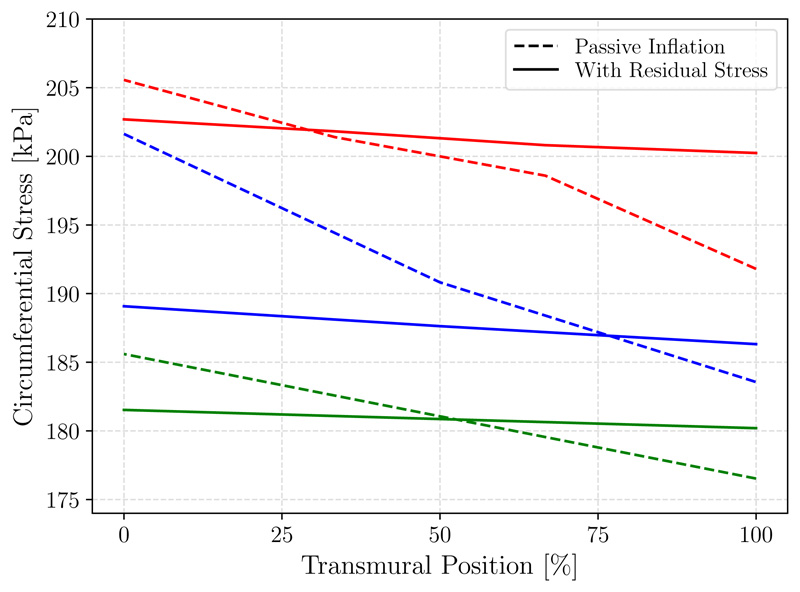
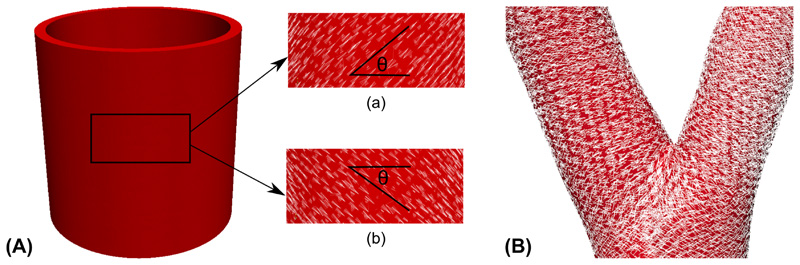
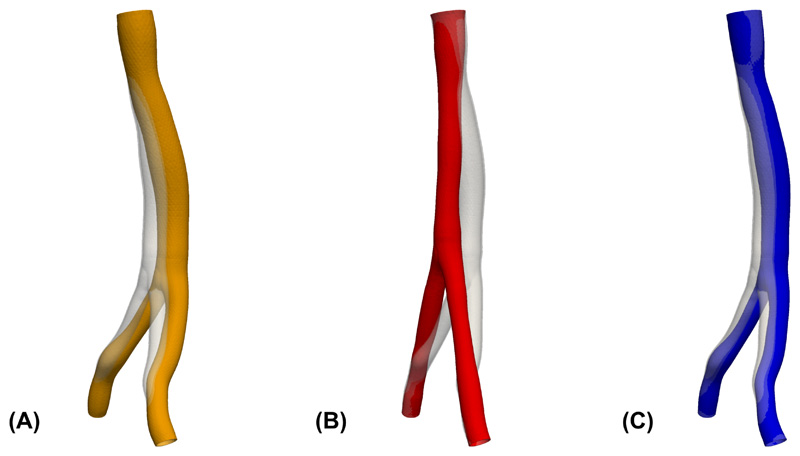
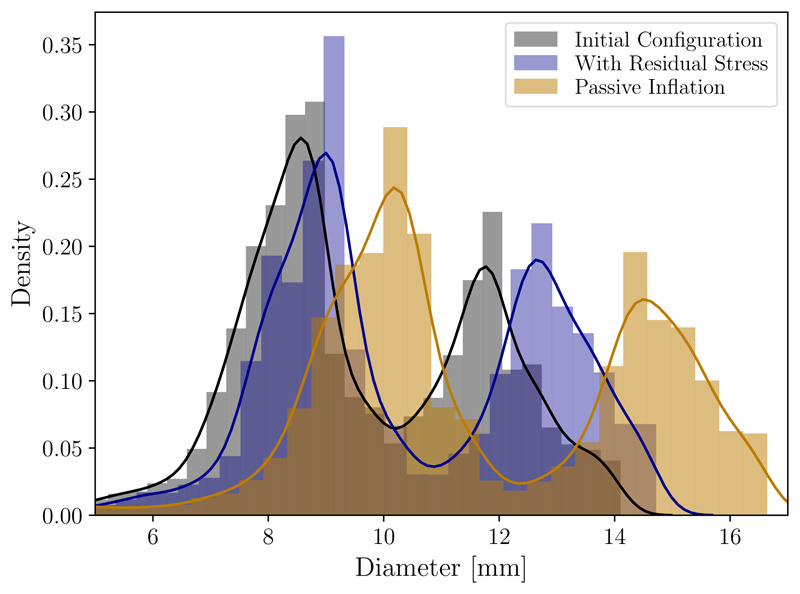
Computational modeling of cardiovascular biomechanics should generally start from a homeostatic state. This is particularly relevant for image-based modeling, where the reference configuration is the loaded in vivo state obtained from imaging. This state includes residual stress of the vascular constituents, as well as anisotropy from the spatially varying orientation of collagen and smooth muscle fibers. Estimation of the residual stress and fiber orientation fields is a formidable challenge in realistic applications. To help address this challenge, we herein develop a growth based Algorithm to recover a residual stress distribution in vascular domains such that the stress state in the loaded configuration is equal to a prescribed homeostatic stress distribution at physiologic pressure. A stress-driven fiber deposition process is included in the framework, which defines the distribution of the fiber alignments in the vascular homeostatic state based on a minimization procedure. Numerical simulations are conducted to test this two-stage homeostasis generation algorithm in both idealized and non-idealized geometries, yielding results that agree favorably with prior numerical and experimental data.

Keywords: Constrained mixture; Image-based modeling; Residual stress; Vascular tissue mechanics.


Conflict of interest statement

Conflict of Interest

The authors do not have conflicts of interest relevant to this manuscript.

Figures

Figure 1
Figure 1
(A) T 11 and T 22 are the two principal stress directions of the Cauchy stress tensor T; θ f is the deposition angle of fiber family e f; and e n the fiber normal direction. (B) Relation between different configurations. κ 0 is the unstressed reference configuration (T = 0); κ R is the configuration with residual stress incorporated; κt is the current configuration with external pressure imposed.
Figure 2
Figure 2. Detailed schematic for the algorithm to generate the vascular homeostatic state.
Figure 3
Figure 3
Circumferential stress distribution (A) of a standard passive inflation simulation; (B) with residual stress incorporated. (C) Residual stress distribution.
Figure 4
Figure 4. Convergence of circumferential stress to homeostatic value after prestretch is incorporated.
Figure 5
Figure 5
(A) Nominal homeostatic stress distribution. (B) Stress distribution from standard passive inflation. (C) Stress distribution after incorporation of residual stress. (D) Stress distribution after residual stress and machine learning repair. (E) Stress distribution near bifurcation (note change in color scale).
Figure 6
Figure 6
Circumferential stress distribution in the patient-specific geometry for (A) a standard passive inflation and (B) with residual stress incorporated.
Figure 7
Figure 7
Transmural circumferential stress distribution from the inner (0%) to outer (100%) wall in the patient-specific geometry for a standard passive inflation (dashes lines) and with residual stress incorporated (solid lines). Plotted are stresses along transmural lines at 3 arbitrary locations: one in each of the cylindrical regions, with the main branch in red.
Figure 8
Figure 8
(A) Fiber directions in both helical directions for the cylinder geometry; (B) Fiber directions for the patient-specific geometry near the vascular bifurcation.
Figure 9
Figure 9
Comparison of the original geometry taken from imaging (transparent gray) with the displacement field of (A) an inflation experiment without the application of the residual stress; (B) an inflation experiment with residual stress generated from the uniform homeostatic stress distribution; (C) an inflation with residual stress generated from the residual stress distribution that is uniform only in transmural direction.
Figure 10
Figure 10
Density plot and histogram of diameters measured in the original geometry taken from imaging (black) in comparison with the displacement field of an passive inflation experiment (yellow, see Figure 9A) and an inflation with residual stress (blue, see Figure 9C). Diameters were computed as the diameters of the maximal inscribed spheres along the centerline of the geometries.

References

    1. Alastrué V, Garía A, Pñna E, Rodríguez JF, Martínez MA, Doblaré M. Numerical framework for patient-specific computational modelling of vascular tissue. International Journal for Numerical Methods in Biomedical Engineering. 2010;26:35–51.
    1. Alastrué V, Pñna E, Martínez MÁ, Doblaré M. Assessing the use of the “opening angle method” to enforce residual stresses in patient-specific arteries. Annals of Biomedical Engineering. 2007;35:1821–1837. - PubMed
    1. Antiga L, Steinman D. The vascular modeling toolkit. 2009. URL: http://www.vmtk.org .
    1. Augustin CM, Holzapfel GA, Steinbach O. Classical and all-floating feti methods for the simulation of arterial tissues. International journal for numerical methods in engineering. 2014;99:290–312. - PMC - PubMed
    1. Baek S, Rajagopal K, Humphrey J. Competition between radial expansion and thickening in the enlargement of an intracranial saccular aneurysm. Journal of Elasticity. 2005;80:13–31.

Publication types