. 2021 Feb;9(2):156-169.
doi: 10.1158/2326-6066.CIR-20-0315. Epub 2020 Nov 23.

KIR3DL3 Is an Inhibitory Receptor for HHLA2 that Mediates an Alternative Immunoinhibitory Pathway to PD1

Affiliations

KIR3DL3 Is an Inhibitory Receptor for HHLA2 that Mediates an Alternative Immunoinhibitory Pathway to PD1

Rupal S Bhatt et al. Cancer Immunol Res. 2021 Feb.

Abstract

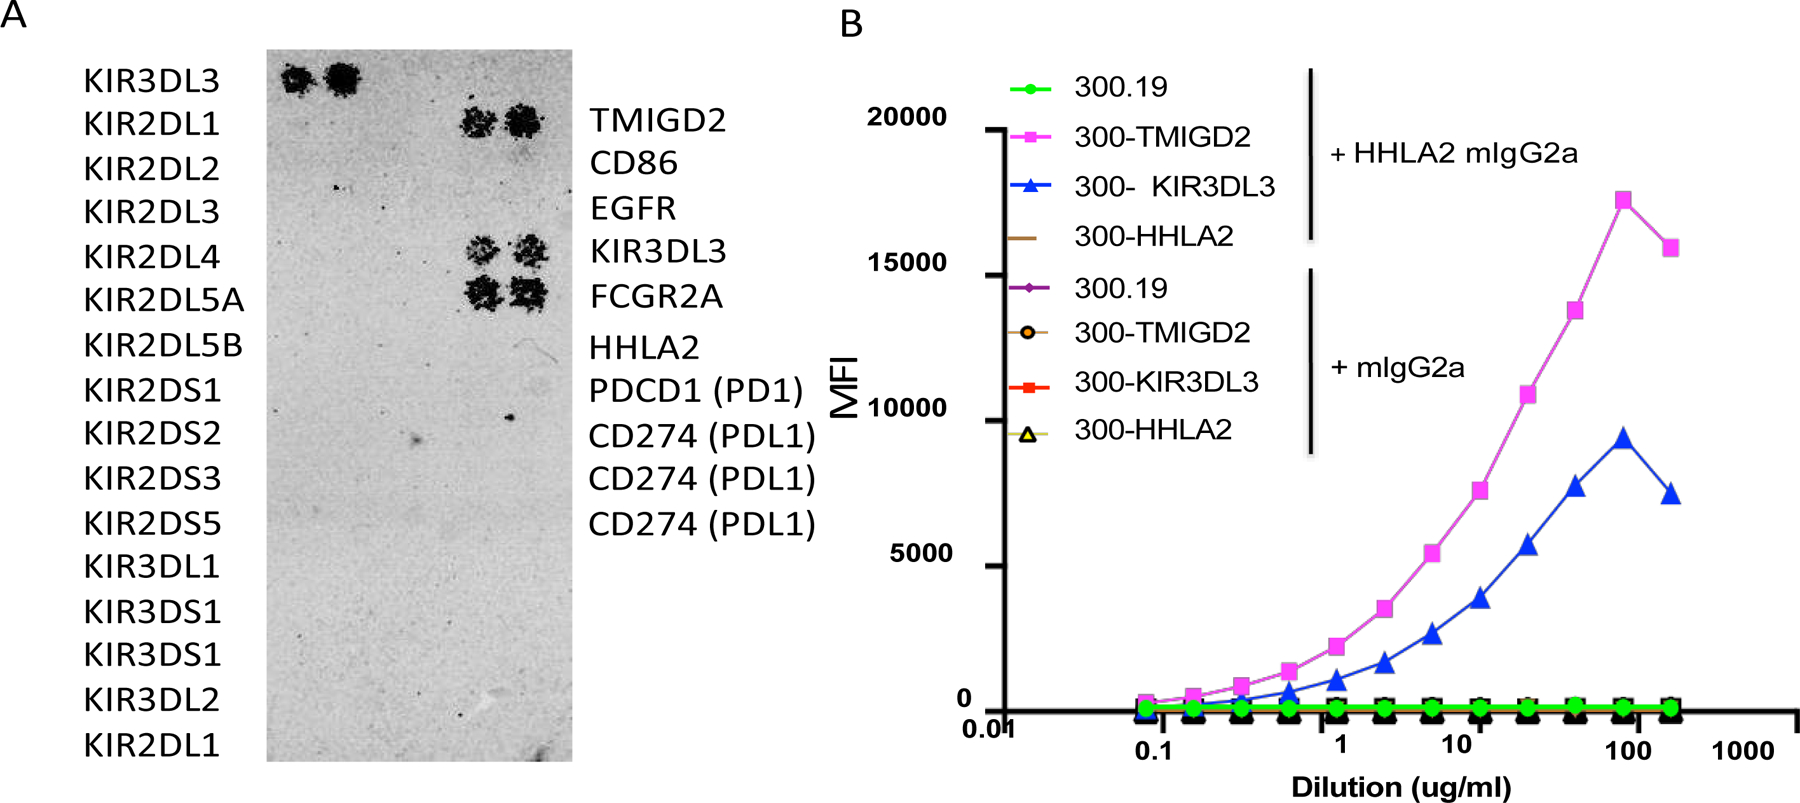
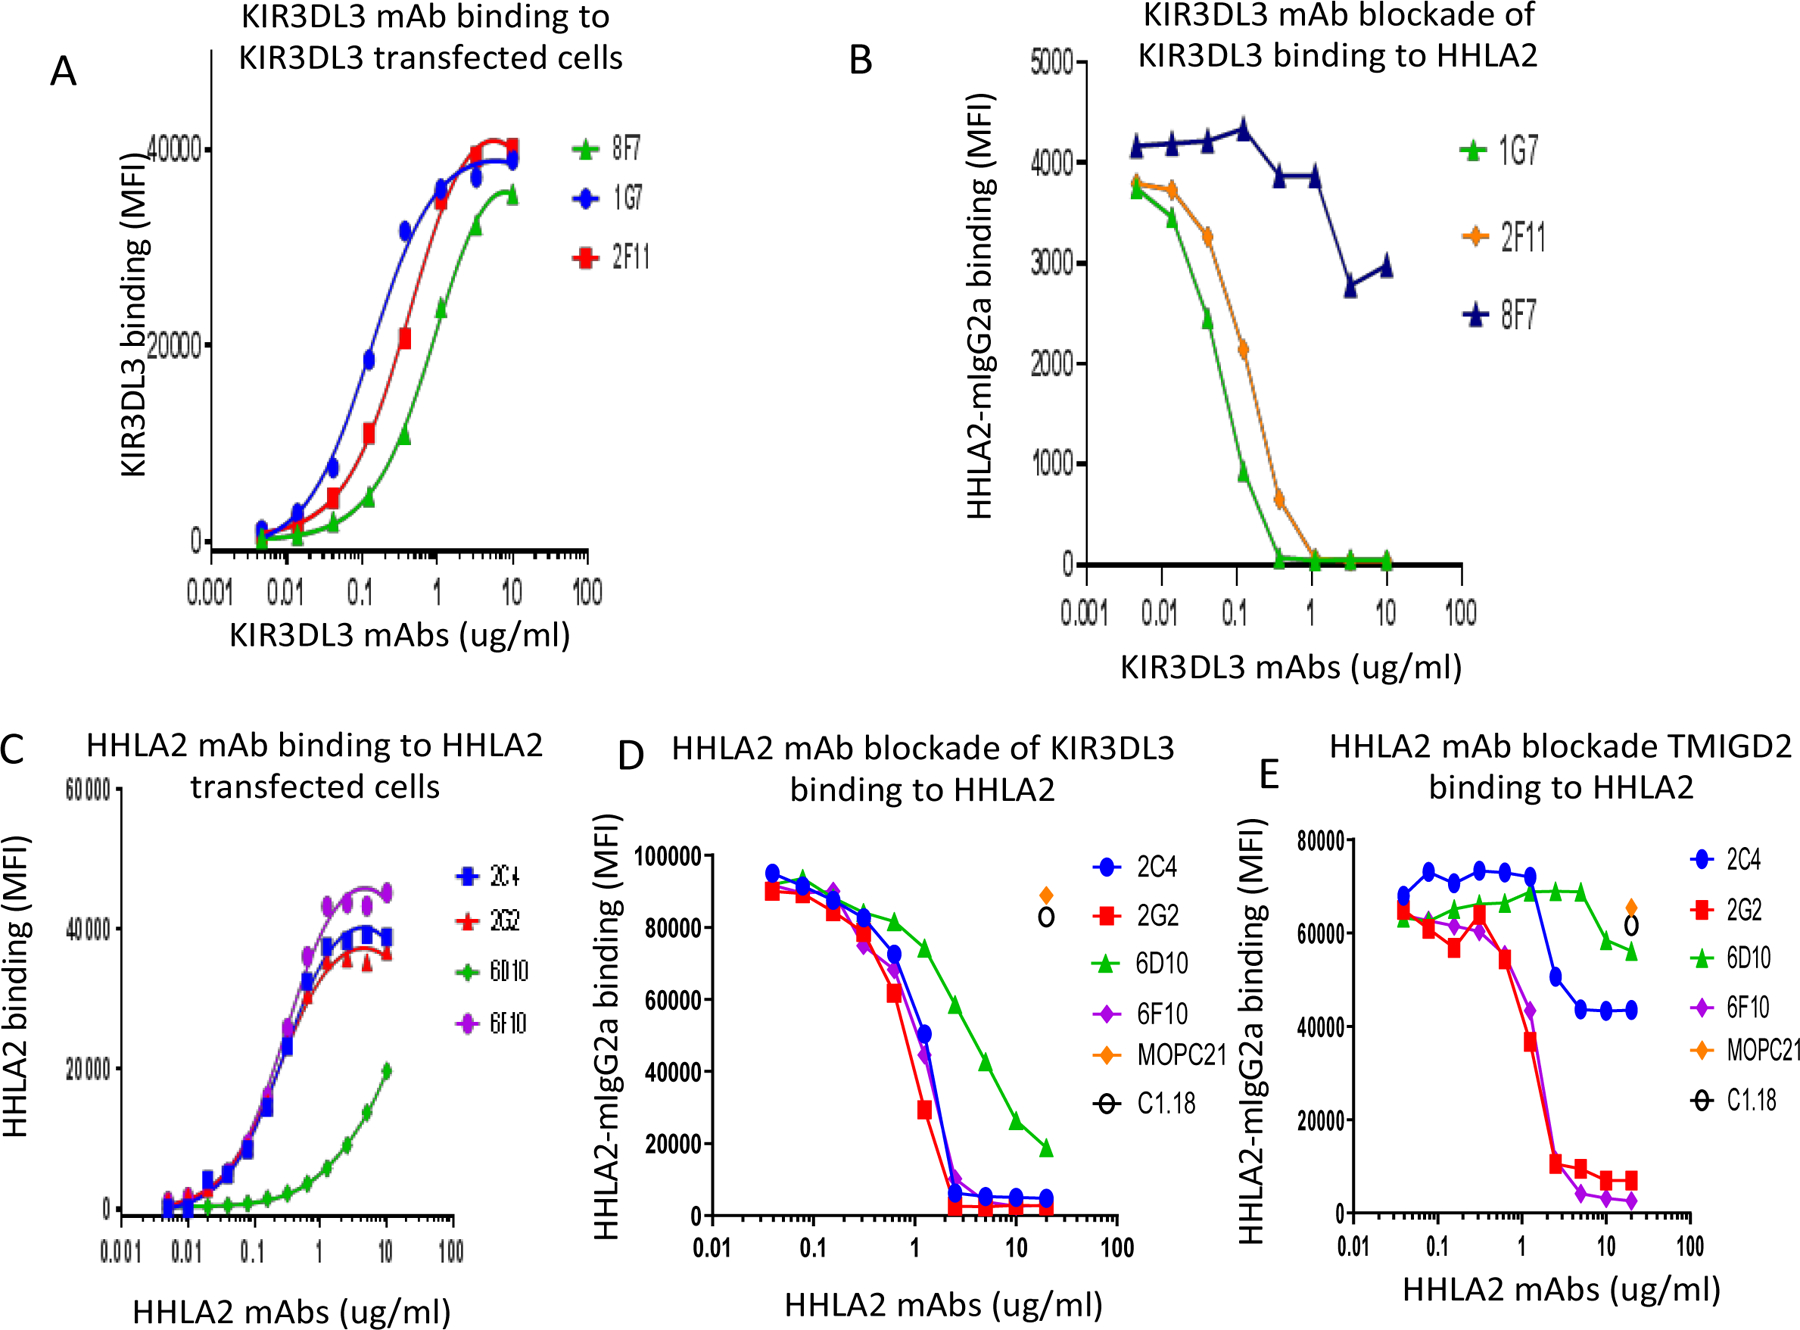
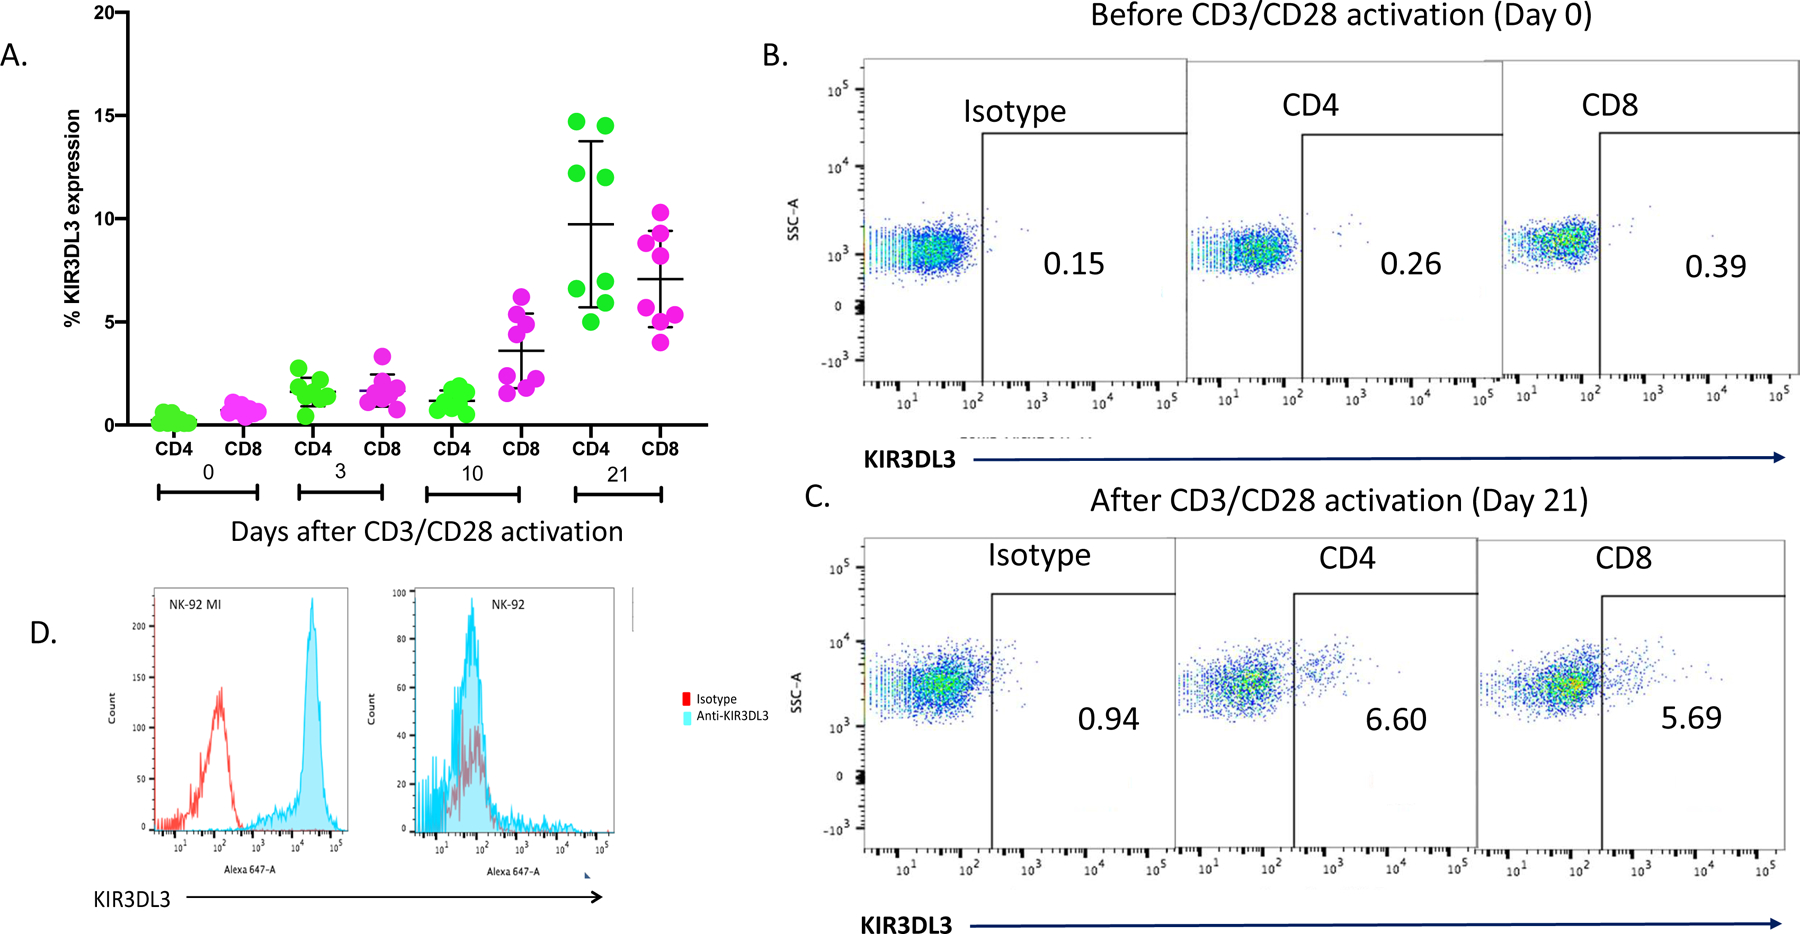
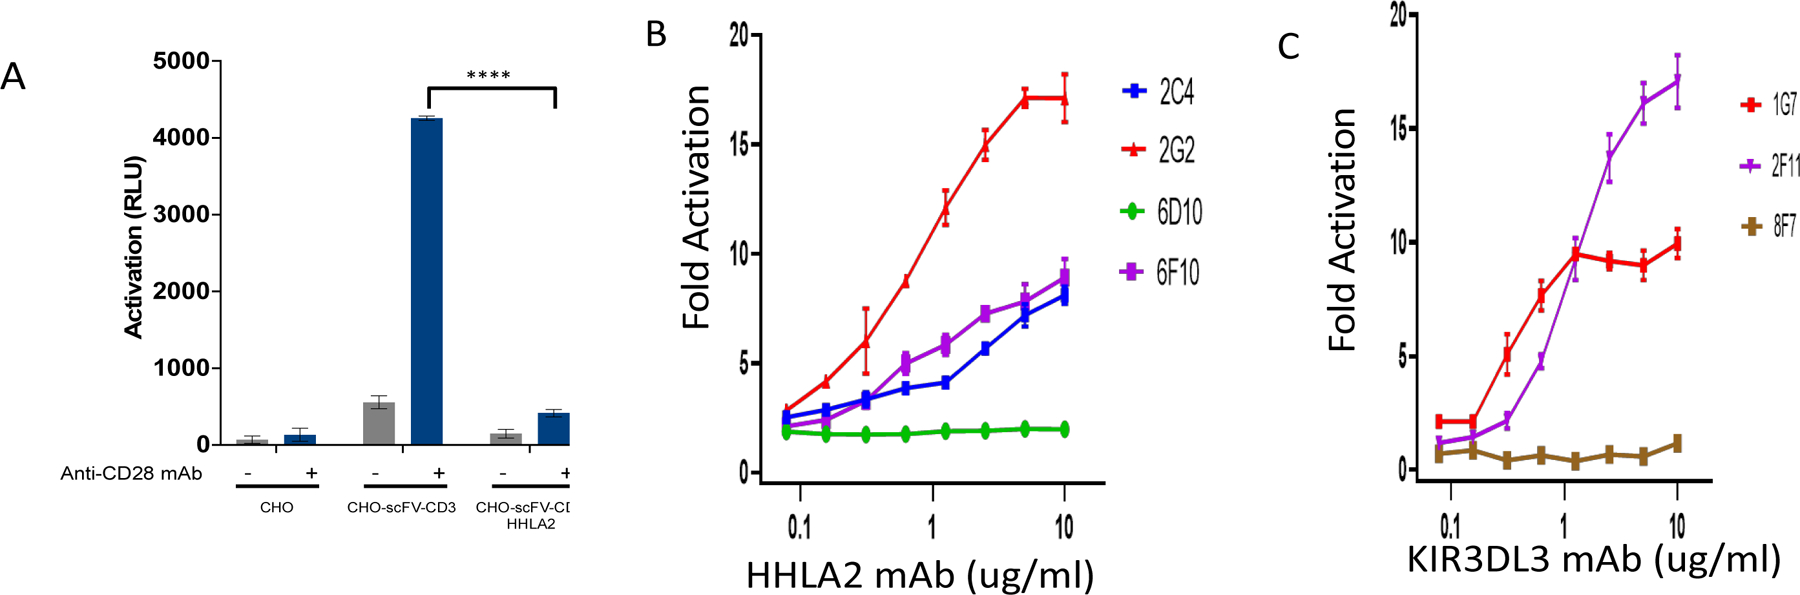
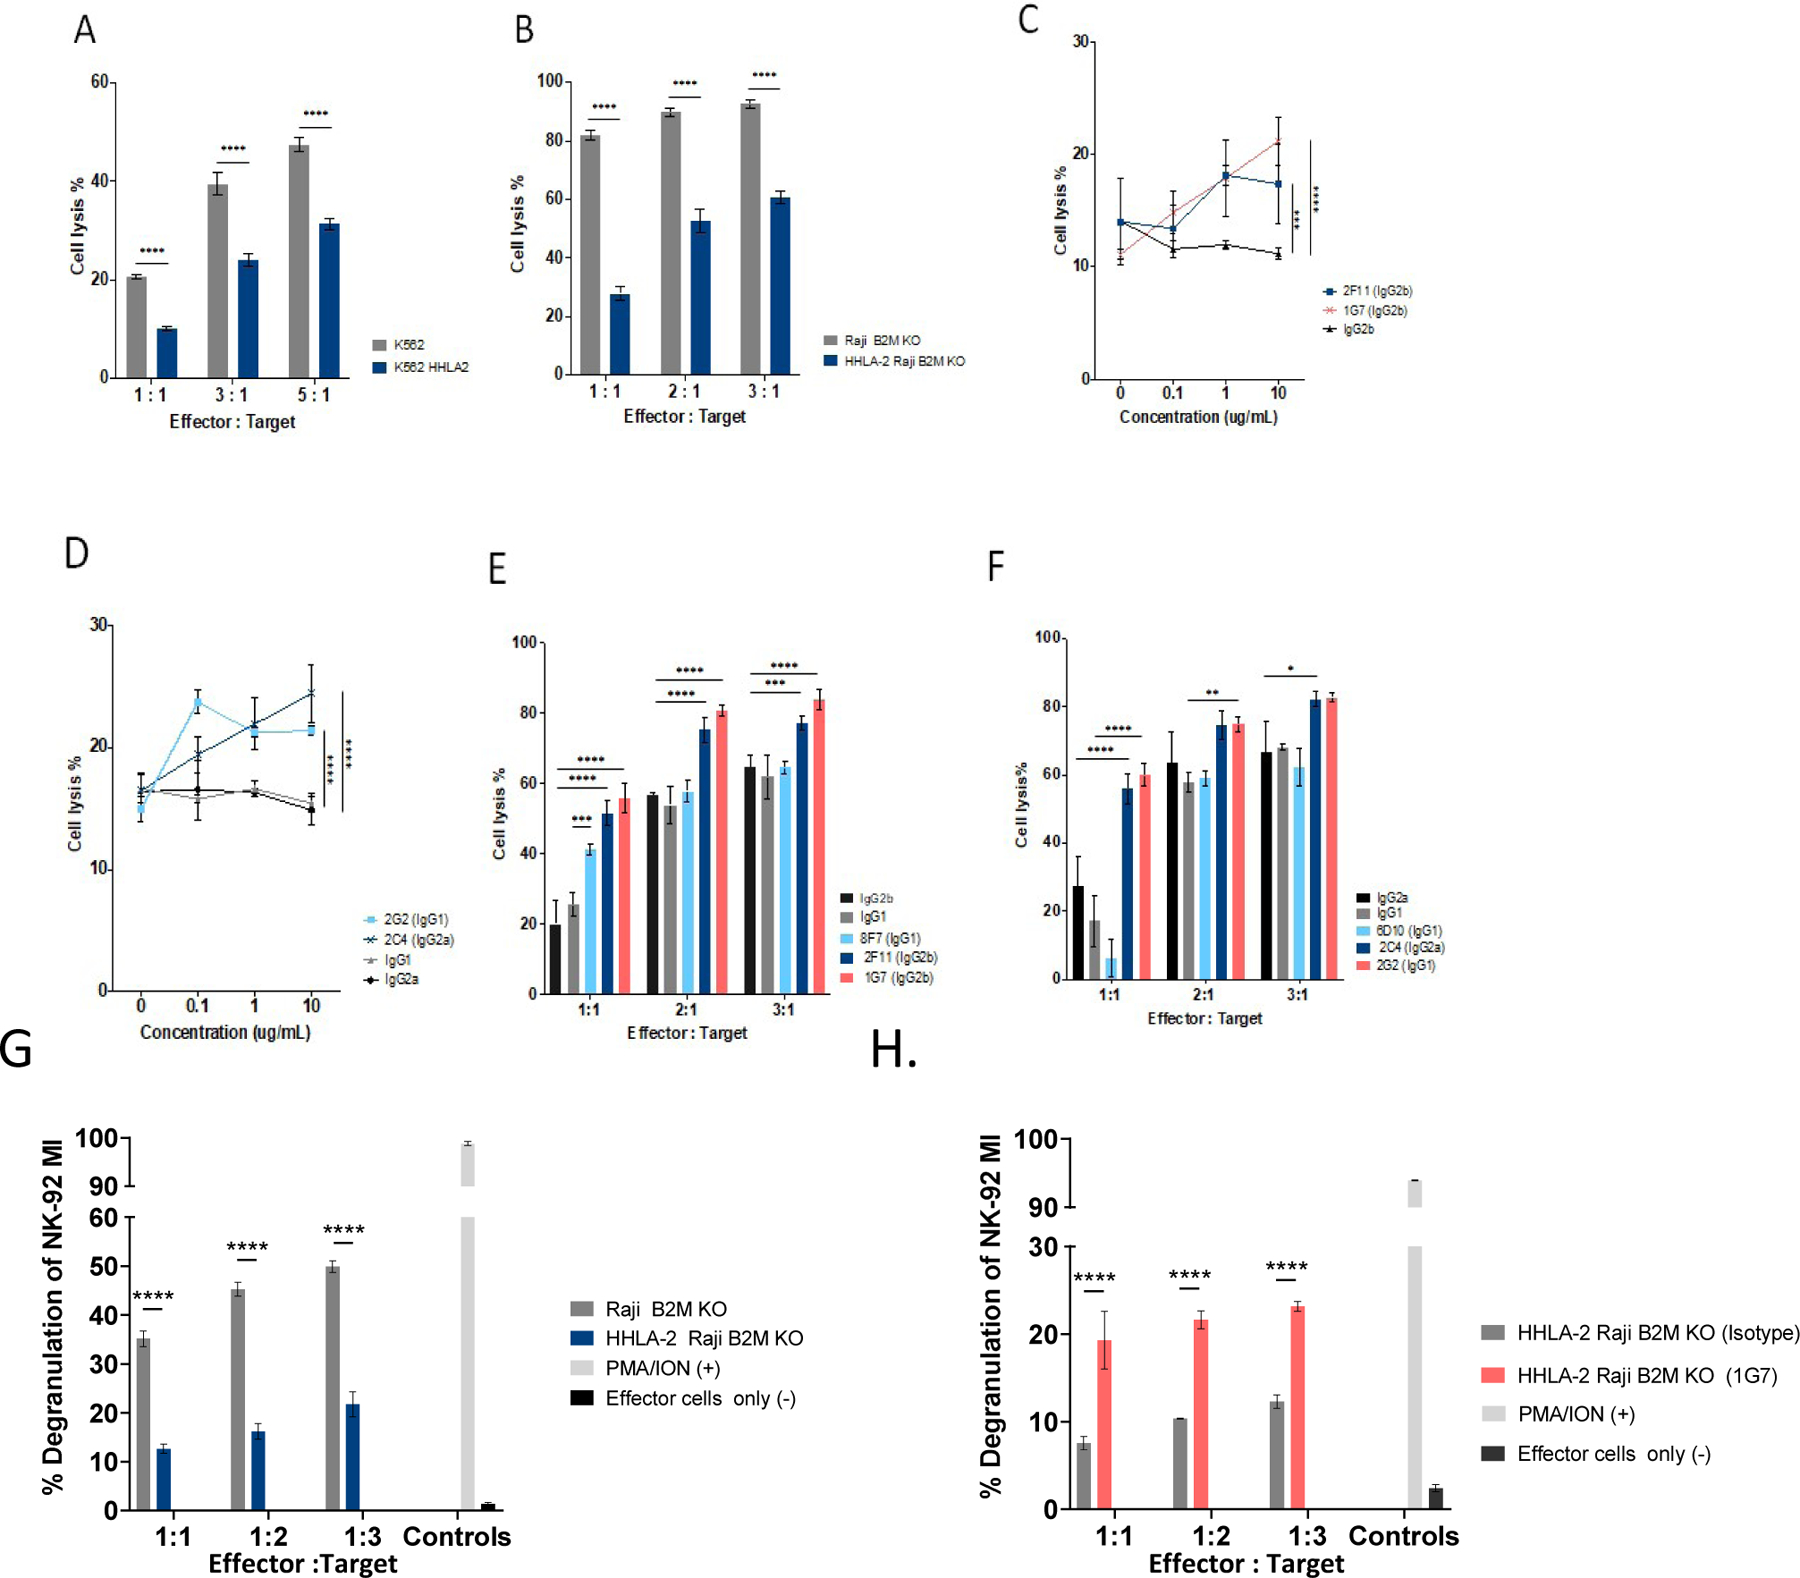
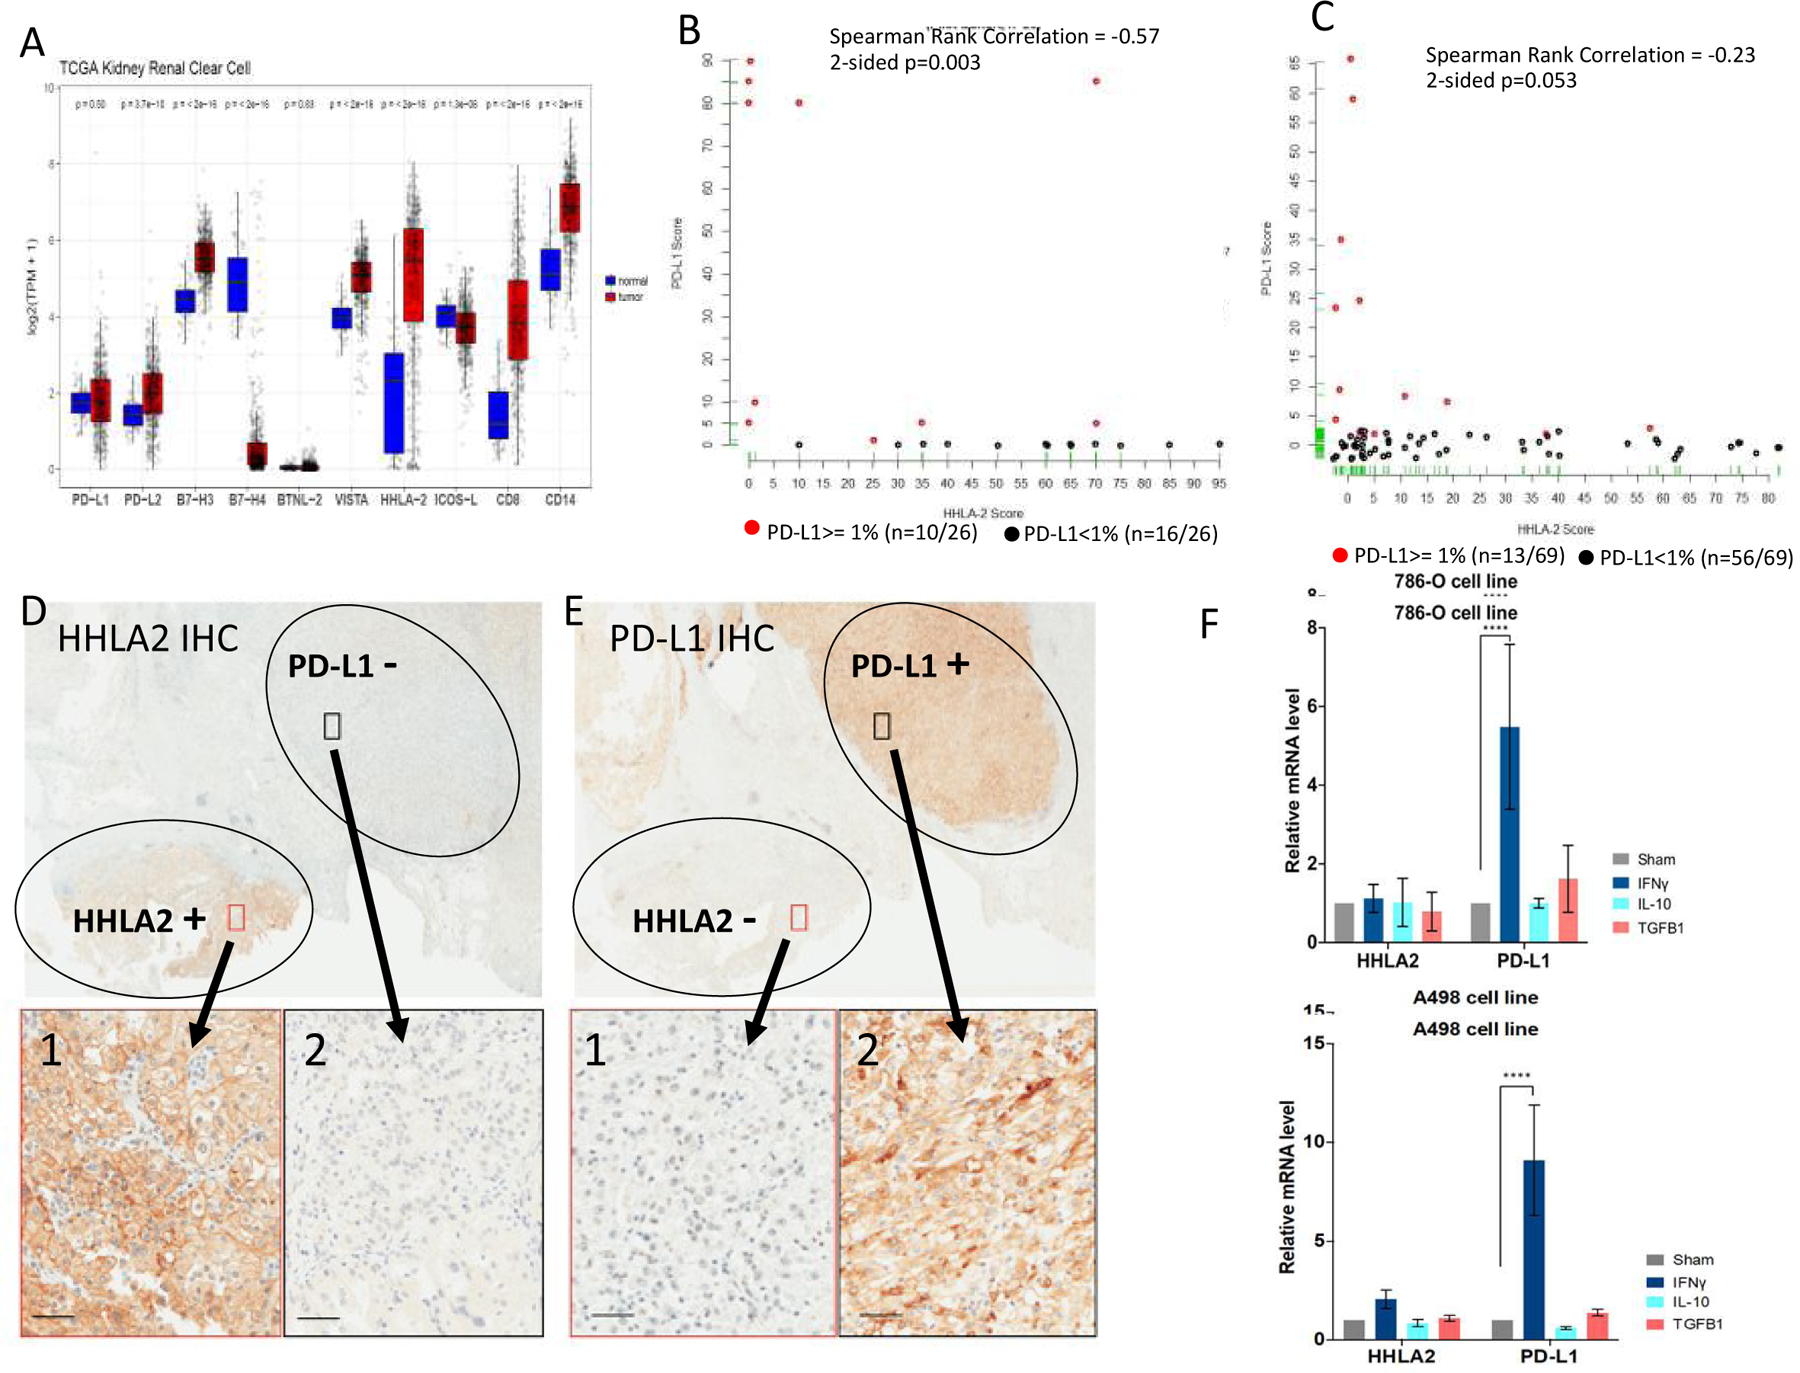
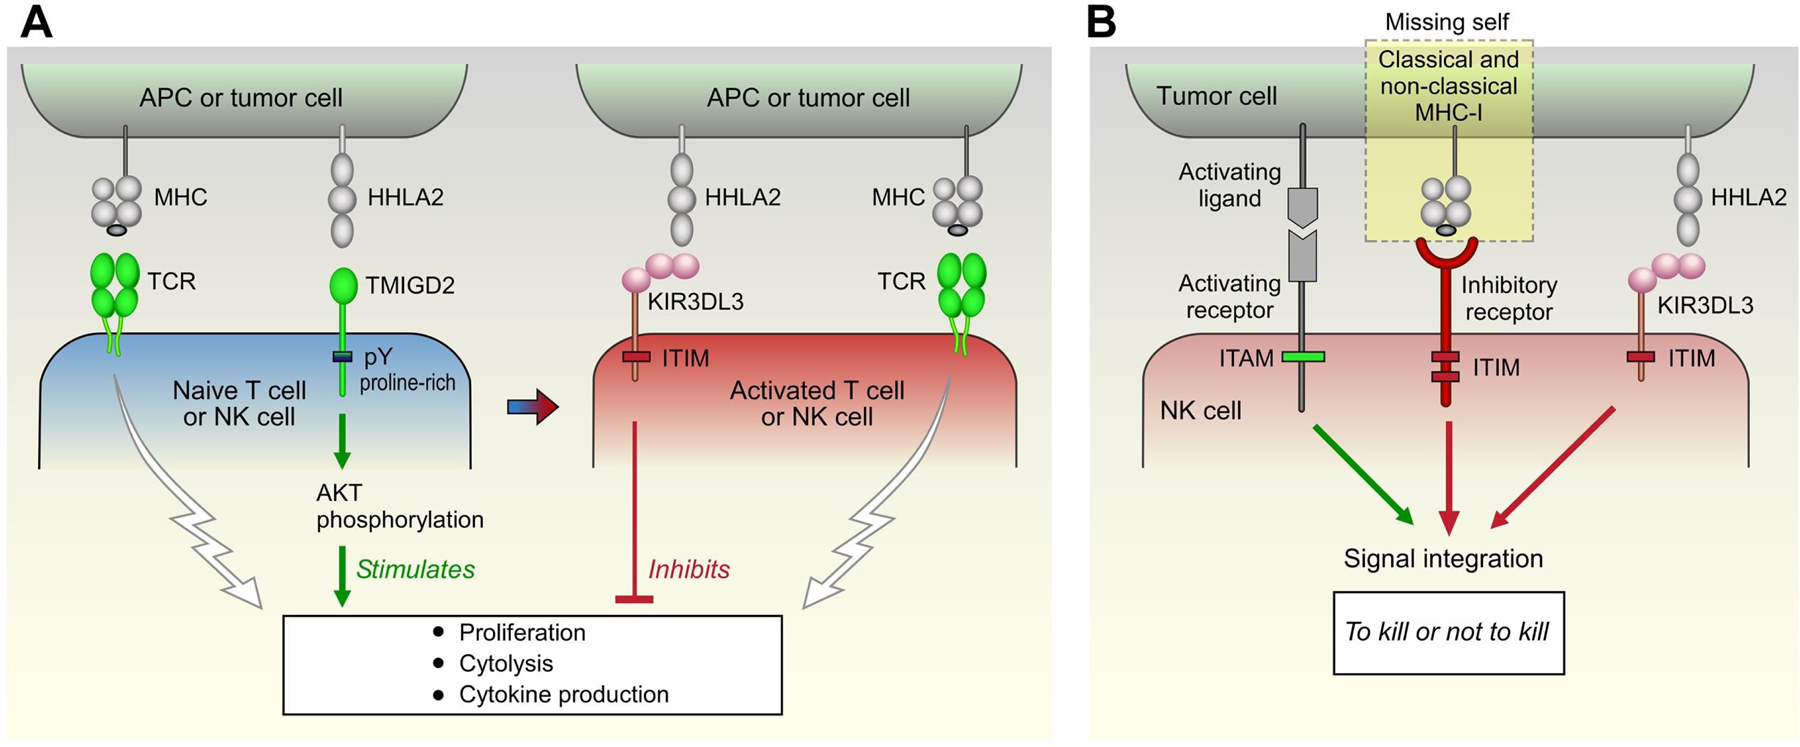
Blockade of the PD1 pathway is a broadly effective cancer therapy, but additional immune-inhibitory pathways contribute to tumor immune evasion. HERV-H LTR-associating 2 (HHLA2; also known as B7H5 and B7H7) is a member of the B7 family of immunoregulatory ligands that mediates costimulatory effects through its interaction with the CD28 family member transmembrane and immunoglobulin domain containing 2 (TMIGD2). However, HHLA2 has also been known to have inhibitory effects on T cells. Here, we report that we have identified killer cell immunoglobulin-like receptor, three immunoglobulin domains and long cytoplasmic tail 3 (KIR3DL3) as an inhibitory receptor for HHLA2 in T cells and natural killer (NK) cells and have generated HHLA2 and KIR3DL3 antibodies that block the immune-inhibitory activity of HHLA2, preserving the costimulatory signal. It is known that HHLA2 is frequently expressed in several tumor types, including clear cell renal cell carcinoma (ccRCC). We found that HHLA2 expression was nonoverlapping with PDL1 expression in ccRCC, suggesting that HHLA2 mediates a mechanism of tumor immune evasion that is independent from PDL1. Blockade of both the PD1 and KIR3DL3 pathways may be a more effective way to reverse tumor immune evasion.See related Spotlight on p. 128.


Conflict of interest statement

Conflicts of interest: GJF has patents/pending royalties on the PD1/PDL1 pathway from Roche, Merck MSD, Bristol-Myers-Squibb, Merck KGA, Boehringer-Ingelheim, AstraZeneca, Dako, Leica, Mayo Clinic, and Novartis. GJF has served on advisory boards for Roche, Bristol-Myers-Squibb, Xios, Origimed, Triursus, iTeos, NextPoint, IgM, and Jubilant. GJF has equity in Nextpoint, Triursus, Xios, and IgM. GJF and ARA have patent applications on HHLA2 and KIR3DL3 blockade for cancer immunotherapy. ARA has equity in Nextpoint. GJF and ARA are co-founders of Nextpoint Therapeutics. KMM and GJF report receiving research grants from Bristol-Myers Squibb. SS reports receiving commercial research grants from Bristol-Myers Squibb, AstraZeneca, and Exelixis; is a consultant/advisory board member for Merck, AstraZeneca, Bristol-Myers Squibb, AACR, and NCI; and receives royalties from Biogenex. DFM reports receiving research grants from BMS, Merck, Alkermes Inc, Genentech, Pfizer, Exelixis, X4 Pharma and honoraria from BMS, Pfizer, Merck, and Alkermes Inc.

Figures

Figure 1:
Figure 1:. Expression screen identifying KIR3DL3 as a receptor for HHLA2.
(A) Cell microarray analysis using soluble HHLA2–mIgG2a (HHLA2-Ig) to bind the indicated cell-surface receptors individually expressed in HEK293 cells. HHLA2-Ig bound to TMIGD2, KIR3DL3, and control (FCGR2A) but not to other members of the KIR family, PD-1, PD-L1 or HHLA2. This screen was performed in duplicate plates. (B) Flow cytometric analysis of HHLA2-Ig or control Ig binding to control 300.19 cells or 300.19 cells stably expressing KIR3DL3, TMIGD2, or HHLA2 using the indicated concentrations of HHLA2-Ig or isotype control (from 0.1 μg/mL to 160 μg/mL). (n≥3 replicates)
Figure 2:
Figure 2:. Characterization of a panel of KIR3DL3 and HHLA2 mAbs.
Flow cytometric analysis of binding of (A) KIR3DL3 mAbs to 300.19 cells expressing KIR3DL3. (B) Capacity of KIR3DL3 mAbs to block binding of HHLA2-Ig to 300.19 cells expressing KIR3DL3. (C) HHLA2 mAbs bind to 300.19 cells expressing HHLA2 with 2C4, 2G2 and 6F10 showing strongest binding and less with 6D10. (D) Capacity of HHLA2 mAbs to block binding of HHLA2-Ig to 300.19 cells expressing KIR3DL3 with 2C4, 2G2 and 6F10 showing strongest binding. (E) Capacity of HHLA2 mAbs 2G2 and 6F10 to block binding of HHLA2-Ig to 300.19 cells expressing TMIGD2. Representative binding experiments are shown: n≥3 replicates.
Figure 3:
Figure 3:. KIR3DL3 expression on activated human T cells and NK-92 MI cells.
(A) T cells were purified from whole blood of 4 normal donors and activated with CD3/CD28 antibody tetramers and flow cytometric analysis was performed in duplicate at the indicated days to assess KIR3DL3 expression in gated CD3+CD4+ and CD3+CD8+ T cells. Plots show all values measured with the center of the whiskers plot representing the median. Representative plots showing KIR3DL3 expression at (B) day 0 (unactivated) and (C) day 21 post activation. N=2 experiments with similar results. (D) KIR3DL3 expression on NK-92 MI (left panel) but minimally on NK-92 cells (right panel). N>3 replicates.
Figure 4:
Figure 4:. KIR3DL3 is an inhibitory receptor in T cells and T-cell activation is enhanced by HHLA2/KIR3DL3 blockade.
(A) Jurkat IL2-reporter T cells expressing KIR3DL3 were co-cultured with CHO cells expressing anti-CD3 scFV, CHO cells coexpressing anti-CD3 scFV and HHLA2, or untransfected CHO cells in the presence or absence of CD28 mAb as indicated. Luciferase activity represented as relative light units (RLU). (B, C) Jurkat IL2-reporter T cells expressing KIR3DL3 were co-cultured with CHO cells coexpressing anti-CD3 scFV and HHLA2 in the presence of CD28 mAb and (B) HHLA2 mAbs or (C) KIR3DL3 mAbs. Fold activation of IL2 reporter luciferase activity is presented as mean ± S.D. (n≥3; **** P≤0.0001).
Figure 5:
Figure 5:. KIR3DL3 is an inhibitory receptor in NK cells and NK cytotoxicity is enhanced by HHLA2–KIR3DL3 blockade.
(A) NK-92MI cytotoxicity on K562 cells and K562 cells expressing HHLA2. (B) NK-92MI cytotoxicity on Raji cells harboring the β2M deletion (Raji-B2M KO cells) and Raji-B2M KO cells expressing HHLA2. (C, D) NK-92MI cytotoxicity on K562 cells expressing HHLA2 at an E:T ratio of 3:1 in the presence of (C) HHLA2 antibodies or (D) KIR3DL3 antibodies and isotype controls. (E, F) NK-92 MI cytotoxicity on Raji-B2M KO cells expressing HHLA2 at the indicated E:T ratios in presence of 10 ug/ml of (E) KIR3DL3 or (F) HHLA2 antibodies and isotype controls. (G) NK-92 MI cells were incubated with Raji B2M KO or with Raji B2M KO cells overexpressing HHLA2 at the indicated E:T ratios. Degranulation was measured as the % CD107a positive cells of the CD56+ population. Controls were effector cells alone or effector cells with PMA/ION, which leads to total degranulation. (H) Enhanced degranulation of NK-92 MI cells targeting Raji B2M KO cells overexpressing HHLA2 in the presence of KIR3DL3 mAb (1G7) as compared with isotype control. N>3 replicates. Quantifications are presented as mean ± S.D. (N≥3; P≥0.05; *P≤0.05; **P≤0.01; ***P≤0.001; ****P≤0.0001).
Figure 6:
Figure 6:. HHLA2 expression is non-overlapping with PDL1 expression.
(A) Expression levels of B7 family members in RCC as compared with normal kidney from TCGA samples. (B, C) Scatter plots of HHLA2 and PDL1 expression in ccRCC; sample scores for (B) pilot and (C) BMS-010 patient cohorts. (D,E) Sequential tissue sections from a ccRCC nephrectomy that expressed both HHLA2 and PDL1. (D) Staining for HHLA2 and (E) for PDL1, shows distinct, non-overlapping, areas of HHLA2 and PDL1 expression in the same tumor. Higher magnifications of the selected areas are also shown. The red box highlights region 1 of the tumor that is an HHLA2 positive area that is PDL1 negative; the black box highlights region 2 of the tumor that is a PDL1 positive area and HHLA2 negative. Scale bar: 50 μm. (F) RT-PCR analysis of HHLA2 and PDL1 expression in RCC cell lines (A498 and 786-O) after 48 h incubation with IFNү, IL10 and TGFβ (10ng/ml). Quantifications are presented as mean ± S.D. (n≥3; two-way ANOVA; ****P≤0.0001).
Figure 7:
Figure 7:. Model for HHLA2 pathway.
HHLA2 delivers an immune-stimulatory signal via TMIGD2 in naïve T cells or NK cells. (A) T-cell activation leads to a loss of TMIGD2 expression and gain of KIR3DL3. HHLA2 delivers an immune-inhibitory signal via KIR3DL3 in activated T cells. (B) NK-cell cytolytic activity is regulated by inhibitory and activating receptors. The inhibitory receptors include most KIRs, CD94/NKG2A, and LILRBI, which recognize MHC class I, E, and G, respectively. The activating receptors include NKG2D, NKp30, NKp44, NKp46, CD94/NKG2C, and TMIGD2 which recognize ULBP-1, MICA, MICB, B7-H6, HLA-E, HHLA2, and others. If tumors lose MHC class I expression (missing self), the inhibitory signal is reduced and the activating signals dominate, leading to tumor lysis by the NK cells. HHLA2 on tumors would be an inhibitory signal, independent of MHC class I, that inhibits lysis by KIR3DL3+ NK cells.

Comment in

References

    1. Zou W, Wolchok JD, Chen L. PD-L1 (B7-H1) and PD-1 pathway blockade for cancer therapy: Mechanisms, response biomarkers, and combinations. Sci Transl Med. 2016;8(328):328rv4. - PMC - PubMed
    1. Baumeister SH, Freeman GJ, Dranoff G, Sharpe AH. Coinhibitory Pathways in Immunotherapy for Cancer. Annu Rev Immunol. 2016;34:539–73. - PubMed
    1. Sharma P, Allison JP. The future of immune checkpoint therapy. Science. 2015;348(6230):56–61. - PubMed
    1. Pitt JM, Vetizou M, Daillere R, Roberti MP, Yamazaki T, Routy B, et al. Resistance Mechanisms to Immune-Checkpoint Blockade in Cancer: Tumor-Intrinsic and -Extrinsic Factors. Immunity. 2016;44(6):1255–69. - PubMed
    1. Zaretsky JM, Garcia-Diaz A, Shin DS, Escuin-Ordinas H, Hugo W, Hu-Lieskovan S, et al. Mutations Associated with Acquired Resistance to PD-1 Blockade in Melanoma. N Engl J Med. 2016;375(9):819–29. - PMC - PubMed

Publication types

MeSH terms