. 2021 Jan-Jun:296:100111.
doi: 10.1074/jbc.RA120.016175. Epub 2020 Dec 3.

The SARS-CoV-2 envelope and membrane proteins modulate maturation and retention of the spike protein, allowing assembly of virus-like particles

Affiliations

The SARS-CoV-2 envelope and membrane proteins modulate maturation and retention of the spike protein, allowing assembly of virus-like particles

Bertrand Boson et al. J Biol Chem. 2021 Jan-Jun.

Abstract

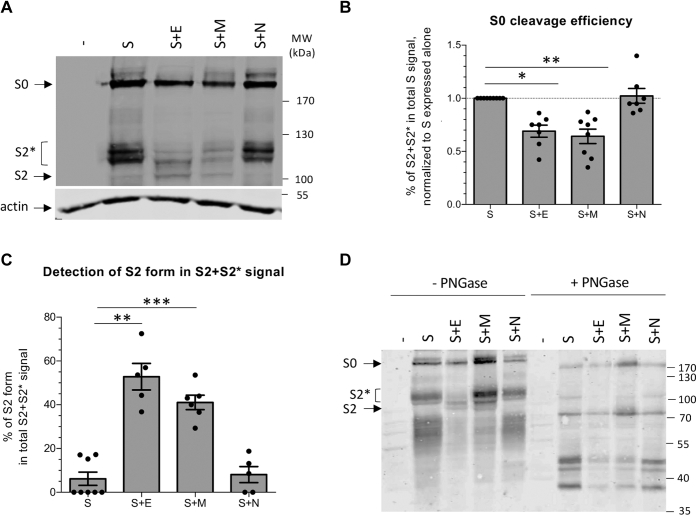
The severe acute respiratory syndrome coronavirus 2 (SARS-CoV-2), a β-coronavirus, is the causative agent of the COVID-19 pandemic. Like for other coronaviruses, its particles are composed of four structural proteins: spike (S), envelope (E), membrane (M), and nucleoprotein (N) proteins. The involvement of each of these proteins and their interactions are critical for assembly and production of β-coronavirus particles. Here, we sought to characterize the interplay of SARS-CoV-2 structural proteins during the viral assembly process. By combining biochemical and imaging assays in infected versus transfected cells, we show that E and M regulate intracellular trafficking of S as well as its intracellular processing. Indeed, the imaging data reveal that S is relocalized at endoplasmic reticulum (ER)-Golgi intermediate compartment (ERGIC) or Golgi compartments upon coexpression of E or M, as observed in SARS-CoV-2-infected cells, which prevents syncytia formation. We show that a C-terminal retrieval motif in the cytoplasmic tail of S is required for its M-mediated retention in the ERGIC, whereas E induces S retention by modulating the cell secretory pathway. We also highlight that E and M induce a specific maturation of N-glycosylation of S, independently of the regulation of its localization, with a profile that is observed both in infected cells and in purified viral particles. Finally, we show that E, M, and N are required for optimal production of virus-like-particles. Altogether, these results highlight how E and M proteins may influence the properties of S proteins and promote the assembly of SARS-CoV-2 viral particles.

Keywords: COVID-19; SARS-CoV; glycoprotein; infectious disease; secretion; viral protein; virus assembly.


Conflict of interest statement

Conflict of interest The authors declare that they have no conflicts of interest with the contents of this article.

Figures

Figure 1
Figure 1
Processing of SARS-CoV-2 spike protein is influenced by other viral proteins.A, representative western blot analysis of cell lysates and pellets of ultracentrifugated supernatants from Vero E6 cells infected by SARS-CoV-2 (infection) or transfected with a plasmid encoding S (S-transfection). B, representative western blot analysis of cell lysates of 293T cells transfected with the same plasmid. The blots were revealed using an anti-S2 antibody. The arrows and bracket represent S0, S2, and S2 forms. C, quantification of the proportions of S0 and (S2+S2) forms in lysates of SARS-CoV-2-infected versus S-transfected Vero E6 or 293T cells as described in (A and B).
Figure 2
Figure 2
Coexpression of SARS-CoV-2 E and M alters S processing and maturation.A, representative western blot analysis of lysates 293T cells transfected with a plasmid encoding S alone versus S combined with plasmids expressing E, M, or N, as indicated. The blots were revealed using anti-S2 and antiactin antibodies. The arrows and bracket represent S0, S2, and S2∗ forms. B, quantification of the percentage of (S2+S2) forms in the total S signal (S2+S2+S0) by quantitative western blot analysis as described in (A) and normalized to condition when S expressed alone. C quantification of the percentage of S2 form in the total S2+S2 signal by quantitative western blot analysis as described in (A). D, western blot analysis of cell lysates of 293T cells transfected with a plasmid encoding S alone or S combined with plasmids expressing E, M, or N that were left untreated (–PNGase) or that were treated with PNGase (+PNGase) to remove glycans. The blots were revealed using an anti-S2 antibody. The arrows and bracket represent S0, S2, and S2 forms. The dots on the graphs represent results of independent experiments.
Figure 3
Figure 3
Expression of SARS-CoV-2 E and M induced the retention of S, which prevents syncytia formation.A, representative confocal microscopy images of Vero E6 cells infected or transfected with a plasmid encoding S alone or S combined with plasmids expressing E, M, or N. After cell permeabilization, the cis-Golgi was revealed with the anti-GM130 antibody (green channel), the S protein was revealed with the anti-SARS-CoV-2 S1 antibody (red channel), and the nucleus was revealed with Hoechst (blue channel). Scale bars of panels and zooms from squared area represent 10 μm and 2 μm, respectively (top). The S protein was also revealed on nonpermeabilized cells (bottom). B, the Manders’ coefficient M1 represents the fraction of S overlapping with GM130, and the M2 coefficients represent the fraction of GM130 overlapping with S. C, representative pictures of syncytia detected in Vero E6 cells transfected with a plasmid encoding S alone or S combined with plasmids expressing E, M, or N. The scale bar represents 40 μm. D, fusion index (left) and number of nuclei per syncytia (right) of the different conditions as described in (C). The dots on the graphs represent results of independent experiments.
Figure 4
Figure 4
SARS-CoV-2 E induces the retention of S via slowing down the cell secretory pathway. Huh7.5 or Vero E6 cells were transfected with plasmids encoding a GFP-VSV-Gts fusion protein (referred to as VSV-Gts in the figure and below) and HCV p7 (JFH1) or SARS-CoV E at two different doses, as indicated. Transfected cells were grown overnight at 40 °C, which maintains VSV-Gts unfolded and results in its accumulation in the ER. Cells were then incubated for different periods of time (0 h, 1 h, 2 h, and/or 3h, as indicated) at 32 °C, which allows restoration of its folding and thus, its secretion. A representative western blot analysis of cell lysates coexpressing VSV-Gts and E or p7, digested with endoH glycosidase. The blots were revealed using an anti-GFP antibody, allowing the detection of the GFP-VSV-Gts fusion protein. The endoH-resistant VSV-Gts species (arrows) indicate proteins that traffic to and beyond the Golgi apparatus. The molecular weight markers are indicated in kDa. B, quantification of western blots as described in (A). C, quantification of western blot analysis of cell lysates of Huh7.5 or Vero E6 cells coexpressing VSV-Gts and E or p7, lysed at 3 h (VeroE6 cells) or 2 h (Huh7.5) posttemperature shifting and digested with endoH glycosidase. The timing was chosen to have the same percentage of endoH resistant forms of VSV-Gts in both cell types. The dots on the graphs represent results of independent experiments. D, representative histograms of cell surface expression of VSV-Gts assessed by flow cytometry, using the 41A1 mAb directed against VSV-G ectodomain. E, cell surface expression of VSV-Gts as assessed by the variations of the mean fluorescence intensity (delta MFI) of cell surface-expressed VSV-Gts relative to time 0 h at 32 °C. The results were normalized to the control condition (–), in which VSV-Gts was expressed without E or p7.
Figure 5
Figure 5
The C-terminal moiety of S cytoplasmic tail is essential for M-mediated retention of SARS-CoV-2 S.A, alignment of sequences of the last amino acids of S of SARS-CoV-2 or mutated by deletion of the last 19 amino acids (SΔ19). The box represents the dibasic retrieval signal. B, representative confocal microscopy images of Vero E6 cells transfected with a plasmid encoding SΔ19 alone or SΔ19 combined with plasmids expressing E or M. The cis-Golgi was revealed with the anti-GM130 antibody (green channel), the S protein was revealed with the anti-SARS-CoV2 S1 antibody (red channel), and the nucleus was revealed with Hoechst (blue channel). The Manders’ coefficient M1 represents the fraction of S overlapping with GM130, and the M2 coefficients represent the fraction of GM130 overlapping with S. Scale bars of panels and zooms from squared area represent 10 μm and 2 μm, respectively. The S protein was also revealed on nonpermeabilized cells (bottom). C, representative pictures of syncytia detected in Vero E6 cells transfected with a plasmid encoding SΔ19 alone or SΔ19 combined with plasmids expressing E or M (left). Fusion index and number of nuclei per syncytia determined for the different conditions (right). The scale bar represents 40 μm. D, representative western blot analysis of 293T cells transfected with a plasmid encoding SΔ19 or SΔ19 combined with plasmids encoding E or M. The blots were revealed using an anti-S2 antibody. The arrows and bracket represent S0, S2, and S2 forms. E, quantification of indicated S forms from independent western blot as described in (D). F, Quantification of the percentage of S2 forms in the total (S2+S2) signal by quantitative western blot analysis as described in (D). The dots on the graphs represent results of independent experiments.
Figure 6
Figure 6
Secretion of SARS-CoV-2 S-displaying VLPs requires expression of E, M, and N.A, representative western blot analysis of cell lysates and pellets from supernatants of 293T transfected with a plasmid encoding S alone or S combined with plasmids encoding E, M, and N. The blots were revealed using an anti-S2 antibody. The arrows and bracket represent S0, S2, and S2∗ forms and N. B, the amounts of total S forms (S2+S2∗+S0) detected in pellets of ultracentrifugated supernatants of producer cells were determined by quantification from independent western blots as described in (A) and are displayed relative to S expressed alone. C, proportion of S forms in lysates and pellets determined by quantification of independent western blot as described in (A).
Figure 7
Figure 7
Model of localization of SARS-CoV2 S protein. Due to its weak retention signal located at the C-terminus of its cytoplasmic tail, S expressed alone is found at the cell surface but also inside the cells. In contrast, removal of the last 19 amino acids (SΔ19) increases the presence of S at the cell surface. Coexpression of E induces the retention of both wt S and SΔ19 by altering the cell secretory pathway. In contrast, coexpression of M induces the retention of wt S only. Irrespective of S retention signal, the presence of E and M modulates the maturation of N-glycans of S.

References

    1. WHO. Coronavirus Disease (COVID-2019) situation reports.
    1. de Haan C.A., Rottier P.J. Molecular interactions in the assembly of coronaviruses. Adv. Virus Res. 2005;64:165–230. - PMC - PubMed
    1. Masters P.S. The molecular biology of coronaviruses. Adv. Virus Res. 2006;66:193–292. - PMC - PubMed
    1. Schoeman D., Fielding B.C. Coronavirus envelope protein: current knowledge. Virol. J. 2019;16:69. - PMC - PubMed
    1. Pervushin K., Tan E., Parthasarathy K., Lin X., Jiang F.L., Yu D., Vararattanavech A., Soong T.W., Liu D.X., Torres J. Structure and inhibition of the SARS coronavirus envelope protein ion channel. PLoS Pathog. 2009;5:e1000511. - PMC - PubMed

Publication types

MeSH terms

Substances