. 2020 Dec 8;117(49):31198-31207.
doi: 10.1073/pnas.1922342117. Epub 2020 Nov 23.

ATP13A2-mediated endo-lysosomal polyamine export counters mitochondrial oxidative stress

Affiliations

ATP13A2-mediated endo-lysosomal polyamine export counters mitochondrial oxidative stress

Stephanie Vrijsen et al. Proc Natl Acad Sci U S A. .

Abstract

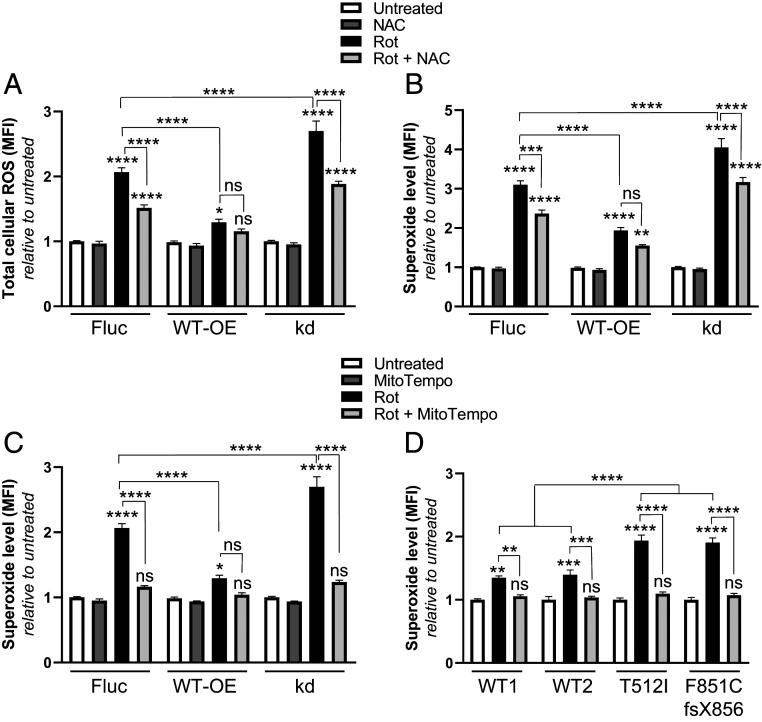
Recessive loss-of-function mutations in ATP13A2 (PARK9) are associated with a spectrum of neurodegenerative disorders, including Parkinson's disease (PD). We recently revealed that the late endo-lysosomal transporter ATP13A2 pumps polyamines like spermine into the cytosol, whereas ATP13A2 dysfunction causes lysosomal polyamine accumulation and rupture. Here, we investigate how ATP13A2 provides protection against mitochondrial toxins such as rotenone, an environmental PD risk factor. Rotenone promoted mitochondrial-generated superoxide (MitoROS), which was exacerbated by ATP13A2 deficiency in SH-SY5Y cells and patient-derived fibroblasts, disturbing mitochondrial functionality and inducing toxicity and cell death. Moreover, ATP13A2 knockdown induced an ATF4-CHOP-dependent stress response following rotenone exposure. MitoROS and ATF4-CHOP were blocked by MitoTEMPO, a mitochondrial antioxidant, suggesting that the impact of ATP13A2 on MitoROS may relate to the antioxidant properties of spermine. Pharmacological inhibition of intracellular polyamine synthesis with α-difluoromethylornithine (DFMO) also increased MitoROS and ATF4 when ATP13A2 was deficient. The polyamine transport activity of ATP13A2 was required for lowering rotenone/DFMO-induced MitoROS, whereas exogenous spermine quenched rotenone-induced MitoROS via ATP13A2. Interestingly, fluorescently labeled spermine uptake in the mitochondria dropped as a consequence of ATP13A2 transport deficiency. Our cellular observations were recapitulated in vivo, in a Caenorhabditis elegans strain deficient in the ATP13A2 ortholog catp-6 These animals exhibited a basal elevated MitoROS level, mitochondrial dysfunction, and enhanced stress response regulated by atfs-1, the C. elegans ortholog of ATF4, causing hypersensitivity to rotenone, which was reversible with MitoTEMPO. Together, our study reveals a conserved cell protective pathway that counters mitochondrial oxidative stress via ATP13A2-mediated lysosomal spermine export.

Keywords: P5B-type ATPase; antioxidant; mitochondria; neurodegeneration; polyamine transport.


Conflict of interest statement

Competing interest statement: Patent WO-2018002350-A1 of KU Leuven describes methods for detecting compounds with therapeutic use that target ATP13A2 or related isoforms using biological material and assays described in the current manuscript. A second patent of KU Leuven describing ATP13A2 cell models described in this manuscript has also been filed.

Figures

Fig. 1.
Fig. 1.
ATP13A2 prevents rotenone-induced cell death and mitochondrial damage. (AC) SH-SY5Y cells stably overexpressing firefly luciferase (Fluc, control), ATP13A2 (WT-OE), or sh-ATP13A2 (kd) and (D and E) patient-derived fibroblasts with loss-of-function mutations T512I or F851CfsX856 in ATP13A2 versus wild-type fibroblasts (WT1 and WT2) were treated with rotenone (Rot, 1 µM, 24 h). Subsequently, cell death was measured by means of a propidium iodide (PI) assay (A and D). MMP (B and E) and ATP production (C) were assessed as parameters of mitochondrial functionality. Data are the mean of a minimum of three independent experiments ± SEM. RLU, relative luminescence units; MFI, mean fluorescence intensity. *P < 0.05; **P < 0.01; ***P < 0.001; ****P < 0.0001; ns, nonsignificant versus respective untreated unless depicted otherwise; ANOVA post hoc Tukey’s multiple comparison test.
Fig. 2.
Fig. 2.
ATP13A2 prevents the accumulation of mitochondrial-generated ROS. (AC) In SH-SY5Y cells stably overexpressing Fluc (control), ATP13A2 (WT-OE), or sh-ATP13A2 (kd), total cellular ROS (A) or mitochondrial-generated superoxide (B and C) levels were analyzed by means of DCFDA or MitoSOX probes, respectively, followed by flow cytometry. Cells were pretreated (1 h) or not with a general (NAC, 2 mM; A and B) or a mitochondrial-specific superoxide scavenger (MitoTEMPO, 1 µM; C) before adding rotenone (Rot, 1 µM, 24 h). In human patient-derived fibroblasts (D), the same experimental setup was used (Rot, 1 µM, 24 h), and pretreatment with MitoTEMPO (1 µM) decreased the MitoROS levels induced by Rot to levels similar to those seen in WT cells (WT1, WT2). Data are the mean of a minimum of three independent experiments ± SEM. MFI, mean fluorescence intensity. *P < 0.05; **P < 0.01; ***P < 0.001; ****P < 0.0001; ns, nonsignificant versus respective untreated unless depicted otherwise; ANOVA post hoc Tukey’s multiple comparison test.
Fig. 3.
Fig. 3.
ATP13A2’s antioxidative effect prevents an ATF4-dependent stress response. SH-SY5Y cells stably overexpressing sh-Fluc (control) or sh-ATP13A2 (kd) were (AC) treated with rotenone (Rot, 1 µM), and protein levels of various cellular stress markers were followed over a time span of 24 h. Immunoblotting was performed for the transcription factors (A) ATF4 and (B) CHOP, and for (C) the mitochondrial chaperone HSP60. All obtained protein levels were normalized for GAPDH before plotting relative to the condition indicated in the bar graph axis. (D) Rot (1 µM, 24 h) treatment combined with the mitochondrial superoxide scavenger MitoTEMPO (1 µM, 1 h pretreatment + 24 h) prevented the up-regulation of the stress response proteins ATF4 and CHOP (kd1 and kd2 indicate that two different knockdown cell lines were used, stably transduced with two different shRNAs targeting ATP13A2). Data are the mean of a minimum of three independent experiments ± SEM. *P < 0.05, **P < 0.01, ***P < 0.001, ****P < 0.0001 versus respective untreated unless depicted otherwise; ####P < 0.0001 versus rotenone-treated sh-Fluc; ANOVA post hoc Tukey’s multiple comparison test.
Fig. 4.
Fig. 4.
Spermine transported by ATP13A2 provides protection toward oxidative stress, thereby preventing the activation of a stress response. SH-SY5Y cells stably overexpressing Fluc (control), ATP13A2 (WT-OE), catalytically inactive D508N ATP13A2 (D508N-OE), or sh-ATP13A2 (kd) were treated with rotenone (Rot, 1 µM, 24 h; A and B) or DFMO (0.1 mM, 48 h; CE) with or without spermine (SPM) (1 µM; BE; last 24 h) or MitoTEMPO (1 µM; D and E; last 24 h). Subsequently, superoxide levels were measured with the MitoSOX probe (AC), protein levels of stress response markers ATF4 and CHOP were assessed via immunoblotting (D), or cell death readout was performed by means of a propidium iodide assay with flow cytometry (E). Data are the mean of a minimum of three independent experiments ± SEM. MFI, mean fluorescence intensity. **P < 0.01; ***P < 0.001; ****P < 0.0001; ns, nonsignificant versus respective untreated unless depicted otherwise, ANOVA post hoc Tukey’s multiple comparison test.
Fig. 5.
Fig. 5.
Spermine transported by ATP13A2 is redistributed to the mitochondria. SH-SY5Y neuroblastoma cells with endogenous ATP13A2 levels (control) or with ATP13A2 KO overexpressing WT ATP13A2 (KO/WT), or a catalytically dead mutant ATP13A2 (KO/D508N) were exposed to DFMO (1 mM, 48 h; A and B), nanoparticles (180 ng/mL, 1 h incubation before DFMO addition) (A), spermine (SPM, 1 µM, 6 h; B), BODIPY-labeled spermine (BODIPY-SPM, 1 µM, 90 min; C and D), or a combination thereof. Subsequently, superoxide levels were assessed with the MitoSOX probe (A), polyamine levels were determined via metabolomics of total cell lysates (B), or cells were fixed and stained for TOMM22 to analyze colocalization (yellow) of BODIPY-SPM (green) and TOMM22 (red) (C) or BODIPY-SPM mean fluorescence intensity within the TOMM22-stained mitochondrial network (D, yellow borders represent mitochondria). Representative images are shown, boxed areas are enlarged in the Inset. For the analysis in C, images were taken with settings optimized for the individual cell lines. For the analysis in D, images were taken with equal settings to enable a comparison of mitochondrial BODIPY-SPM mean fluorescence intensity between the cell lines (Scale bar, 5 µm.) Data are the mean of a minimum of three independent experiments ± SEM. In each experiment, data are gathered of two isogenic cell lines (for control, KO, KO/WT, and KO/D508N) of which the average is displayed. MFI, mean fluorescence intensity. *P < 0.05, **P < 0.01, ***P < 0.001, ****P < 0.0001; ns, nonsignificant versus respective untreated (A and B), or KO/WT (C and D) unless depicted otherwise, ANOVA post hoc Tukey’s or Dunnett’s multiple comparison test (A and B, respectively), Mann–Whitney U test (C), or two-tailed unpaired t test (D).
Fig. 6.
Fig. 6.
The ATP13A2 ortholog catp-6 exerts a mitochondrial protective antioxidant function in vivo in C. elegans, thereby preventing the activation of a stress response. WT (control) C. elegans and strains carrying a loss-of-function mutation (ok3473) in the P5B-ortholog catp-6, either rescued or not by overexpression of wild-type catp-6 (WT) or a catalytically inactive mutant (D465N), were exposed to rotenone (Rot, 10 µM) (A, B, D, and E) or analyzed under basal conditions (C, F, G, and H) in absence (A, B, F, and H) or presence (C, D, E, and G) of MitoTEMPO (10 mM). Subsequently, we measured (A and E) lethality (60 h and 72 h Rot exposure, respectively), (B and C) MMP (16 h Rot exposure), (D) superoxide levels (16 h Rot exposure), or (FH) expression level of the Phsp60::GFP reporter. In H, animals were treated either with mock(RNAi) or with atfs-1(RNAi). For representative pictures of each panel, please see SI Appendix, Fig. S10. Data are the mean of a minimum of three independent experiments ± SEM. MFI, mean fluorescence intensity. **P < 0.01, ***P < 0.001, ****P < 0.0001; ns, nonsignificant versus respective untreated unless otherwise indicated; ##P < 0.01, ####P < 0.0001 versus rotenone-treated control; ANOVA or Kruskal–Wallis with post hoc Tukey’s (A, B, and E) or Dunn’s (C, D, F, G, and H) multiple comparison test, respectively.

References

    1. Ramirez A., et al. , Hereditary parkinsonism with dementia is caused by mutations in ATP13A2, encoding a lysosomal type 5 P-type ATPase. Nat. Genet. 38, 1184–1191 (2006). - PubMed
    1. Di Fonzo A. et al. .; Italian Parkinson Genetics Network , ATP13A2 missense mutations in juvenile parkinsonism and young onset Parkinson disease. Neurology 68, 1557–1562 (2007). - PubMed
    1. Lin C. H., et al. , Novel ATP13A2 variant associated with Parkinson disease in Taiwan and Singapore. Neurology 71, 1727–1732 (2008). - PubMed
    1. Estrada-Cuzcano A., et al. , Loss-of-function mutations in the ATP13A2/PARK9 gene cause complicated hereditary spastic paraplegia (SPG78). Brain 140, 287–305 (2017). - PMC - PubMed
    1. Bras J., Verloes A., Schneider S. A., Mole S. E., Guerreiro R. J., Mutation of the parkinsonism gene ATP13A2 causes neuronal ceroid-lipofuscinosis. Hum. Mol. Genet. 21, 2646–2650 (2012). - PMC - PubMed

Publication types

MeSH terms