. 2020 Dec 8;117(49):31448-31458.
doi: 10.1073/pnas.2014389117. Epub 2020 Nov 23.

High-resolution mouse subventricular zone stem-cell niche transcriptome reveals features of lineage, anatomy, and aging

Affiliations

High-resolution mouse subventricular zone stem-cell niche transcriptome reveals features of lineage, anatomy, and aging

Xuanhua P Xie et al. Proc Natl Acad Sci U S A. .

Abstract

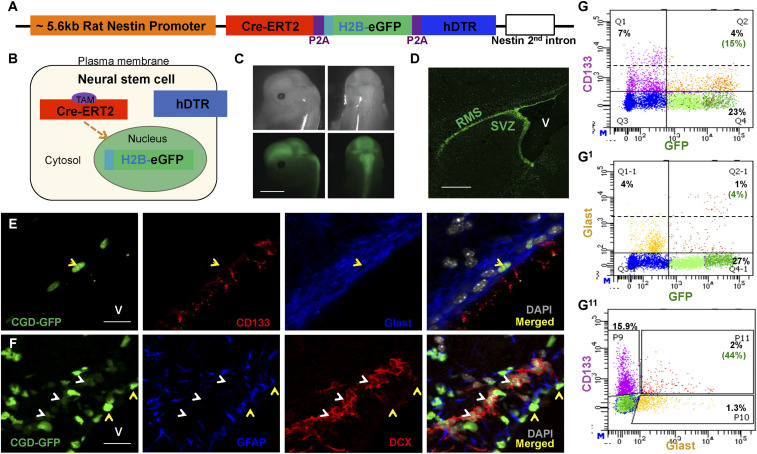
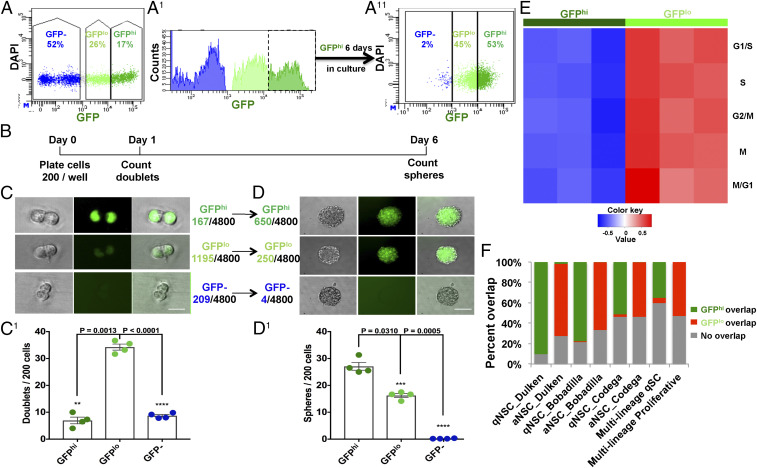
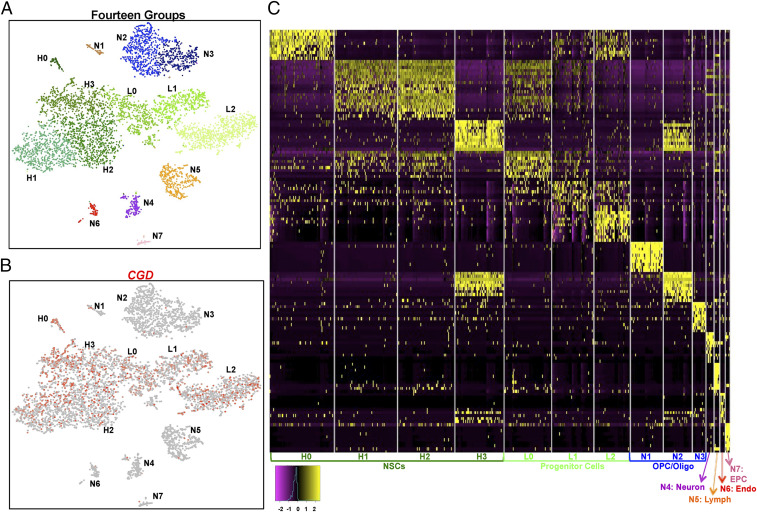
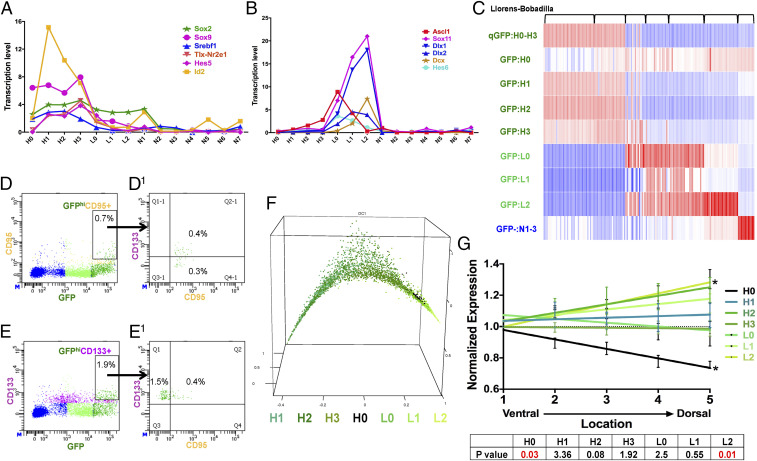
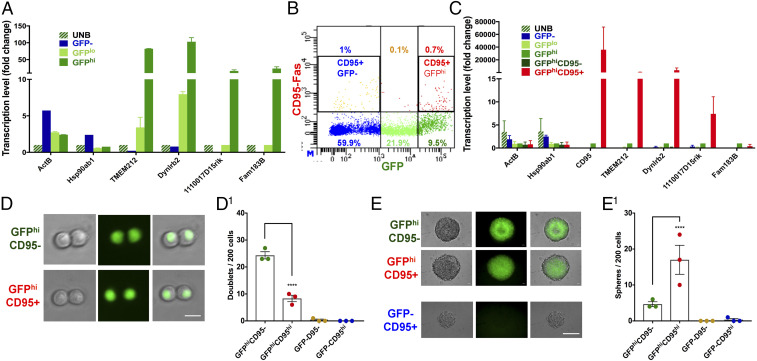
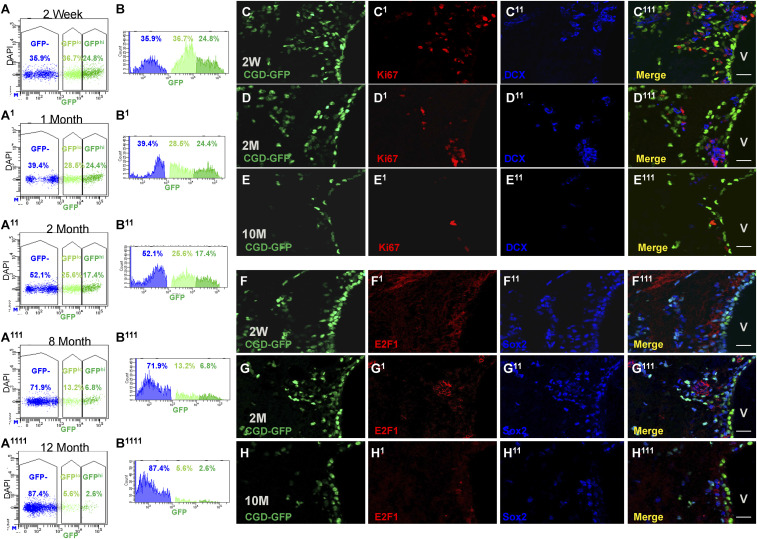
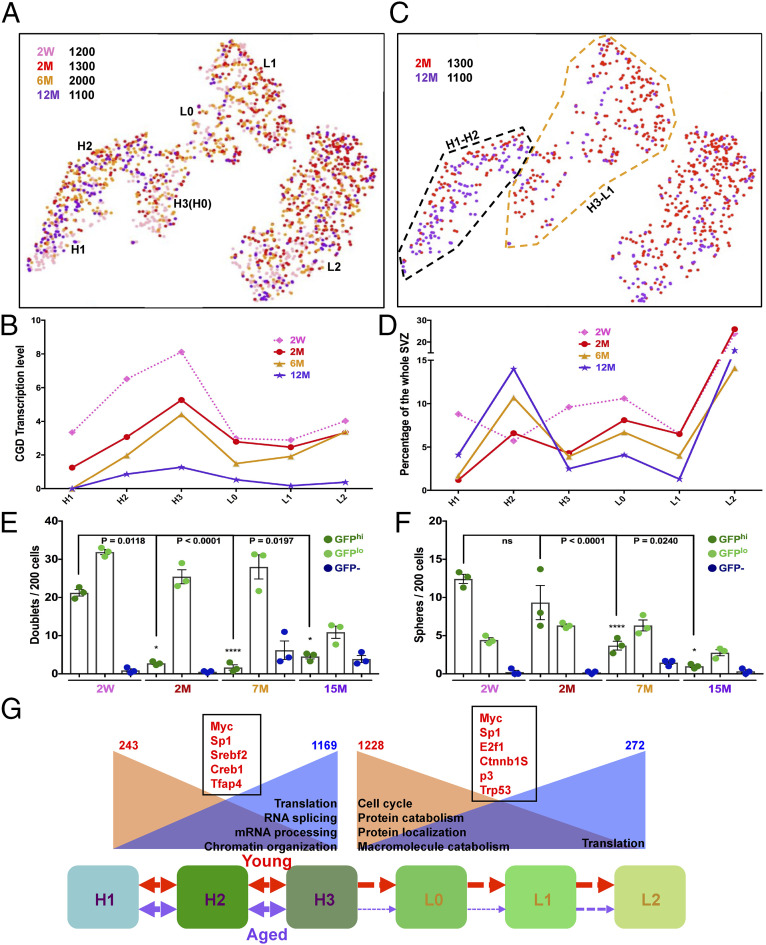
Adult neural stem cells (NSC) serve as a reservoir for brain plasticity and origin for certain gliomas. Lineage tracing and genomic approaches have portrayed complex underlying heterogeneity within the major anatomical location for NSC, the subventricular zone (SVZ). To gain a comprehensive profile of NSC heterogeneity, we utilized a well-validated stem/progenitor-specific reporter transgene in concert with single-cell RNA sequencing to achieve unbiased analysis of SVZ cells from infancy to advanced age. The magnitude and high specificity of the resulting transcriptional datasets allow precise identification of the varied cell types embedded in the SVZ including specialized parenchymal cells (neurons, glia, microglia) and noncentral nervous system cells (endothelial, immune). Initial mining of the data delineates four quiescent NSC and three progenitor-cell subpopulations formed in a linear progression. Further evidence indicates that distinct stem and progenitor populations reside in different regions of the SVZ. As stem/progenitor populations progress from neonatal to advanced age, they acquire a deficiency in transition from quiescence to proliferation. Further data mining identifies stage-specific biological processes, transcription factor networks, and cell-surface markers for investigation of cellular identities, lineage relationships, and key regulatory pathways in adult NSC maintenance and neurogenesis.

Keywords: aging; neural stem cell; single-cell RNA sequencing; subventricular zone; transcriptome.


Conflict of interest statement

The authors declare no competing interest.

Figures

Fig. 1.
Fig. 1.
CGD transgene labels adult subventricular zone neural stem cells and progenitors. (A) Diagram of the transgene construct. Purple blocks represent the P2A ribosomal skipping element insulating the three gene cassettes. (B) Cartoon illustrates localization of the three transgene products in NSC: Cre-ERT2 in the cytosol, H2B-eGFP in the nucleus, and hDTR on the plasma membrane. (C) Transgene GFP imaging of a 14-d embryo undergoing neurogenesis illustrates CGD transgene expression in developing central nervous system (Scale bar, 3 mm.) (D) Enhanced transgene GFP expression in adult SVZ and rostral migratory stream (RMS). V: lateral ventricle. (Scale bar, 500 μm.) (E) Coronal section staining of 2-mo-old mouse SVZ shows colocalization of CGD-GFP with stem-cell markers CD133 and Glast. V: lateral ventricle. (Scale bar, 20 μm.) (F) Relationship between CGD-GFPhi and stem-cell marker GFAP versus GFPlo and progenitor marker DCX in a sagittal section of adult SVZ (Scale bar, 20 μm.) (G, G1, and G11) A small fraction of CGD-GFP+ cells in the SVZ express CD133 (G, 15%) or Glast (G1, 4%), and 44% of all CD133+Glast+ double-positive cells express CGD-GFP (G11). V: lateral ventricle. See also SI Appendix, Fig. S1.
Fig. 2.
Fig. 2.
Functional assays validate CGD expression in adult neural stem and progenitor cells. (A and A11) FACS analysis of whole adult SVZ delineates two GFP populations: GFPhi and GFPlo and GFP– cells. A1 presents a histogram view of GFP expression of the same data shown in A. (A11) When placed in serum-free culture, GFPhi cells sequentially progress to GFPlo and GFP– state. (B) Diagram of timeline for doublet and sphere formation assays below. (C and D1) Representative images and statistical analysis of C and C1 24-h doublet and subsequent (D and D1) 6-d sphere formation assays for FACS-sorted adult SVZ GFPhi, GFPlo, and GFP– cells. Note that, despite inefficient doublet formation, the more initially quiescent GFPhi cells are most efficient in forming neurospheres. Mean ± SEM, n = 4 biological replicate mice for each group (each representing six technical replicate wells). (Scale bars in C and D, 10 μm and 100 μm, respectively.) (E) Following RNAseq of GFPhi- and GFPlo-sorted cells, GSVA using cell-cycle signatures indicates a low proliferative status for GFPhi cells compared to GFPlo cells. (F) DEGs of GFPhi and GFPlo cells have high coincidence with published quiescent-stem and activated-progenitor cell signatures. qSC: quiescent stem cell (multilineage). See also SI Appendix, Fig. S2 and Dataset S1.
Fig. 3.
Fig. 3.
Adult SVZ single-cell RNA sequencing analysis reveals seven distinguishable CGD-GFP+ groups. (A) tSNE projection of Seurat analysis from the sum of the sorted SVZ samples (UNB, GFPhi, GFPlo, and GFP– cells) reveals 14 populations. (B) Normalized CGD expression visualized on tSNE coordinates of SVZ cells demonstrates its preferential expression in stem/progenitor populations. (C) DEGs distinguish 14 SVZ cell types. Heatmap is generated using the top 10 unique genes for each group. EPC: endothelial precursor cells; Endo: endothelial cells; Lymph: lymphocytes. See also SI Appendix, Fig. S3 and Dataset S2.
Fig. 4.
Fig. 4.
GFPhi cells resolve into four subgroups of quiescent neural stem cells. (A) NSC-specific transcription factors are enriched in the GFPhi subgroups (all SEs < 0.6; units are normalized values scaled to 10,000 counts/cell). (B) Neural progenitor-specific transcription factors are enriched in GFPlo subgroups (all SEs < 0.2; units are normalized values scaled to 10,000 counts/cell). (C) GFPhi and GFPlo subgroup-specific gene signatures improve resolution of published SVZ cell-sequencing profiles. Transcriptomes of 155 cells published in Llorens-Bobadilla et al. (23) were analyzed with our signatures. Each column represents one cell. (D, D1, E, and E1) FACS analysis showed (D and D1) approximately one-half of GFPhi;CD95+ cells are also CD133+, and (E and E1) about 20% of the GFPhi;CD133+ cells are CD95+. (F) Pseudotime analysis provides a nearest neighbor random walk of single-cell transcriptional profiles revealing a linear progression from GFPhi:H1 through GFPlo:L2. (G) H0 cells preferentially reside on the ventral aspect of adult SVZ as defined by Allen Brain Atlas expression profiles. * indicates P values <0.05. See also SI Appendix, Fig. S4.
Fig. 5.
Fig. 5.
H0 cells have unique stem-like properties. (A) Expression of four H0-specific genes (Tmem212, Dynlrb2, Fam183b, and 1110017D15rik) was verified by qRT-PCR in single-cell sequencing samples. Gene expression levels were normalized to UNB cells. Mean ± SEM, n = 2. (B) CD95-Fas receptor antibody labels one subgroup of GFPhi and one subgroup of GFP– cells. All of the numbers represent the percentage of each population among the whole SVZ. (C) GFPhi;CD95+ cells have enriched expression of the H0-specific genes. qRT-PCR was performed with GFP and CD95 sorted cells for the H0-specific genes. Gene expression levels were normalized to GFPhi cells. Mean ± SEM, n = 2. (D and D1) Representative images and quantification of doublet formation by GFP and CD95 sorted cells at 24 h. Note that GFPhi;CD95– cells are more efficient at forming doublets (Scale bar, 10 μm.) (E and E1) Representative images and quantification of sphere formation of GFP and CD95 sorted cells. Note that, reminiscent of Fig. 2 C and D, GFPhi;CD95+ cells, which were inefficient in doublet formation at 24 h, are most efficient at forming neurospheres 6 d later. Note also that GFP–;CD95+ cells do not form neurospheres. (Scale bar, 100 μm.) Mean ± SEM, n = 3 biological replicate mice for each group in D and E1. **** in D1 and E1 indicates P values <0.0001. See also SI Appendix, Fig. S5.
Fig. 6.
Fig. 6.
CGD-GFP+ cells decrease over age. (A and B) Whole SVZ FACS analysis delineates the decrease of CGD-GFP+ cells as they age from 2 wk (A and B), 1 mo (A1 and B1), 2 mo (A11 and B11), 8 mo (A111 and B111), until 12 mo (A1111 and B1111). (CE) IHC staining reveals Commensurate loss of CGD-GFP (C, D, and E) with Mki67 (C1–E1) and DCX (C11–E11) in 2-wk (C–C111), 2-mo (D–D111), and 10-mo mouse brain sagittal sections (E and E111). (Scale bar, 20 μm.) (FH) IHC staining for CGD-GFP (FH) and stem/progenitor markers E2F1 (F1–H1) and Sox2 (F11–H11) in 2-wk (F–F111), 2-mo (G–G111), and 10-mo mouse brains (H–H111) (Scale bar, 20 μm.) V: lateral ventricle in C111H111. See also SI Appendix, Fig. S6.
Fig. 7.
Fig. 7.
Aging quiescent neural stem cells exhibit deficiency in transition to the progenitor state. (A) tSNE projection reveals the neural stem/progenitor lineage distribution of four aged samples: 2 wk and 2, 6, and 12 mo. (B) CGD transcription levels consistently decrease over age in each GFP+ subgroup. (C) Direct comparison of the neural stem/progenitor-cell distribution between 2-mo (red) and 12-mo (purple) samples. Note the stark underrepresentation of the GFP:H3–L1 lineage in the 12-mo sample. The black dashed line marks the H1–H2 lineage, and the brown dashed line characterizes the H3–L1 cluster. (D) Quantitative illustration of distribution of each GFP+ subgroup (H1–L2) at different age points. Note the continuous decrease of H3–L1 lineage from 2- to 12-mo adult SVZs. (E and F) Quantification of doublet and sphere formation assays for SVZ GFPhi, GFPlo, and GFP– cells over age. Note that, by 7 mo, the GFPhi population begins to lose its capacity to transition from doublets to neurospheres, consistent with the reduced capacity to transition from H3 to L1 in vivo. Mean ± SEM; n = 3 biological replicate mice for each group (each representing three technical replicate wells). (G) Cartoon describes the activation blockage of adult NSC in old mice compared to young mice. H1 cells in the SVZ progress into H2 and H3 and then become activated to form L0, L1, and L2 cells. This progress is robust in young mice (red arrows), but reduced significantly in aged mice (purple arrows). H1–H2 and H3–L1 cells from 2 and 12 mo are combined to perform differential gene analysis. The numbers on the top reflect the down-regulated (red) and up-regulated (blue) genes in aged groups. GO analysis from the DEGs unravels potential signaling pathways responsible for the changes. The down-regulated (brown background) or up-regulated (blue background) pathways during aging are summarized. The red genes in black boxes reflect the putative transcription factors associated with the age-related gene expression change in either H1–H2 or H3–L1 lineages. See also Fig. 4F and SI Appendix, Fig. S7 and Dataset S3.

References

    1. Yousefi M., Li L., Lengner C. J., Hierarchy and plasticity in the intestinal stem cell compartment. Trends Cell Biol. 27, 753–764 (2017). - PMC - PubMed
    1. Wang L. D., Wagers A. J., Dynamic niches in the origination and differentiation of haematopoietic stem cells. Nat. Rev. Mol. Cell Biol. 12, 643–655 (2011). - PMC - PubMed
    1. Altman J., Das G. D., Autoradiographic and histological evidence of postnatal hippocampal neurogenesis in rats. J. Comp. Neurol. 124, 319–335 (1965). - PubMed
    1. Merkle F. T., et al. , Adult neural stem cells in distinct microdomains generate previously unknown interneuron types. Nat. Neurosci. 17, 207–214 (2014). - PMC - PubMed
    1. Ming G. L., Song H., Adult neurogenesis in the mammalian brain: Significant answers and significant questions. Neuron 70, 687–702 (2011). - PMC - PubMed

Publication types