. 2020 Nov 23;11(1):5938.
doi: 10.1038/s41467-020-19721-w.

ETNK1 mutations induce a mutator phenotype that can be reverted with phosphoethanolamine

Affiliations

ETNK1 mutations induce a mutator phenotype that can be reverted with phosphoethanolamine

Diletta Fontana et al. Nat Commun. .

Abstract

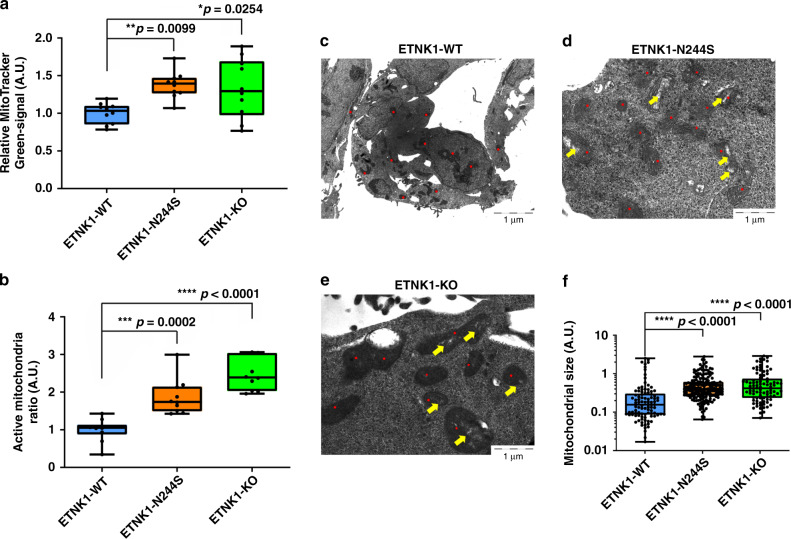
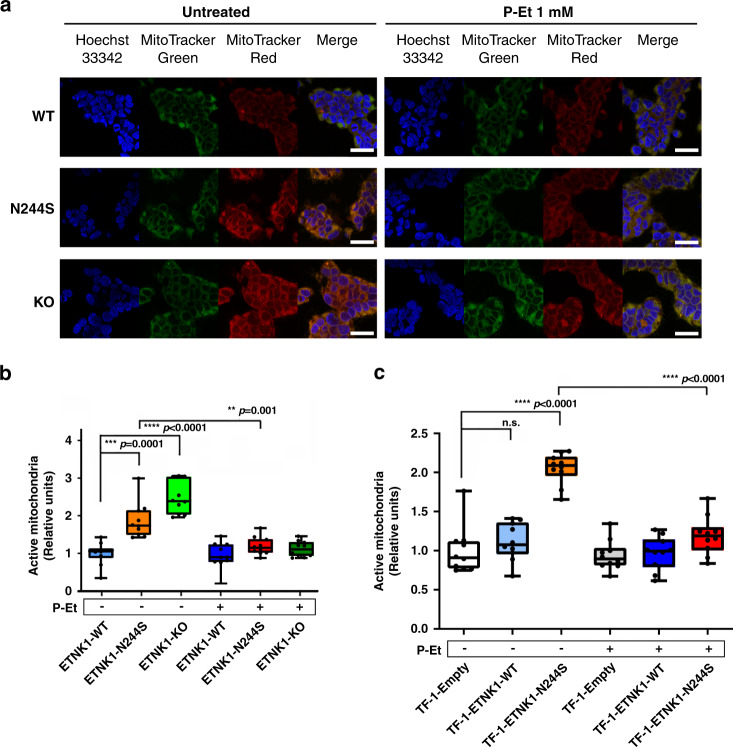
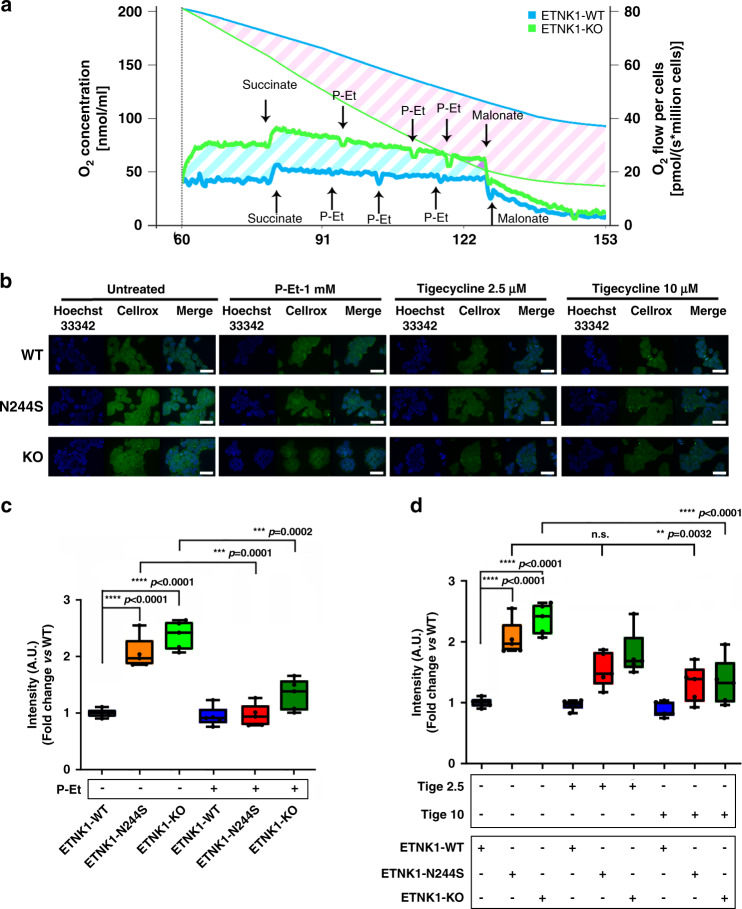
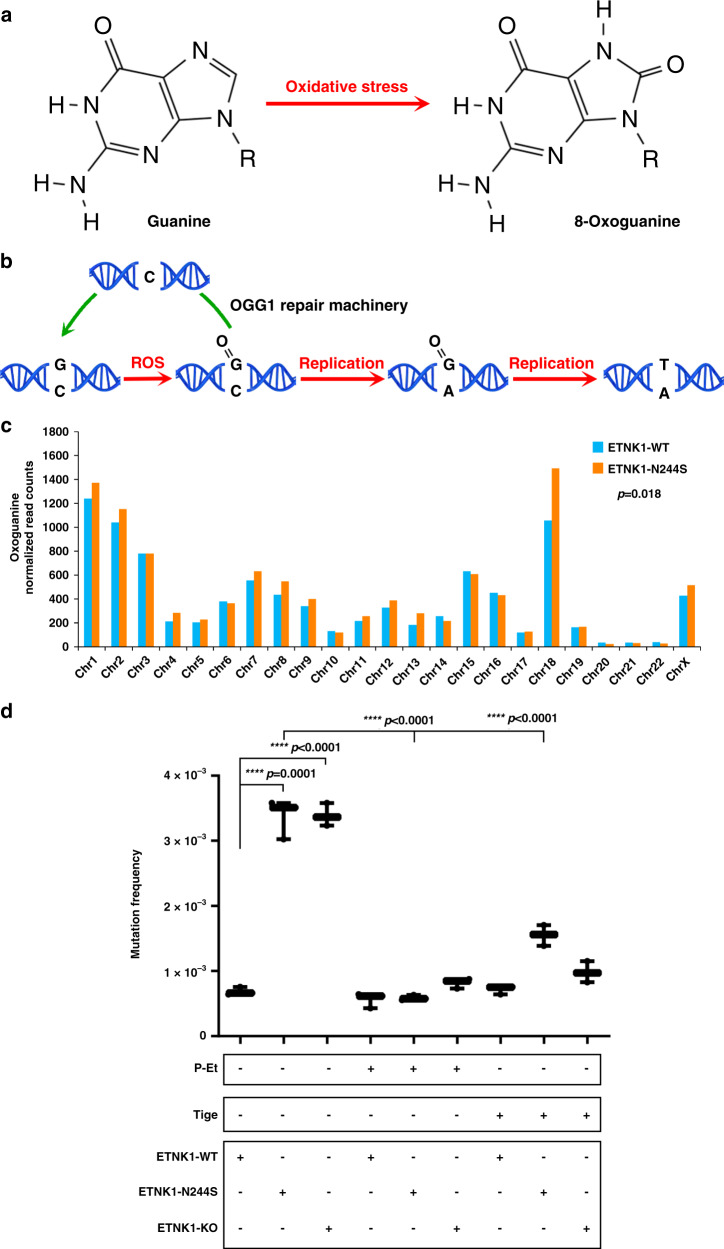
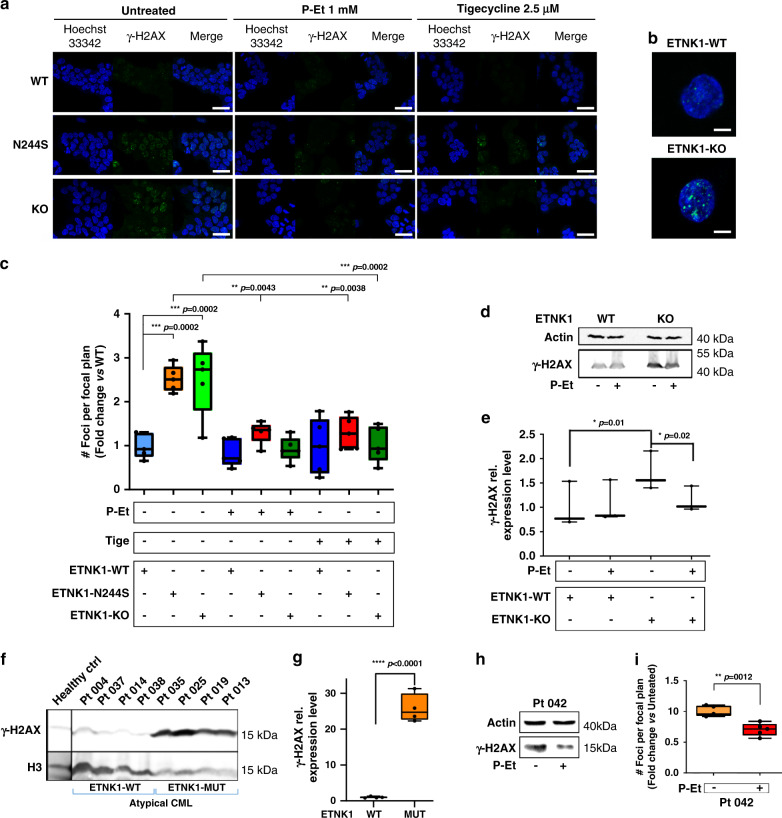
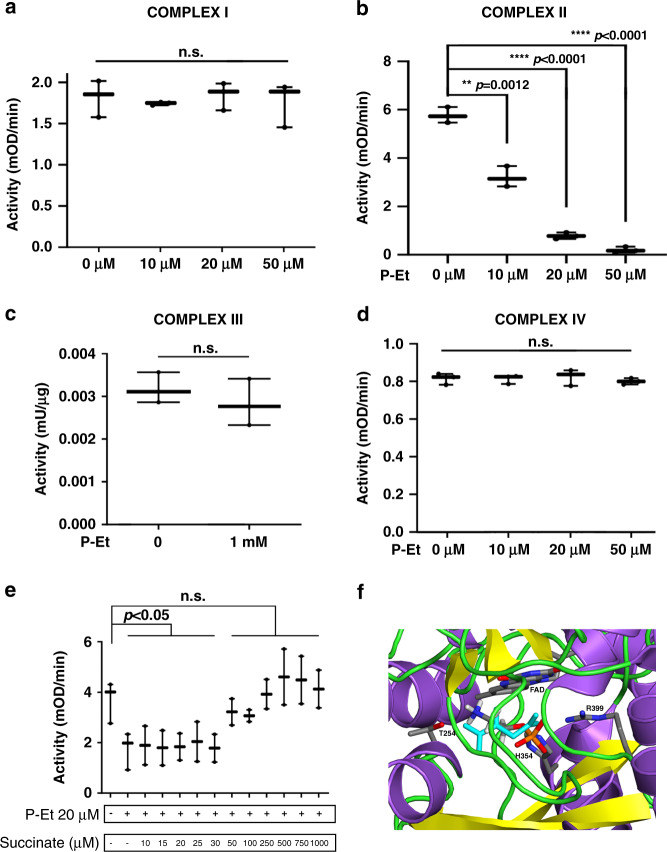
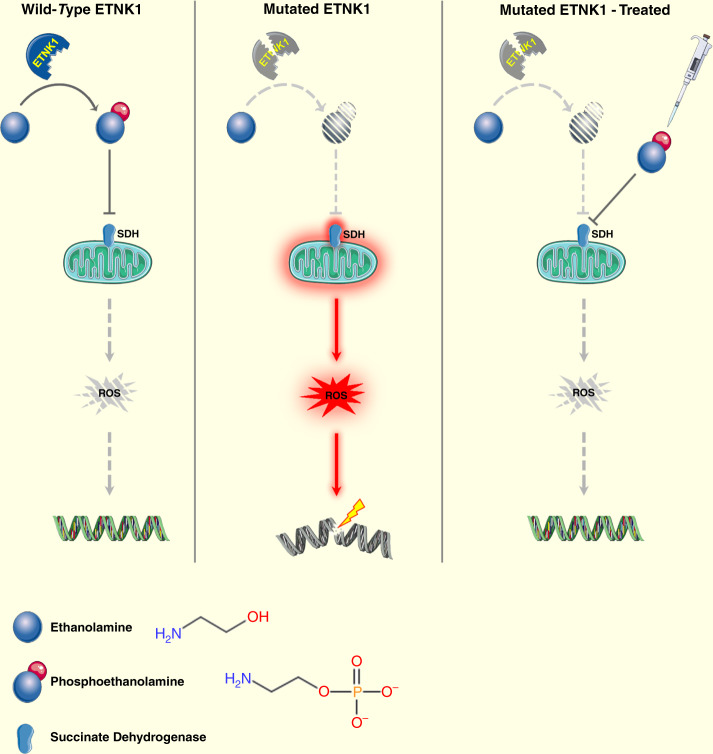
Recurrent somatic mutations in ETNK1 (Ethanolamine-Kinase-1) were identified in several myeloid malignancies and are responsible for a reduced enzymatic activity. Here, we demonstrate in primary leukemic cells and in cell lines that mutated ETNK1 causes a significant increase in mitochondrial activity, ROS production, and Histone H2AX phosphorylation, ultimately driving the increased accumulation of new mutations. We also show that phosphoethanolamine, the metabolic product of ETNK1, negatively controls mitochondrial activity through a direct competition with succinate at mitochondrial complex II. Hence, reduced intracellular phosphoethanolamine causes mitochondria hyperactivation, ROS production, and DNA damage. Treatment with phosphoethanolamine is able to counteract complex II hyperactivation and to restore a normal phenotype.


Conflict of interest statement

The authors declare no competing interests.

Figures

Fig. 1
Fig. 1. Mitochondria morphology and activity.
a Boxplots representing the MitoTracker Green analysis of ETNK1-WT, N244S, and KO CRISPR cell lines. Values represent relative units normalized on the ETNK1-WT signal. Statistical analyses were performed using one-way ANOVA with Tukey’s post-hoc test. The boxplots delimit the interquartile range; the central bar represents the median; the whiskers extend from minimum to maximum (n = 10 representative fields). At least 200 cells were analyzed. b Boxplots showing the MitoTracker Red-to-Green signal ratio as assessed on ETNK1-WT, N244S, and KO CRISPR cell lines normalized on ETNK1-WT. Statistical analyses were performed using one-way ANOVA with Tukey’s post-hoc test. The boxplots delimit the interquartile range; the central bar represents the median; the whiskers extend from minimum to maximum (n = 10 representative fields). At least 200 cells were analyzed. ce Electron microscopy scans relative to ETNK1-WT c, N244S d, and KO e CRISPR cell lines. Red dots highlight the position of individual mitochondria. Yellow arrows point to low electron density areas. A total of 13 individual cells were analyzed. f Quantification of mitochondria size in ETNK1-WT, N244S, and KO CRISPR cell lines as assessed by electron microscopy. Statistical analyses were performed using one-way ANOVA with Tukey’s post-hoc test. The boxplots delimit the interquartile range; the central bar represents the median; the whiskers extend from minimum to maximum (ETNK1-WT: n = 96 representative fields; ETNK1-N244S: n = 172 representative fields; ETNK1-KO: n = 90 representative fields; the experiment was performed once). Source data are provided as a Source data file.
Fig. 2
Fig. 2. Mitochondria activity in the absence and presence of P-Et.
a Confocal microscopy of MitoTracker Red/Green signal in ETNK1-WT, N244S, and KO CRISPR cell lines in the absence (left) and presence (right) of 1 mM P-Et for 24 h. At least 200 cells were analyzed. The scale bar corresponds to 40 µm. b Boxplots showing the MitoTracker Red-to-Green signal ratio of ETNK1-WT, N244S, and KO CRISPR cell lines normalized on ETNK1-WT in the absence and in presence of 1 mM P-Et for 24 h. The boxplots delimit the interquartile range; the central bar represents the median; the whiskers extend from minimum to maximum (n = 10 representative fields). Statistical analyses were performed using one-way ANOVA with Tukey’s post-hoc test. c MitoTracker Red-to-Green signal in the absence and in presence of 1 mM P-Et (for 24 h) in the myeloid TF-1 model. Statistical analyses were performed using one-way ANOVA with Tukey’s post-hoc test. The boxplots delimit the interquartile range; the central bar represents the median; the whiskers extend from minimum to maximum (n = 10 representative fields). At least 200 cells were analyzed. Source data are provided as a Source data file.
Fig. 3
Fig. 3. Mitochondria respiration and ROS production.
a Representative graph of O2 consumption rate (pmol/(s*106 cells)) and O2 concentration (nmol/ml) in ETNK1-WT and KO CRISPR lines (n = 4), measured by high-resolution respirometry Oroboros O2K (1 million cells). The thick blue and green lines represent the oxygen consumption rate of ETNK1-WT and KO cells, respectively; the thin blue and green lines show the oxygen concentration in ETNK1-WT and KO oxygraph chambers, respectively. The diagonal cyan and pink stripes highlight, respectively, the difference in oxygen consumption rate and oxygen concentration of ETNK1-WT and KO cells. b Intracellular reactive oxygen species as assessed by confocal microscopy using the CellROX reagent. ROS analysis was performed in ETNK1-WT, N244S, and KO CRISPR lines in the absence and presence of P-Et 1 mM, tigecycline 2.5 µM and tigecycline 10 µM. Both the P-Et and the tigecycline treatments lasted 24 h. At least 200 cells were analyzed. The scale bar corresponds to 40 µm. c ROS quantification in ETNK1-WT, N244S, and KO CRISPR lines in the absence and presence of 1 mM P-Et. The boxplots delimit the interquartile range; the central bar represents the median; the whiskers extend from minimum to maximum (n = 5 representative fields). Statistical analyses were performed using one-way ANOVA with Tukey’s post-hoc test. d ROS quantification in ETNK1-WT, N244S, and KO CRISPR lines in the absence and presence of 2.5 and 10 µM tigecycline. The boxplots delimit the interquartile range; the central bar represents the median; the whiskers extend from minimum to maximum (n = 5 representative fields). Statistical analyses were performed using one-way ANOVA with Tukey’s post-hoc test. Source data are provided as a Source data file.
Fig. 4
Fig. 4. Oxoguanine analysis and 6-thioguanine resistance.
a Diagram showing the chemical reaction responsible for the generation of oxoG from G after exposure of gDNA to reactive oxygen species. b Scheme of the oxoG-mediated DNA damage. In the presence of the modified base, the gDNA may undergo two different destinies: either the base is excised, owing to the recruitment of the oxoG DNA glycosylase 1 (OGG1) repair machinery before the onset of a new replication cycle, or it causes the misincorporation of an adenine in the complementary strand, eventually leading to a G:C to T:A transversion. c Per-chromosome quantification of oxoG binned read counts in ETNK1-WT and N244S CRISPR lines following total read counts normalization; (n = 2). Statistical analysis was performed using a Wilcoxon matched-pairs signed rank test. d Mutation frequency assessed by 6-thioguanine assays in ETNK1-WT, N244S, and KO CRISPR lines in the absence or presence of 1 mM P-Et or 2.5 µM tigecycline (cell were pretreated for 15 days; 1 million of cells was plated and exposed to 30 μM of 6-TG for 15 days, while 1500 cells were plated for 15 days, as control). The boxplots delimit the interquartile range; the central bar represents the median; the whiskers extend from minimum to maximum (n = 3 independent experiments). Statistical analyses were performed using one-way ANOVA with Tukey’s post-hoc correction. Source data are provided as a Source data file.
Fig. 5
Fig. 5. Double-strand DNA damage.
a Confocal microscopy analysis of γH2AX foci in ETNK1-WT, N244S, and KO CRISPR lines in the absence or presence of 1 mM P-Et or 2.5 µM tigecycline for 24 h. At least 200 cells were analyzed. The scale bar corresponds to 40 µm. b Detail of γH2AX foci in individual ETNK1-WT and ETNK1-KO CRISPR cells. A total of 200 cells were analyzed for ETNK1 and KO lines. The Z-stack was processed to generate a 3D cell image in a total of five cells per type. The scale bar corresponds to 8 µm. c γH2AX signal quantification in ETNK1-WT, N244S, and KO CRISPR lines in the absence or presence of 1 mM P-Et or 2.5 µM tigecycline for 24 h. The boxplots delimit the interquartile range; the central bar represents the median; the whiskers extend from minimum to maximum (n = 5 representative fields). Statistical analyses were performed using one-way ANOVA with Tukey’s post-hoc test. d Anti-γH2AX western blot analysis on ETNK1-WT and ETNK1-KO CRISPR lysates in the absence and presence of 1 mM P-Et for 24 h. The analysis was performed in triplicate. Gel loading was normalized using actin. e Densitometric analysis of the western blot shown in panel d. Statistical analyses were performed using one-way ANOVA with Tukey’s post-hoc test. The boxplots delimit the interquartile range; the central bar represents the median; the whiskers extend from minimum to maximum (n = 3 biologically independent replicates). f Anti-γH2AX western blot analysis on ETNK1-WT (left; 4 cases) and ETNK1-mutated (right; 4 cases) aCML patient samples. Given the limited amount of primary samples, this blot was performed only once. Gel loading was normalized using total H3. g Densitometric analysis of the western blot shown in panel f (p < 0.0001). The signal represents corresponds to the mean, H3-normalized anti-γH2AX signal of ETNK1-WT and ETNK1-mutated aCML patients, respectively. The boxplots delimit the interquartile range; the central bar represents the median; the whiskers extend from minimum to maximum (n = 4 biologically independent samples). Statistical analysis was performed using a two-sided t-test. h Anti-γH2AX Western blot analysis on cell lysates from an ETNK1-mutated aCML bone marrow sample treated/non-treated with 1 mM P-Et for 24 h. Given the limited amount of primary samples, this blot was performed only once. i γH2AX signal quantification in bone marrow primary cells obtained from patient Pt 042 (ETNK1-N244S+) in the absence or presence of 1 mM P-Et. At least 200 cells were analyzed. The boxplots delimit the interquartile range; the central bar represents the median; the whiskers extend from minimum to maximum (n = 5 representative fields). Statistical analyses were performed using a two-sided t-test. Source data are provided as a Source data file.
Fig. 6
Fig. 6. Activity of mitochondria complexes I–IV.
ad Activity of ETNK1-WT mitochondria complexes I–IV in the presence of increasing concentrations of P-Et. The analysis of complexes I (n = 3 independent replicates), II (n = 3 independent replicates), and IV (n = 3 independent replicates) was performed on mitochondria lysates, while the analysis of complex III (n = 3 independent replicates) was performed on intact isolated mitochondria. The boxplots delimit the interquartile range; the central bar represents the median; the whiskers extend from minimum to maximum. Statistical analyses were performed using one-way ANOVA with Tukey’s post-hoc test a, b, d and two-sided t-test c. e The activity of the mitochondria complex II was assessed in the absence and presence of 20 µM P-Et in combination with increasing concentrations of succinate. The boxplots delimit the interquartile range; the central bar represents the median; the whiskers extend from minimum to maximum (n = 3 independent replicates). Statistical analyses were performed using one-way ANOVA with Tukey’s post-hoc test. f One of the best docking poses of P-Et onto the crystal structure of SDH (PDB: 1NEN) is shown. P-Et is represented in sticks colored by atom type. The protein is represented in cartoons colored according to secondary structure, i.e. helices, strands, and loops are, respectively, violet, yellow, and green. FAD and selected amino acid side chains in the catalytic site are represented in sticks colored by atom type. Succinate from the 1NEN complex is also shown in cyan sticks. Hydrogen atoms are shown only on P-Et. Source data are provided as a Source data file.
Fig. 7
Fig. 7. Diagram showing the proposed model for ETNK1 mutations.
Left panel: wild-type ETNK1 actively phosphorylates Et leading to the accumulation of P-Et, which in turn negatively modulates mitochondrial activity and ROS production through inhibition of SDH. Middle panel: in the presence of mutated ETNK1 the production of P-Et is impaired, which causes abnormal mitochondrial activation, increased ROS production and DNA damage. Right panel: treatment of ETNK1-mutated cells with exogenous P-Et leads to restoration of normal mitochondrial activity through suppression of SDH, normalization of ROS production and protection of DNA from ROS-mediated damage. Elements of the image were obtained from https://smart.servier.com/ under a Creative Commons Attribution 3.0 License.

References

    1. Kennedy EP, Weiss SB. The function of cytidine coenzymes in the biosynthesis of phospholipides. J. Biol. Chem. 1956;222:193–214. - PubMed
    1. Dawaliby R, et al. Phosphatidylethanolamine is a key regulator of membrane fluidity in eukaryotic cells. J. Biol. Chem. 2016;291:3658–3667. doi: 10.1074/jbc.M115.706523. - DOI - PMC - PubMed
    1. Birner R, Burgermeister M, Schneiter R, Daum G. Roles of phosphatidylethanolamine and of its several biosynthetic pathways in Saccharomyces cerevisiae. Mol. Biol. Cell. 2001;12:997–1007. doi: 10.1091/mbc.12.4.997. - DOI - PMC - PubMed
    1. Mileykovskaya E, Dowhan W. Role of membrane lipids in bacterial division-site selection. Curr. Opin. Microbiol. 2005;8:135–142. doi: 10.1016/j.mib.2005.02.012. - DOI - PubMed
    1. Steenbergen R, et al. Disruption of the phosphatidylserine decarboxylase gene in mice causes embryonic lethality and mitochondrial defects. J. Biol. Chem. 2005;280:40032–40040. doi: 10.1074/jbc.M506510200. - DOI - PMC - PubMed

Publication types

MeSH terms