. 2020 Nov 23;11(11):1004.
doi: 10.1038/s41419-020-03204-3.

Corticotropin-releasing hormone (CRH) alters mitochondrial morphology and function by activating the NF-kB-DRP1 axis in hippocampal neurons

Affiliations

Corticotropin-releasing hormone (CRH) alters mitochondrial morphology and function by activating the NF-kB-DRP1 axis in hippocampal neurons

Chiara R Battaglia et al. Cell Death Dis. .

Abstract

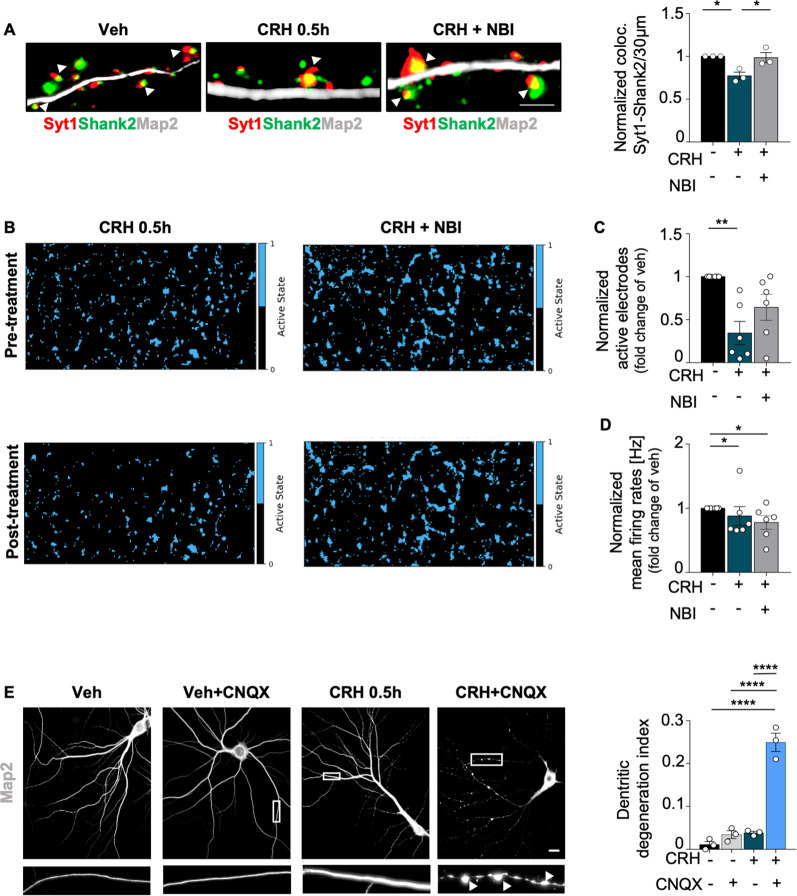
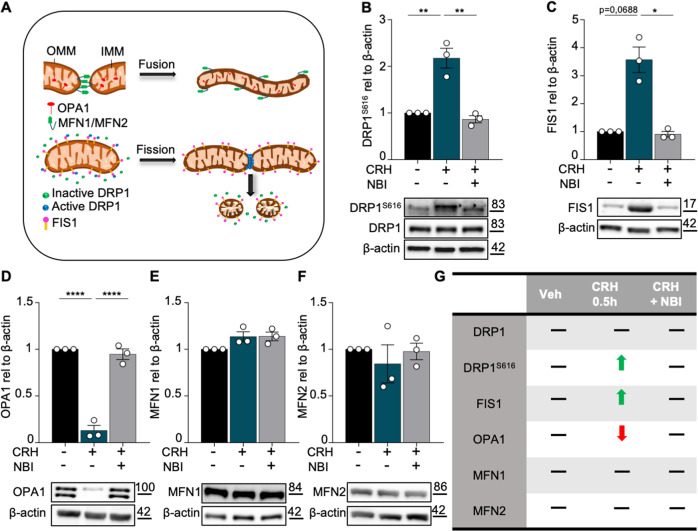
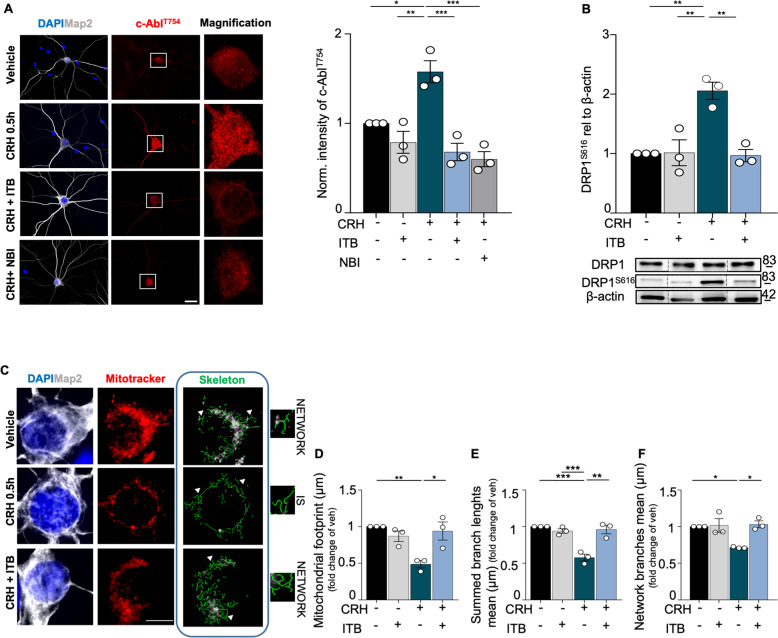
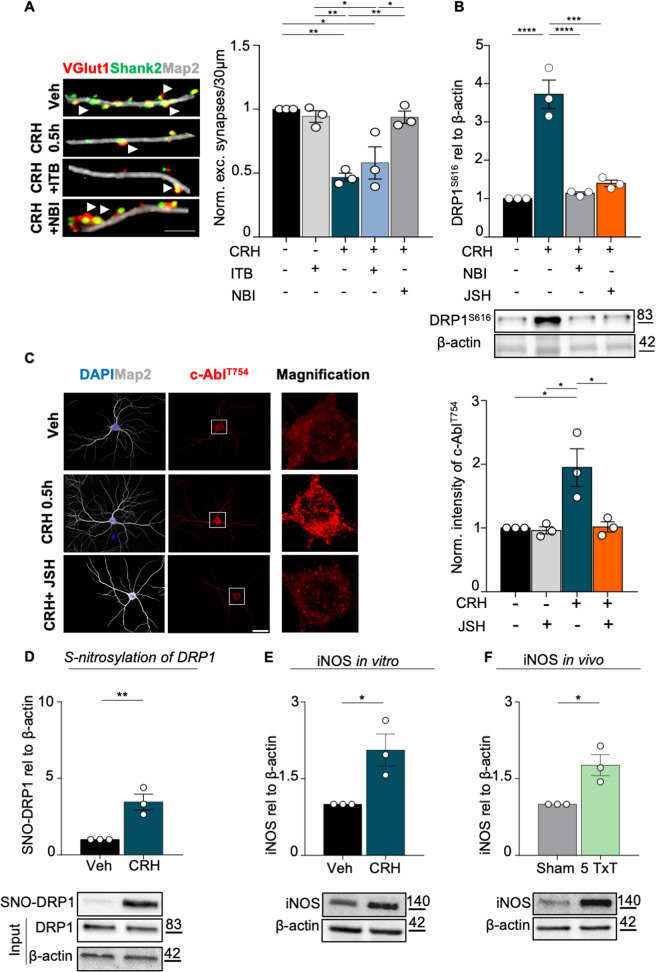
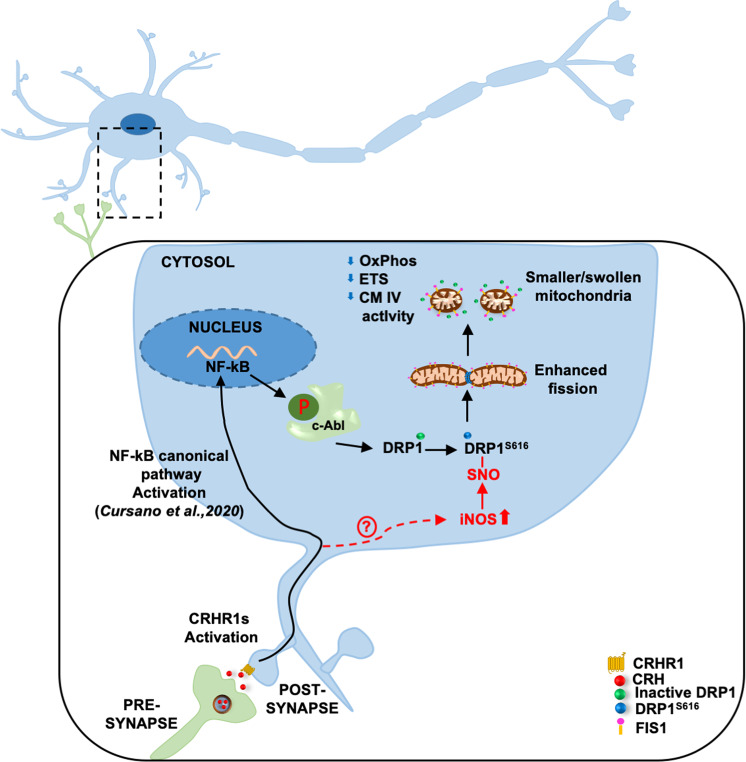
Neuronal stress-adaptation combines multiple molecular responses. We have previously reported that thorax trauma induces a transient loss of hippocampal excitatory synapses mediated by the local release of the stress-related hormone corticotropin-releasing hormone (CRH). Since a physiological synaptic activity relies also on mitochondrial functionality, we investigated the direct involvement of mitochondria in the (mal)-adaptive changes induced by the activation of neuronal CRH receptors 1 (CRHR1). We observed, in vivo and in vitro, a significant shift of mitochondrial dynamics towards fission, which correlated with increased swollen mitochondria and aberrant cristae. These morphological changes, which are associated with increased NF-kB activity and nitric oxide concentrations, correlated with a pronounced reduction of mitochondrial activity. However, ATP availability was unaltered, suggesting that neurons maintain a physiological energy metabolism to preserve them from apoptosis under CRH exposure. Our findings demonstrate that stress-induced CRHR1 activation leads to strong, but reversible, modifications of mitochondrial dynamics and morphology. These alterations are accompanied by bioenergetic defects and the reduction of neuronal activity, which are linked to increased intracellular oxidative stress, and to the activation of the NF-kB/c-Abl/DRP1 axis.


Conflict of interest statement

The authors declare that they have no conflict of interest.

Figures

Fig. 1
Fig. 1. Representative high-resolution respirometry recordings of primary hippocampal neurons.
The oxygen flux (JO2, red line) is calculated as the negative slope of the oxygen concentration (cO2, blue line) with time (x-axis), normalized for cell number, and corrected for oxygen back-diffusion. Red arrows indicate times of injection of substrates and inhibitors. A The protocol for the evaluation of OxPhos capacity, ETS capacity, and Complex IV activity includes the following steps (final chamber concentrations): co-injection of malate (2 mM) and glutamate (10 mM), ADP (4.5 mM) and pyruvate (5 mM), cytochrome c (10 µM) (test for mitochondrial outer membrane integrity) and succinate (10 mM, OxPhos-capacity), FCCP (0.5 mM, ETS-capacity), rotenone (0.5 µM) antimycin A (5 µM), co-injection of ascorbate (2 mM) and TMPD (0.5 mM), Na2S (40 µM) (Complex IV activity). B A slight modification of this protocol allowed to determine the O2 consumption related to ATP production (JO2ATP) in a separate series of experiments. This modification consisted of an additional injection of the ATP-synthase inhibitor oligomycin (2.5 μM) between succinate and FCCP. All other steps of the protocol were maintained unchanged. The JO2ATP was calculated as the JO2-difference before and after oligomycin.
Fig. 2
Fig. 2. Thorax trauma (TxT) mouse model shows mitochondrial fragmentation in the CA1 region of the hippocampus.
A IHC to detect somatic mitochondrial network complexity in hippocampal CA1 and CA3 regions using Cyt c (green) and DAPI (blu) (scale bar = 5 μm) in Sham and in mice 5 days after TxT (5 TxT); mitochondrial network mask panel shows each mitochondrial structure labeled by one different color. B Quantification of the number (#) of somatic mitochondrial networks with area: ≤10 μm2; between 10 and 200 μm2; ≥200 μm2 in the CA1 (stratum radiatum) and C CA3 (stratum lucidum) regions. Three ROIs, containing an average of 4 neurons (DAPI signal), were selected for each image and the surface of the mitochondrial network was detected (Cyt c signal) within the ROIs. D Representative electron microscopy (EM) images of CA1 somatic hippocampal mitochondria (Sham vs 5 TxT) (scale bar = 1 μm). All the mitochondria per field of view were considered. E Quantification of number (#) of mitochondria and F mitochondrial mean area/12.77 μm2 (μm2). G Mitochondrial shapes categories: mitochondria with a minor/major ratio ≤0.5 μm are rod-shaped; mitochondria with a minor/major ratio >0.5 μm are swollen-shaped; and H relative quantification. Experiments were performed in N = 3 independent replicates at DIV14. Data are displayed as Mean ± SEM; one-way ANOVA and Bonferroni’s post hoc comparison test, or exact Fisher´s test in H were performed (*p < 0.05, **p < 0.005, ***p < 0.0005, ****p < 0.0001).
Fig. 3
Fig. 3. CRH controls mitochondrial cristae remodeling, swelling and network complexity in primary hippocampal neurons.
A Schematic representation of mitochondrial structures: mitochondrial network (composed by two or more branches) and unbranched individual structures (IS). B Representative images of somatic mitochondrial network complexity, IHC for MAP2 (gray), mitochondria labeled with MitoTrackerTM (red), mitochondrial skeletonized structures (green) obtained with MiNa toolset (white arrowheads indicates examples of networks and IS) (scale bar = 5 μm) for all different experimental conditions (vehicle, CRH 100 nM 0.5 h and CRH 0.5 h + CRHR1 Blocker NBI30775 100 nM) and relative analysis: C mitochondrial footprint (μm), D summed branch lengths mean (μm) and E network branches mean (μm). F Cells were treated with CRH 100 nM for 0.5 h followed by Neurobasal Medium plus B27 for 2 h and 5 h. IHC for MAP2 (gray), mitochondria labeled with MitoTrackerTM (red), mitochondrial skeleton generated by Mitochondrial Network Analysis (MiNa) toolset (green) (white arrowheads indicates examples of networks and IS) (scale bar = 5 μm) and GI relative time-course analysis of the same parameters described above. Somatic mitochondrial networks were analyzed in six neurons for each condition for each different independent preparation. J Representative electron microscopy (EM) images of somatic hippocampal mitochondria for all different experimental conditions (vehicle, CRH 100 nM 0.5 h and 2 h; CRH 0.5 h + CRHR1 Blocker NBI30775 100 nM) (scale bar = 1 μm). TEM images showing mitochondrial cristae remodeling in treated neurons. All the mitochondria per field of view were considered. K Quantification of number (#) of mitochondria and L mitochondrial mean area/12.77 μm2 (μm2). M Percentage of rod, swollen and irregular mitochondria. N Percentage of well-defined cristae and aberrant cristae. Experiments were performed in = 3 independent replicates at DIV14. Data are displayed as Mean ± SEM; one-way ANOVA and Bonferroni’s post hoc comparison test were performed; data non normally distributed were analyzed by Kruskal–Wallis non parametric test followed by Uncorrected Dunn’s multiple comparison test. (*p < 0.05, **p < 0.005, ***p < 0.0005, ****p < 0.0001).
Fig. 4
Fig. 4. CRH alters mitochondrial respiratory activity.
Mitochondrial respiratory activity of CRH-treated primary neurons (100 nM CRH for 0.5, 2 h and CRH 0.5 h + CRHR1 Blocker NBI30775 100 nM) measured by high-resolution respirometry using the Oxygraph-2k(R) system (OROBOROS Instruments Corp., Innsbruck, Austria): A OxPhos, maximum oxidative phosphorylation in the coupled state with complex I and II substrates, pyruvate and ADP; B ETS, maximum mitochondrial respiratory activity after uncoupling with FCCP; C CM IV, uncoupled mitochondrial respiratory activity linked to complex IV upon inhibition of complex I by rotenone; D JO2ATP, the ATP production-related oxygen flux. Note that JO2 was normalized to the total cell number: pmol O2/(s*106 cells). Experiments were performed in N = 3–7 independent replicates at DIV14. JO2ATP experiments were performed in N = 4 independent replicates at DIV14. Data are displayed as Mean ± SEM; one-way ANOVA and Bonferroni’s post hoc comparison test were performed. (*p < 0.05, **p < 0.005, ***p < 0.0005, ****p < 0.0001).
Fig. 5
Fig. 5. Neuronal activity is reduced upon CRH treatment.
A IHC for MAP2 (gray), Shank2 (green) and Syt1 (red) in primary neurons treated with CRH 100 nM for 0.5 h and with CRH 0.5 h + CRHR1 Blocker NBI30775 100 nM and relative quantification of Syt1/Shank2 colocalization puncta; B representative images of Activity Scan Assay performed with MEA of the same cells before and after different treatments (CRH 100 nM for 0.5 h and with CRH 0.5 h + CRHR1 Blocker NBI30775 100 nM) and relative analysis of C active electrodes and D firing rates; E IHC for MAP2 (gray) in primary neurons after different experimental conditions using CNQX disodium salt (10 μM) (scale bar = 30 μm): vehicle, vehicle+CNQX, CRH 0.5 h, CRH 0.5 h + CNQX and relative quantification of the dendritic degeneration index. For the dendritic degeneration analysis, three different dendrites of three different neurons acquired from three different wells were analyzed for each condition in each independent experiment. All experiments were performed at DIV14. Synaptotagmin assay and dendritic degeneration experiments were performed in N = 3 independent replicates; MEA’s data were obtained from six wells for each treatment condition derived from two independent replicates. Data are displayed as Mean ± SEM; one-way ANOVA and Bonferroni’s post hoc comparison test were performed. Data non normally distributed were analyzed by Kruskal–Wallis non parametric test followed by Uncorrected Dunn’s multiple comparison test. (*p < 0.05, **p < 0.005, ***p < 0.0005, ****p < 0.0001).
Fig. 6
Fig. 6. CRH induces mitochondrial fission.
A Graphical representation of mitochondrial dynamic: fusion and fission with relative proteins (OMM = outer mitochondrial membrane; IMM = inner mitochondrial membrane). Primary hippocampal neurons at DIV14 were treated with CRH 100 nM for 0.5 h and with CRH 0.5 h + CRHR1 Blocker NBI30775 100 nM; Western Blot analysis and quantification of B the fission proteins DRP1S616, C FIS1 and the fusion markers D OPA1, E MFN1 and F MFN2. G Summary of the western blot results. Experiments were performed in N = 3 independent replicates at DIV14. Data are displayed as Mean ± SEM; one-way ANOVA and Bonferroni’s post hoc comparison test were performed; data non normally distributed were analyzed by Kruskal–Wallis non parametric test followed by Uncorrected Dunn’s multiple comparison test. (*p < 0.05, **p < 0.005, ***p < 0.0005, ****p < 0.0001).
Fig. 7
Fig. 7. CRH-dependent c-Abl activation leads to mitochondrial fission, inducing mitochondrial network fragmentation.
A IHC for MAP2 (gray) and c-AblT754 (red) in primary hippocampal neurons after different experimental conditions using IMATINIB (ITB), a selective c-Abl blocker (scale bar = 30 μm): vehicle, vehicle + ITB 3 μM, CRH 100 nM for 0.5 h, CRH 100 nM + ITB 3 μM and CRH 100 nM + CRHR1 Blocker NBI30775 100 nM with relative c-AblT754 intensity analysis. Nine different neurons acquired from three different wells were analyzed for each condition in each independent experiment. B WB analysis and quantification of DRP1S616 expression. C Somatic mitochondrial network complexity analysis after IHC, using the same experimental conditions (scale bar = 5 μm): MAP2 (gray), mitochondria labeled with MitoTrackerTM (red), mitochondrial skeletonized structures (green) (white arrows indicates examples of networks and IS) and DF relative network parameters quantification. Somatic mitochondrial networks were analyzed in six neurons for each condition for each different independent preparation. Experiments were performed in N = 3 independent replicates at DIV14. Data are displayed as Mean ± SEM; one-way ANOVA and Bonferroni’s post hoc comparison test were performed; data non normally distributed were analyzed by Kruskal–Wallis non parametric test followed by Uncorrected Dunn’s multiple comparison test. (*p < 0.05, **p < 0.005, ***p < 0.0005, ****p < 0.0001).
Fig. 8
Fig. 8. CRH-c-Abl dependent mitochondrial fission requires NF-kB activity.
A IHC for MAP2 (gray), VGlut1 (red) Shank2 (green) after different treatments (scale bar = 5 μm). White arrowheads indicate the co-localization between VGlut1 and Shank2. Quantification of excitatory synapses number (co-localization of Shank2/Vglut1/30μm of dendrites). Three different dendrites of three different neurons acquired from three different wells were analyzed for each condition in each independent experiment. B WB analysis of DRP1S616 expression, blocking the NF-κB pathway with the nuclear translocation blocker JSH-23. C IHC for MAP2 (gray) and c-AblT754 (red) in primary neurons after different experimental conditions using JSH-23 (scale bar = 30 μm): vehicle, vehicle + JSH 10 μM, CRH 100 nM for 0.5 h, CRH 100 nM + JSH 10 μM with relative c-AblT754 intensity analysis. Nine different neurons acquired from three different wells were analyzed for each condition in each independent experiment. Representative western blot and relative quantification of: D S-nitrosylation levels of DRP1 and E of iNOS expression following CRH treatment; F iNOS expression levels in 5 Txt mice. Experiments were performed in N = 3 independent replicates at DIV14. Data are displayed as Mean ± SEM; one-way ANOVA and Bonferroni’s post hoc comparison test were performed (*p < 0.05, **p < 0.005, ***p < 0.0005, ****p < 0.0001).
Fig. 9
Fig. 9. Schematic representation of the proposed molecular mechanism.
CRHR1 activation triggers a signaling cascade leading to the activation of Nf-KB and increased iNOS activity. This eventually leads to increased phospshporylation and nytrosilation of DRP1, which drives the morphological and bioenergetics alterations of mitochondria upon CRH exposure.

References

    1. Kann O, Kovacs R. Mitochondria and neuronal activity. Am. J. Physiol. Cell Physiol. 2007;292:C641–C657. doi: 10.1152/ajpcell.00222.2006. - DOI - PubMed
    1. Szabadkai G, Duchen MR. Mitochondria: the hub of cellular Ca2+ signaling. Physiology. 2008;23:84–94. doi: 10.1152/physiol.00046.2007. - DOI - PubMed
    1. Duchen MR, Surin A, Jacobson J. Imaging mitochondrial function in intact cells. Methods Enzymol. 2003;361:353–389. doi: 10.1016/S0076-6879(03)61019-0. - DOI - PubMed
    1. Chang DT, Honick AS, Reynolds IJ. Mitochondrial trafficking to synapses in cultured primary cortical neurons. J. Neurosci. 2006;26:7035–7045. doi: 10.1523/JNEUROSCI.1012-06.2006. - DOI - PMC - PubMed
    1. Liesa M, Palacin M, Zorzano A. Mitochondrial dynamics in mammalian health and disease. Physiol. Rev. 2009;89:799–845. doi: 10.1152/physrev.00030.2008. - DOI - PubMed

Publication types