. 2020 Nov 23;10(1):20369.
doi: 10.1038/s41598-020-77334-1.

Long-term efficacy of BCG vaccination in goat herds with a high prevalence of tuberculosis

Affiliations

Long-term efficacy of BCG vaccination in goat herds with a high prevalence of tuberculosis

Claudia Arrieta-Villegas et al. Sci Rep. .

Abstract

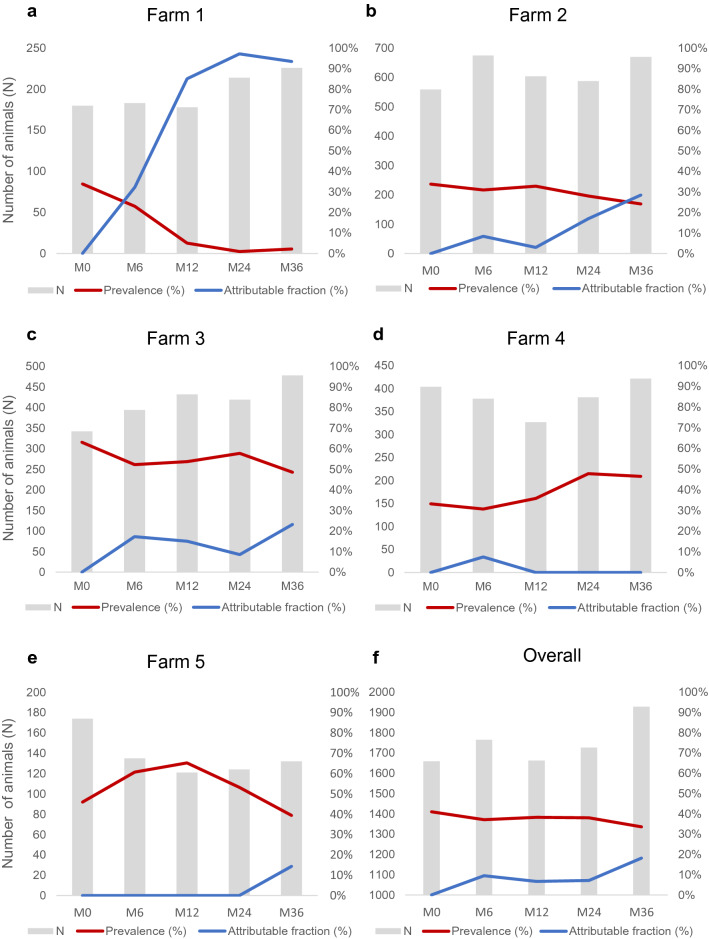
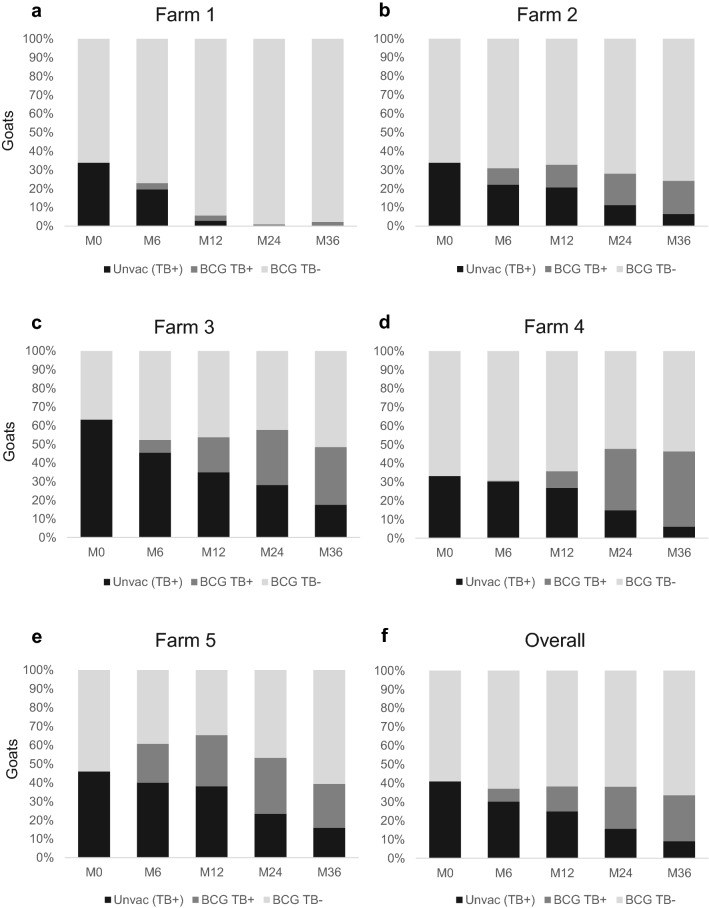
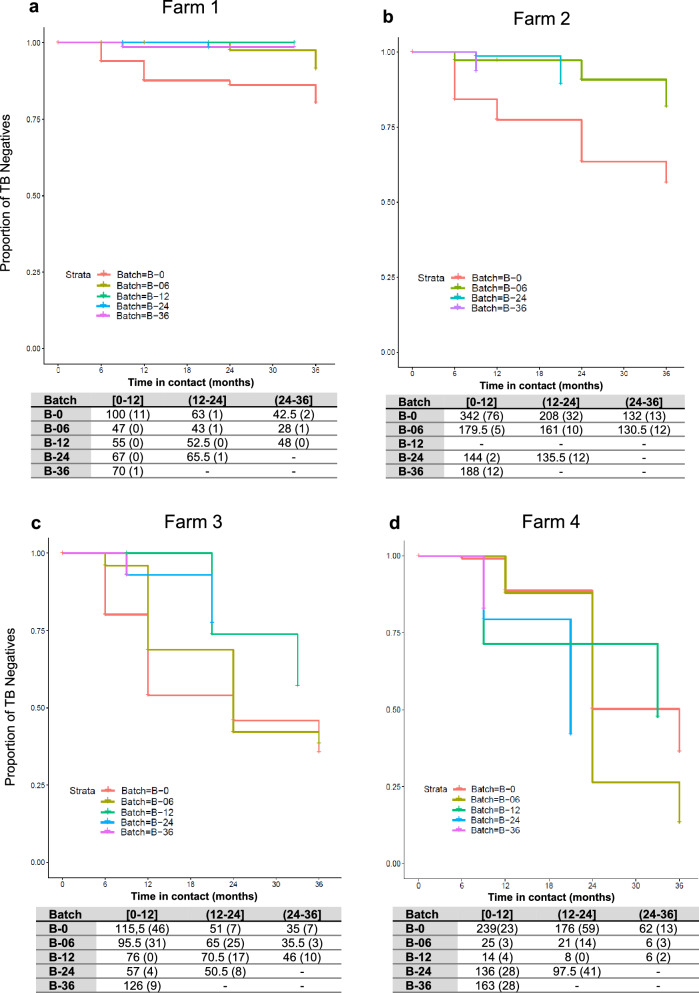
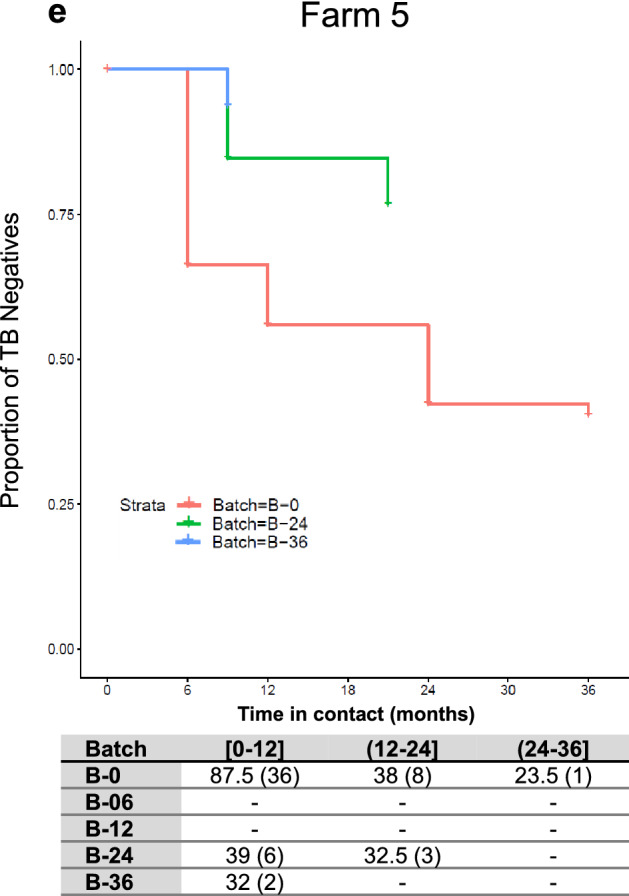
Vaccination of goats against tuberculosis (TB) has been promoted as an ancillary tool for controlling the disease in infected livestock herds. A three-year trial to assess the efficacy of BCG vaccine was carried out in five goat herds. At the beginning of the trial (month 0), all animals were tested for TB using thee different diagnostic tests. Animals negative to all tests were vaccinated with BCG and all replacement goat kids were also systematically vaccinated throughout the trial. All animals were tested by Interferon-gamma release assay (IGRA) using vaccine compatible reagents at months 6, 12, 24, and 36. The risk factors for TB infection were also evaluated. At the end of the study, four out of five farms showed variable reductions of the initial prevalence (93.5%, 28.5%, 23.2%, and 14.3% respectively), and an overall incidence reduction of 50% was observed in BCG vaccinated goats, although adult vaccinated goats showed higher incidences than vaccinated goat kids. The unvaccinated positive animals remaining in herds and adult BCG vaccinated goats significantly enhanced the risk of infection in vaccinated animals. A systematic vaccination of goats with BCG, together with the removal of positive unvaccinated animals, may contribute to reducing the TB prevalence in goat herds.


Conflict of interest statement

The authors declare no competing interests.

Figures

Figure 1
Figure 1
Evolution of prevalence throughout the BCG vaccination trial. Evolution of census (grey bars), prevalence (red lines) and percentage of prevalence reduction (blue lines) in farms 1 (a), 2 (b), 3 (c), 4 (d) and 5 (e), and overall reduction of five farms (f). The prevalence was measured as the percentage (%) of TB positive animals = number of TB positive goats / total census. The reduction of prevalence was measured as attributable fraction (AF) = (% of TB positive at M0—% of TB positive at M6 or M12 or M24 or M36) / % of TB positive at M0.
Figure 2
Figure 2
Proportion of TB positive and BCG vaccinated goats from farms 1 (a), 2 (b), 3 (c), 4 (d), 5 (e) and all farms (f) throughout the trial. Evolution of population of vaccinated goats TB negative (light grey), vaccinated TB positive goats (dark grey) and unvaccinated animals (black) during the 36 months (M) of trial.
Figure 3
Figure 3
TB Incidence in BCG vaccinated batches from farms 1 (a), 2 (b), 3 (c), 4 (d) and 5 (e) throughout the trial. Proportion of TB negative animals (y axis) throughout the time in contact (x axis) with the TB positive herd in months. The table represents the incidence of TB in each batch (B) depending on the time in contact, between 0 and 12 months ([0–12]), more than 12–24 months ((12–24]) and more than 24–36 months ((24–36]). The animals at risk, which were the TB negative animals between sampling time points (some animals were slaughtered or died between periods. Those animals were considered present during the half of the period and its number was divided by two). In parenthesis are represented the number of TB new positive goats during a given period.
Figure 3
Figure 3
TB Incidence in BCG vaccinated batches from farms 1 (a), 2 (b), 3 (c), 4 (d) and 5 (e) throughout the trial. Proportion of TB negative animals (y axis) throughout the time in contact (x axis) with the TB positive herd in months. The table represents the incidence of TB in each batch (B) depending on the time in contact, between 0 and 12 months ([0–12]), more than 12–24 months ((12–24]) and more than 24–36 months ((24–36]). The animals at risk, which were the TB negative animals between sampling time points (some animals were slaughtered or died between periods. Those animals were considered present during the half of the period and its number was divided by two). In parenthesis are represented the number of TB new positive goats during a given period.

Similar articles

Cited by

References

    1. Aranaz A, Cousins D, Mateos A, Domínguez L. Elevation of Mycobacterium tuberculosis subsp. caprae Aranaz et al. 1999 to species rank as Mycobacterium caprae comb. Nov., sp nov. Int. J. Syst. Evol. Microbiol. 2003;53:1785–1789. doi: 10.1099/ijs.0.02532-0. - DOI - PubMed
    1. Rodríguez S, et al. Mycobacterium caprae infection in livestock and wildlife, Spain. Emerg. Infect. Dis. 2011;17:532–535. doi: 10.3201/eid1703.100618. - DOI - PMC - PubMed
    1. Crawshaw T, et al. TB in goats caused by Mycobacterium bovis. Vet. Rec. 2008;163:127. doi: 10.1136/vr.163.4.127. - DOI - PubMed
    1. Napp S, et al. Evidence of goats acting as domestic reservoirs of bovine tuberculosis. Vet. Rec. 2013;172:663. doi: 10.1136/vr.101347. - DOI - PubMed
    1. Vidal E, et al. Transmission of tuberculosis caused by Mycobacterium caprae between dairy sheep and goats. Small Rumin. Res. 2018;158:22–25. doi: 10.1016/j.smallrumres.2017.11.010. - DOI

Publication types

MeSH terms