. 2020 Nov 23;11(1):5950.
doi: 10.1038/s41467-020-19786-7.

TDP-43 interacts with amyloid-β, inhibits fibrillization, and worsens pathology in a model of Alzheimer's disease

Affiliations

TDP-43 interacts with amyloid-β, inhibits fibrillization, and worsens pathology in a model of Alzheimer's disease

Yao-Hsiang Shih et al. Nat Commun. .

Abstract

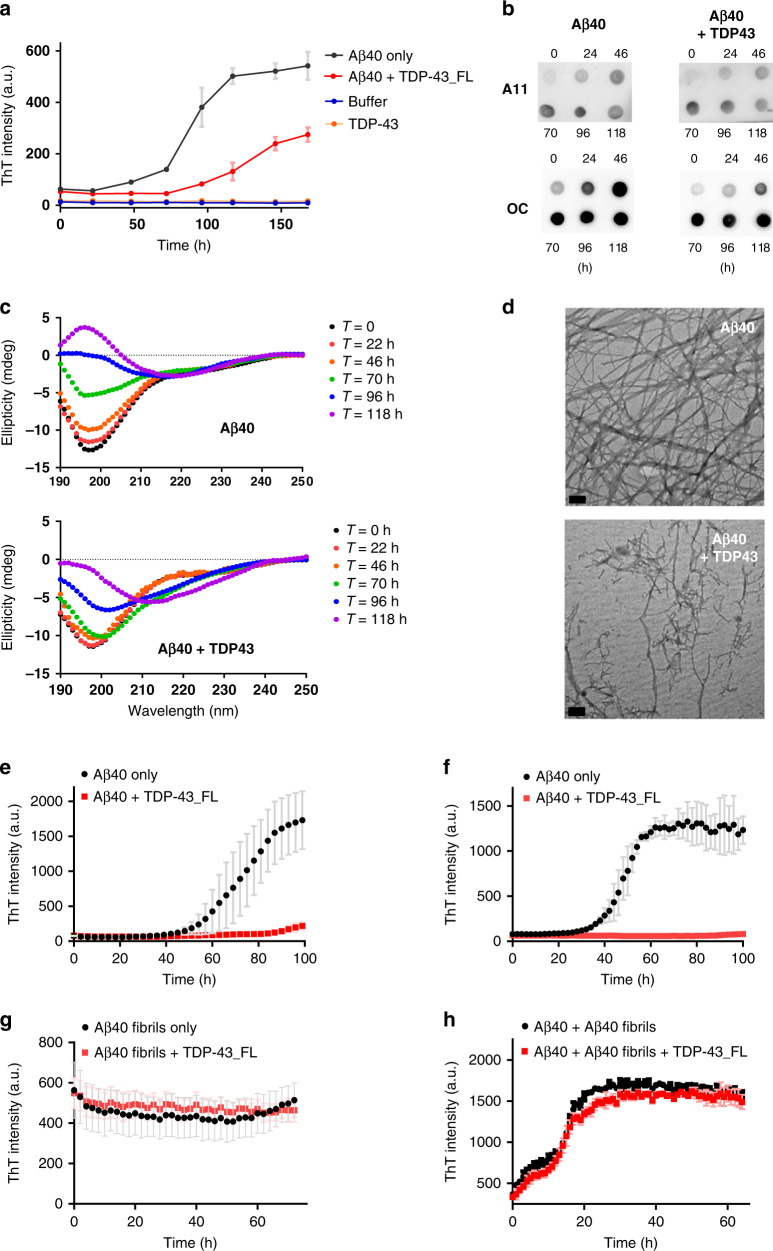
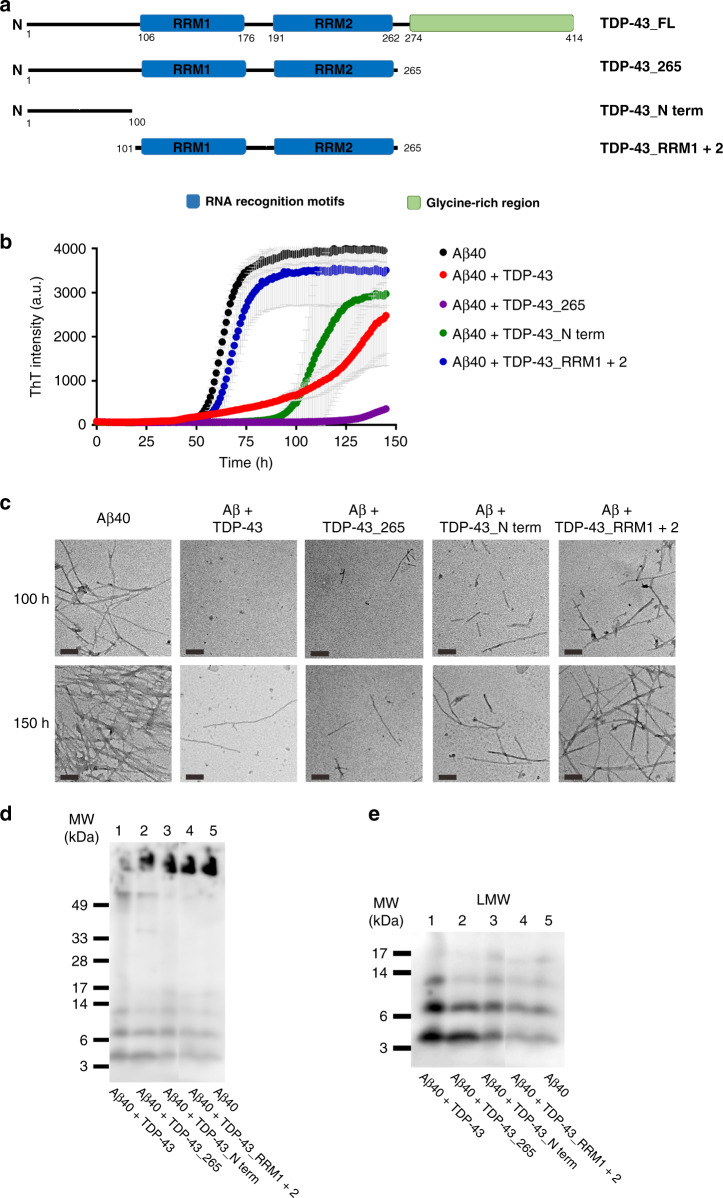
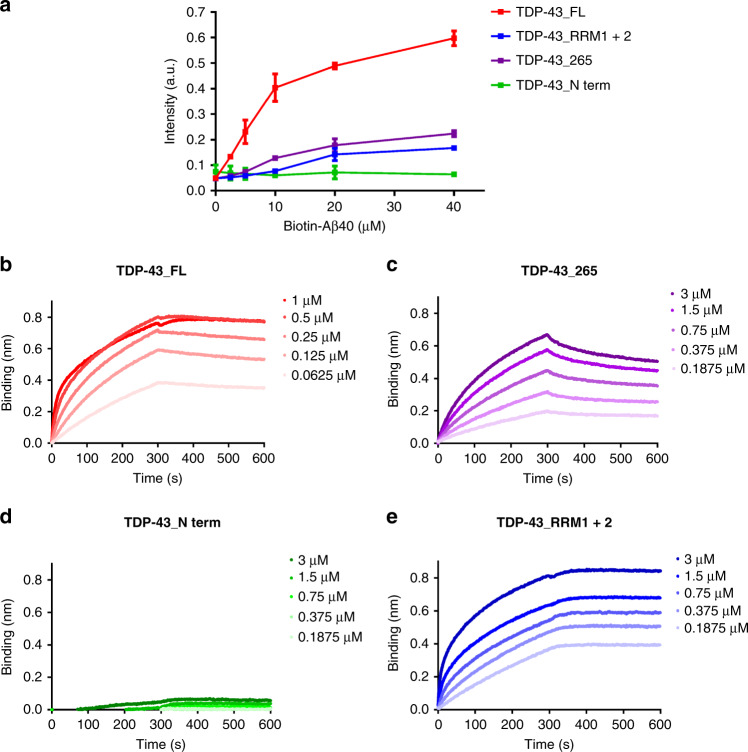
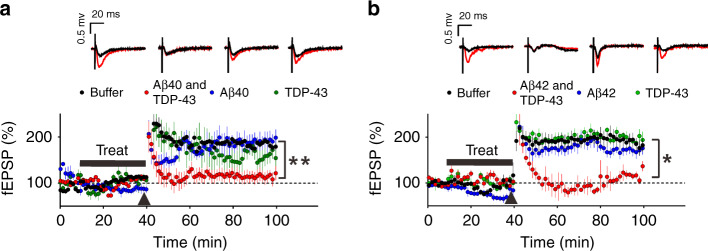
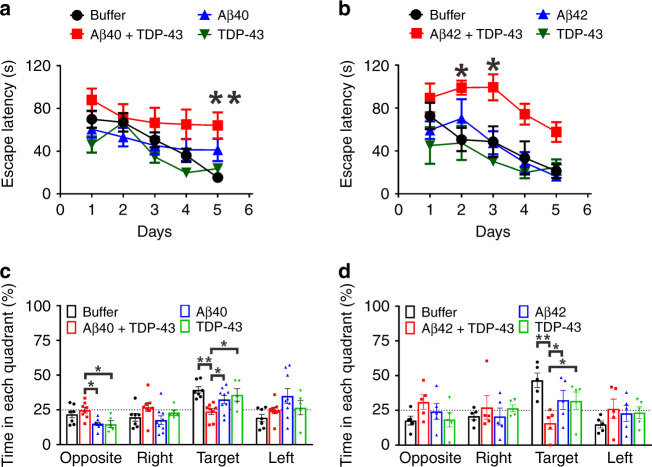
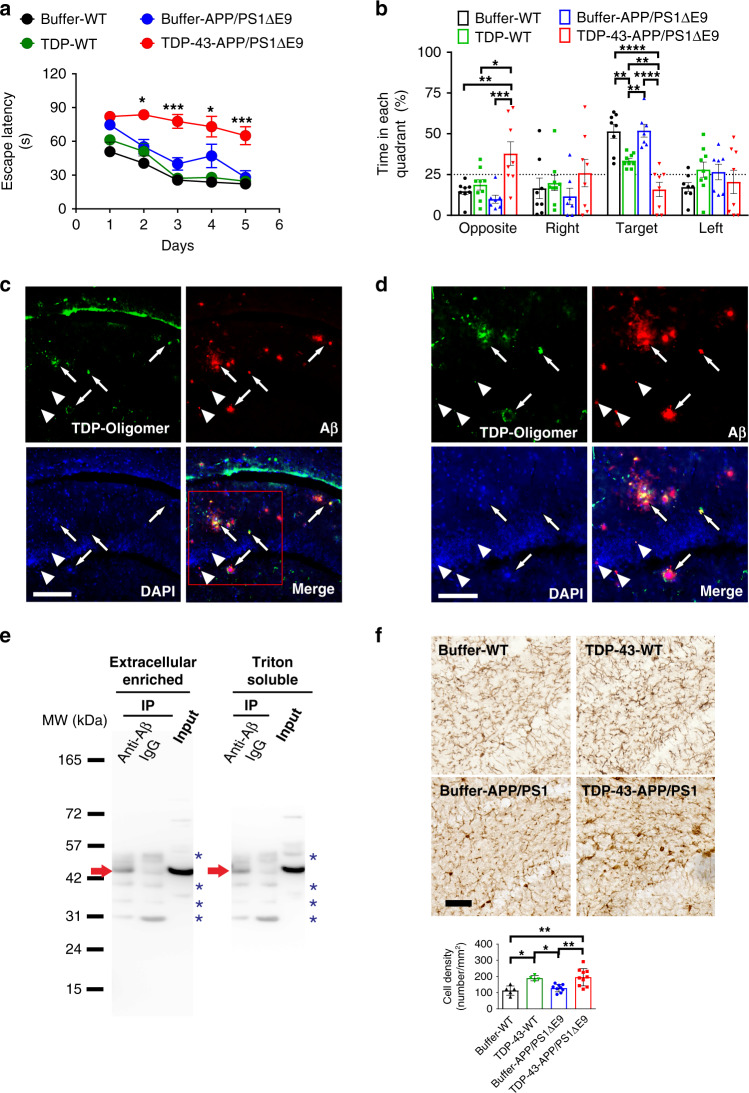
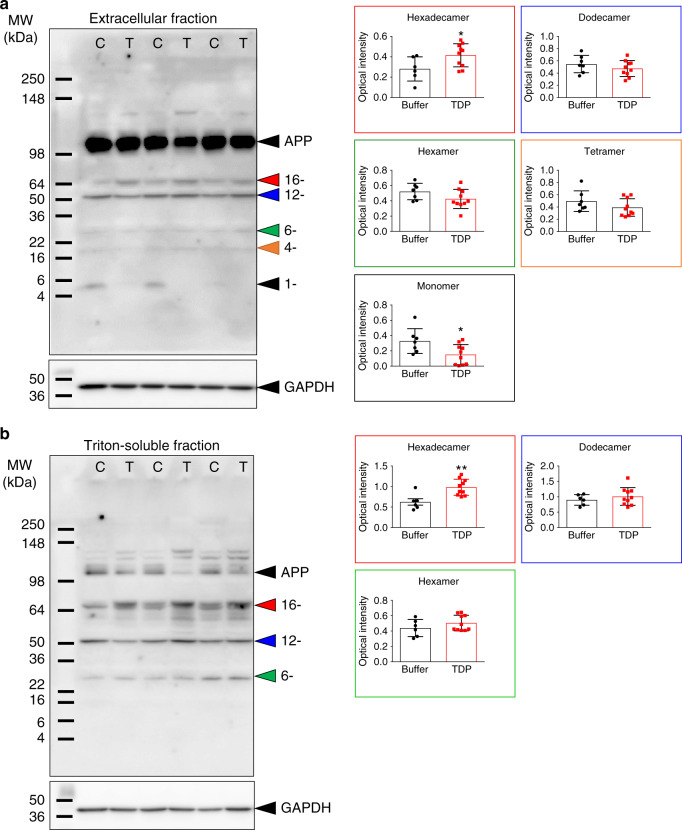
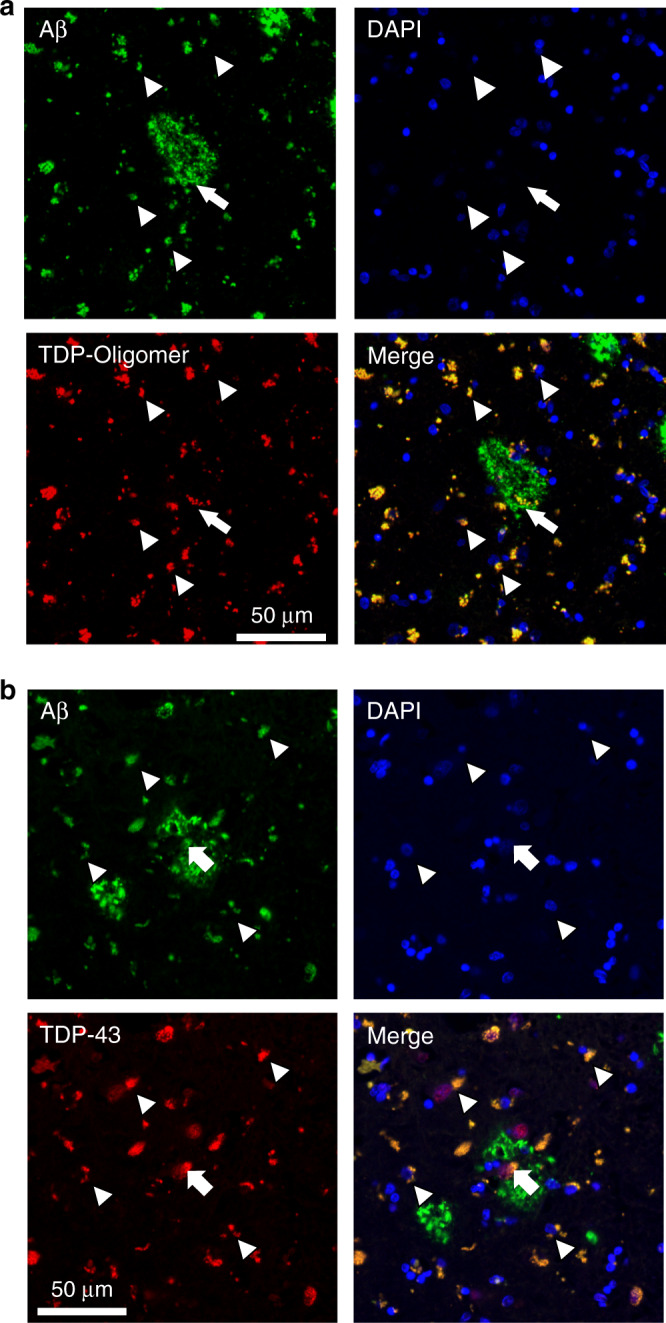
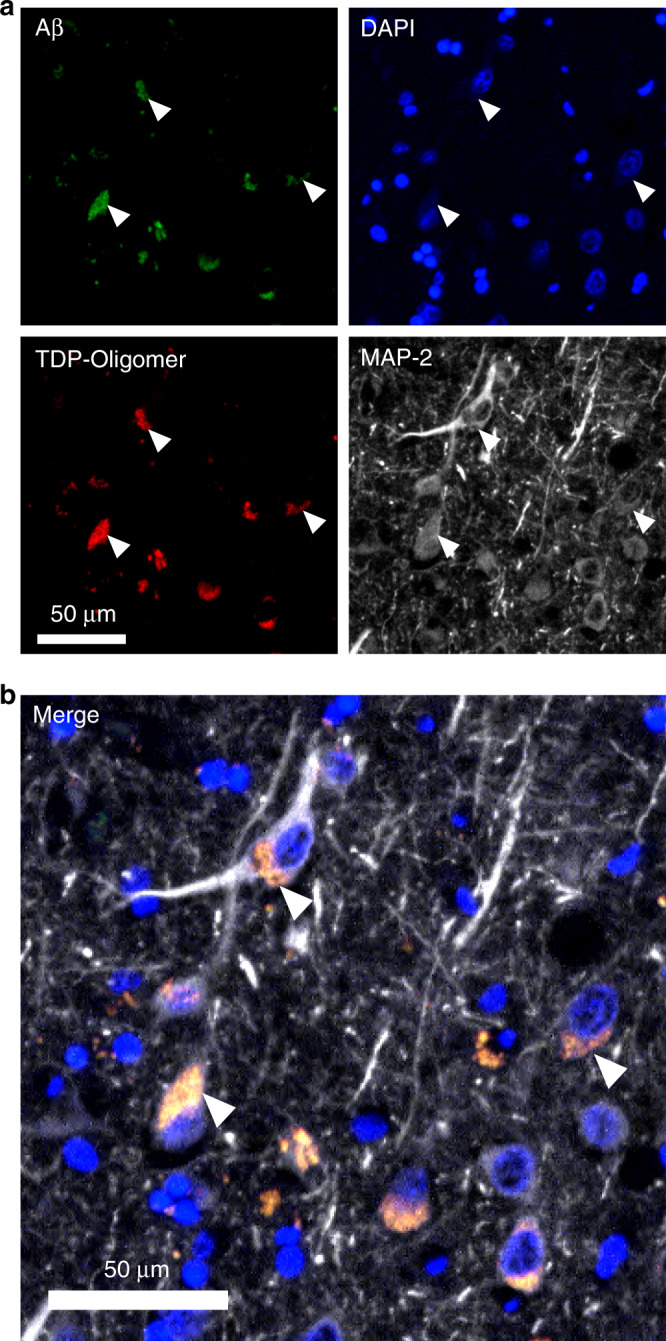
TDP-43 inclusions are found in many Alzheimer's disease (AD) patients presenting faster disease progression and greater brain atrophy. Previously, we showed full-length TDP-43 forms spherical oligomers and perturbs amyloid-β (Aβ) fibrillization. To elucidate the role of TDP-43 in AD, here, we examined the effect of TDP-43 in Aβ aggregation and the attributed toxicity in mouse models. We found TDP-43 inhibited Aβ fibrillization at initial and oligomeric stages. Aβ fibrillization was delayed specifically in the presence of N-terminal domain containing TDP-43 variants, while C-terminal TDP-43 was not essential for Aβ interaction. TDP-43 significantly enhanced Aβ's ability to impair long-term potentiation and, upon intrahippocampal injection, caused spatial memory deficit. Following injection to AD transgenic mice, TDP-43 induced inflammation, interacted with Aβ, and exacerbated AD-like pathology. TDP-43 oligomers mostly colocalized with intracellular Aβ in the brain of AD patients. We conclude that TDP-43 inhibits Aβ fibrillization through its interaction with Aβ and exacerbates AD pathology.


Conflict of interest statement

The authors declare no competing interests.

Figures

Fig. 1
Fig. 1. TDP-43 inhibits Aβ fibrillization at initial and oligomer stages of Aβ.
a Fibrillization kinetics of Aβ40 (black) and Aβ40 with TDP-43 (red) monitored by ThT assay in 10 mM Tris buffer, pH 8.0. TDP-43 alone (orange) and buffer alone (blue) are also shown. The averaged data from three replicates and standard deviations are plotted. Aβ40 concentration was 25 μM and TDP-43 concentration was 0.25 μM. b Dot blotting of the time point samples by anti-amyloid oligomers A11 antibody and anti-amyloid fibrils OC antibody. c Far-UV CD spectra of Aβ40 in the absence and presence of TDP-43_FL after 0 (black), 22 (red), 46 (orange), 70 (green), 96 (blue), and 118 (purple) h incubation. The buffer control and TDP-43 background were subtracted. d TEM images of the end-point product of Aβ40 alone in ThT assay, and the end-point product of Aβ40 with TDP-43. The scale bars are 100 nm. Two times of independent experiments were performed. eh Fibrillization kinetics of Aβ40 from different stages with and without full-length TDP-43. Aβ40 monomer (e), Aβ40 oligomers (f), Aβ40 fibrils (g), and Aβ40 monomer in the presence of 10% fibril seeds (h) were incubated with (red) and without full-length TDP-43 (black) and monitored by ThT assay in 10 mM Tris buffer, pH 8.0. Aβ40 concentration was 25 μM, and TDP-43 concentration was 0.25 μM. Aβ fibril seeds were prepared from sonicated Aβ40 fibrils at 25 μM. The averaged data from three replicates and standard deviations are plotted. Source data are provided as a Source Data file.
Fig. 2
Fig. 2. Truncated TDP-43 variants inhibit Aβ fibrillization.
a Illustration of the structural motifs of TDP-43. Full-length TDP-43 contains an N-terminal domain, two RNA recognition motifs (RRM1 and RRM2), and a glycine-rich region in its C-terminus. The constructs used in the study are shown. They are full-length TDP-43, TDP-43 aa 1–265 (TDP-43_265), TDP-43 aa 101-265 (TDP-43_RRM1 + 2), and TDP-43 aa 1–100 (TDP-43_N-term). b ThT assays of Aβ fibrillization (black) and with TDP-43 variants (TDP-43_FL, red; TDP-43_265, purple; TDP-43_N-term, green; TDP-43_RRM1 + 2, blue) in 10 mM Tris buffer, pH 8.0. Aβ40 concentration was 25 μM, and TDP-43 concentration was 0.25 μM. The averaged data from three replicates and standard deviations are plotted. c TEM images of Aβ species with and without TDP-43 proteins. Two incubation time points, 100 h and 150 h were chosen for examination. The samples were loaded on SDS-PAGE d and then probed by anti-Aβ antibody, 6E10 to show the relative amounts of Aβ40 amyloid fibrils. Two times of independent experiments were performed. e The enlarged area of Fig. 2d shows a clear band distribution of low-molecular-weight Aβ species. Source data are provided as a Source Data file.
Fig. 3
Fig. 3. Interaction of TDP-43 variants and Aβ.
a Interaction of Aβ with TDP-43 variants was determined by ELISA. TDP-43 proteins were coated and detected by different concentrations of biotinylated Aβ. The averaged data from three replicates and standard deviations are plotted (TDP-43_FL, red; TDP-43_265, purple; TDP-43_N-term, green; TDP-43_RRM1 + 2, blue). be Binding response between Aβ40 and TDP-43 variants in biolayer interferometry analysis. TDP-43 at different concentrations (μM) were prepared and subjected to biolayer interferometry analysis by using Octet RED96 System (Pall ForeBio). The real-time binding response (nm) was measured in seconds. The loading amounts of Aβ40 are the same for all the experiments. Source data are provided as a Source Data file.
Fig. 4
Fig. 4. TDP-43-induced Aβ species impairs the hippocampus LTP.
Field EPSPs (fEPSPs) were measured from a Schaffer collateral fiber on a hippocampal slice from C57BL/6 mice. After the recording was stabilized for 10 min, the slices were treated with buffer, Aβ with TDP-43, Aβ alone, or TDP-43 alone for 30 min. After the treatment, the hippocampal slices were subjected to a theta burst stimulation (black arrowhead) to induce LTP. Scale bar, 0.5 mv, 20 ms. The averaged data and s.e.m. are plotted and colored for buffer control (black), Aβ and TDP-43 (red), Aβ (blue), and TDP-43 (green). Each group of fEPSPs before (black line) and after (red line) the theta burst stimulation is shown individually in the upper panel. a For Aβ40 analysis, Aβ40 at 1 µM and TDP-43 at 10 nM were used. The slices were treated with buffer (n = 4 independent slices), Aβ40 with TDP-43 (n = 3, independent slices), Aβ40 alone (n = 4, independent slices), or TDP-43 alone (n = 4, independent slices). TDP-43 + Aβ40 vs. buffer; repeated two-way ANOVA, p = 0.0032, **p < 0.01. b For Aβ42 analysis, Aβ42 at 62.5 nM and TDP-43 at 0.625 nM were used. The slices were treated with buffer (n = 9 independent slices), Aβ42 with TDP-43 (n = 4, independent slices), Aβ42 alone (n = 5, independent slices), or TDP-43 alone (n = 5, independent slices). TDP-43 + Aβ42 vs. buffer; repeated two-way ANOVA, p = 0.0232, *p < 0.05. Source data are provided as a Source Data file.
Fig. 5
Fig. 5. TDP-43-induced Aβ species impairs hippocampus-related spatial memory to a greater degree than Aβ or TDP-43 alone does in the injected mouse model.
WT mice at the age of 5-month were intracranially injected with the samples from the aggregation assays. Aβ, TDP-43, Aβ with TDP-43, and buffer obtained from the aggregation reaction were used. Spatial learning and memory functions were inspected by MWM 1 month after injection. Escape latency is defined as the time at which the hidden platform is found. The data were colored for buffer control (black), Aβ and TDP-43 (red), Aβ (blue), and TDP-43 (green). a Training phase for Aβ40. The sample sizes for buffer, Aβ40 with TDP-43, Aβ40, and TDP-43 are 7, 8, 9, and 5, respectively. The averaged data and s.e.m. are plotted. The statistical analysis was performed by repeated two-way ANOVA and Bonferroni’s post-hoc test, **p < 0.01 (Buffer vs. Aβ40 + TDP-43 at day 5, p = 0.0048). b Training phase for Aβ42. The sample size for buffer, Aβ42 with TDP-43, Aβ42, and TDP-43 are 5, 4, 4, and 5, respectively. The averaged data and s.e.m. are plotted. The statistical analysis was performed by repeated two-way ANOVA and Bonferroni’s post-hoc test, *p < 0.05 (Buffer vs. Aβ42 + TDP-43 at day 2, p = 0.0174; Buffer vs. Aβ42 + TDP-43 at day 3, p = 0.0112). c Probe test for Aβ40. The time in each quadrant were calculated in percentage. The averaged data and s.e.m. are plotted. The statistical analysis was performed by one-way ANOVA, Holm-Sidak’s multiple comparisons, *p < 0.05, **p < 0.01 (In the opposite quadrant: Aβ40 + TDP-43 vs. Aβ40, p = 0.0147; Aβ40 + TDP-43 vs. TDP-43, p = 0.038; In the target quadrant, Buffer vs. Aβ40 + TDP-43, p = 0.002; Aβ40 + TDP-43 vs. Aβ40, p = 0.0425; Aβ40 + TDP-43 vs. TDP-43, p = 0.0289). d Probe test for Aβ42. The averaged data and s.e.m. are plotted. The statistical analysis was performed by one-way ANOVA, Holm-Sidak’s multiple comparisons, *p < 0.05, **p < 0.01 (In the target quadrant: Buffer vs. Aβ42 + TDP-43, p = 0.0019; Aβ42 + TDP-43 vs. Aβ42, p = 0.0311; Aβ42 + TDP-43 vs. TDP-43, p = 0.0311). Source data are provided as a Source Data file.
Fig. 6
Fig. 6. TDP-43 impairs spatial memory, colocalizes and interacts with Aβ, and increases microgliosis in APP/PS1ΔE9 mice.
a, b The spatial learning and memory function of APP/PS1ΔE9 mice were inspected via MWM. The training phase (a) and probe test (b) are shown (buffer, n = 6, TDP-43, n = 8). a For the training phase, the averaged data and s.e.m. are plotted. The data were colored for buffer-injected WT mice (black), TDP-43-injected WT mice (green), buffer-injected APP/PS1∆E9 mice (blue), and TDP-43-injected APP/PS1∆E9 mice (red). Statistical analysis was performed via repeated two-way ANOVA with Bonferroni’s post-hoc test, *p < 0.05, ***p < 0.001 (Buffer-APP/PS1ΔE9 vs. TDP-43-APP/PS1ΔE9 at day 2, p = 0.0190; at day 3, p = 0.0002; at day 4, p = 0.0135; at day 5, p = 0.0002). b For the probe test, the average data and s.e.m. are plotted. Statistical analysis was conducted with one-way ANOVA, Holm-Sidak’s multiple comparisons, *p < 0.05, **p < 0.01, ***p < 0.001, ****p < 0.0001 (In the opposite quadrant, Buffer-WT vs. TDP-43-APP/PS1ΔE9, p = 0.0036; TDP-WT vs. TDP-43-APP/PS1ΔE9, p = 0.0122; Buffer-APP/PS1ΔE9 vs. TDP-43-APP/PS1ΔE9, p = 0.0008; In the target quadrant: Buffer-WT vs. TDP-43-WT, p = 0.0046; Buffer-APP/PS1ΔE9 vs. TDP-43-APP/PS1ΔE9, p < 0.0001; TDP-WT vs. TDP-43-APP/PS1ΔE9, p = 0.0046; buffer-WT vs. TDP-43-APP/PS1ΔE9, p < 0.0001; TDP-WT vs. buffer-APP/PS1ΔE9, p = 0.0046). c Representative immunostaining micrographs in the hippocampus dentate gyrus show that TDP-43 oligomers colocalized with Aβ plaque (arrows) and intraneuronal Aβ (arrowhead; scale bar, 150 μm). Three induvial animals in each group were examined. d The enlarged view of the rectangle in 6c (scale bar, 100 μm). e Representative IP result of Aβ and TDP-43 in the brain fractions of APP/PS1ΔE9 mice injected with TDP-43. Extracellular-enriched and Triton-soluble brain fractions were used. IP was performed using Aβ antibodies and detected by TDP-43 antibodies. Immunoprecipitated TDP-43 was indicated by red arrows and nonspecific bands were indicated by blue asterisks. Four independent experiments were performed. f TDP-43 injection increased microgliosis in the hippocampus dentate gyrus of APP/PS1ΔE9 mice. Representative Iba1 immunostaining micrographs of buffer-injected (n = 5) or TDP-43-injected (n = 4) wild-type mice and buffer-injected (n = 9) or TDP-43-injected (n = 10) APP/PS1ΔE9 mice. The calculated cell density of Iba1-positive microglial cell is shown (scale bar, 30 μm). The averaged data and s.e.m. are plotted. Statistical analysis was performed by two-tailed Mann–Whitney test, *p < 0.05, **p < 0.01 (Buffer-WT vs. TDP-43-WT, p = 0.0159; Buffer-WT vs. TDP-43-APP/PS1ΔE9, p = 0.0043; TDP-43-WT vs. Buffer-APP/PS1ΔE9, p = 0.0238; Buffer-APP/PS1ΔE9 vs.TDP-43-APP/PS1ΔE9, p = 0.0076). Source data are provided as a Source Data file.
Fig. 7
Fig. 7. TDP-43 alters Aβ assembly in APP/PS1ΔE9 mice.
Representative western blot of a extracellular-enriched and b Triton-soluble fraction of TDP-43-injected or buffer-injected APP/PS1ΔE9 mice brain. Aβ was detected and quantified in different assembles. TDP-43 group is denoted as T, and the buffer group is denoted as C. The quantitative results of each Aβ assembly in TDP-43-injected (n = 6) or buffer-injected (n = 10) APP/PS1ΔE9 mice were shown on the right panels. The averaged data and s.e.m. are plotted. The statistical analysis was performed by two-tailed Mann–Whitney test, *p < 0.05, **p < 0.01 (for extracellular-enriched fraction, Hexadecamer: Buffer vs. TDP-43, p = 0.042; Monomer: Buffer vs. TDP-43, p = 0.043; For Triton-soluble fraction, Hexadecamer: Buffer vs. TDP-43, p = 0.005). Source data are provided as a Source Data file.
Fig. 8
Fig. 8. TDP-43 oligomers colocalize with amyloid plaques in the brain of an AD patient.
a Representative immunostaining micrographs reveal that TDP-43 oligomers mainly colocalized with intraneuronal Aβ (arrowhead) and partly with amyloid plaque (arrow). b Representative immunostaining micrographs show that both amyloid plaque (arrow) and intraneuronal Aβ (arrowhead) colocalized with the total TDP-43 in the entorhinal cortex of a 77-year-old patient with Braak stage IV AD. Four induvial samples were performed. Source data are provided as a Source Data file.
Fig. 9
Fig. 9. TDP-43 oligomers colocalize with Aβ in the cytoplasmic region of neurons of an AD patient.
Representative immunostaining micrographs reveal that intraneuronal Aβ (arrowhead) colocalize with TDP-43 in the entorhinal cortex of a 77-year-old patient with Braak stage IV AD. a Specimens are stained with Aβ antibodies (4G8 and 6E10), TDP-43 oligomer antibody, neuronal marker MAP-2, and DAPI. b The merged image is shown. The results demonstrated that many TDP-43 oligomers and Aβ colocalized in the cytoplasm of neuronal cells. Four induvial samples were performed. Source data are provided as a Source Data file.

References

    1. Bloom GS. Amyloid-beta and tau: the trigger and bullet in Alzheimer disease pathogenesis. JAMA Neurol. 2014;71:505–508. doi: 10.1001/jamaneurol.2013.5847. - DOI - PubMed
    1. Querfurth HW, LaFerla FM. Alzheimer’s disease. N. Engl. J. Med. 2010;362:329–344. doi: 10.1056/NEJMra0909142. - DOI - PubMed
    1. Dahlgren KN, et al. Oligomeric and fibrillar species of amyloid-beta peptides differentially affect neuronal viability. J. Biol. Chem. 2002;277:32046–32053. doi: 10.1074/jbc.M201750200. - DOI - PubMed
    1. McGowan E, et al. Abeta42 is essential for parenchymal and vascular amyloid deposition in mice. Neuron. 2005;47:191–199. doi: 10.1016/j.neuron.2005.06.030. - DOI - PMC - PubMed
    1. Selkoe DJ, Podlisny MB. Deciphering the genetic basis of Alzheimer’s disease. Annu. Rev. Genomics Hum. Genet. 2002;3:67–99. doi: 10.1146/annurev.genom.3.022502.103022. - DOI - PubMed

Publication types

MeSH terms