. 2021 Feb;26(2):396-410.
doi: 10.1038/s41380-020-00952-8. Epub 2020 Nov 23.

Behavioral, neuroanatomical, and molecular correlates of resilience and susceptibility to maternal immune activation

Affiliations

Behavioral, neuroanatomical, and molecular correlates of resilience and susceptibility to maternal immune activation

Flavia S Mueller et al. Mol Psychiatry. 2021 Feb.

Abstract

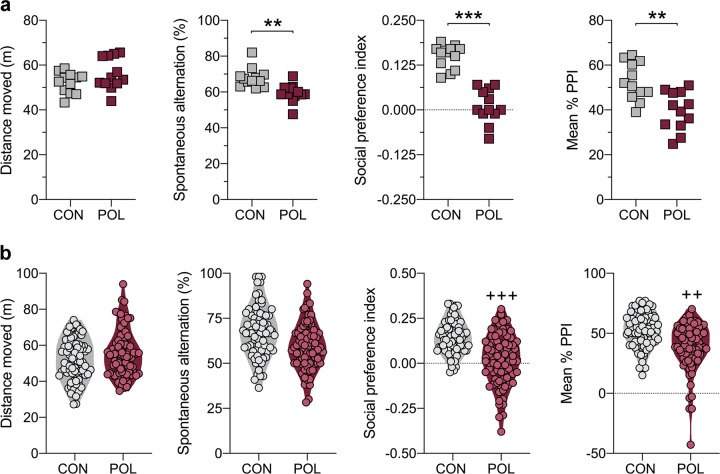
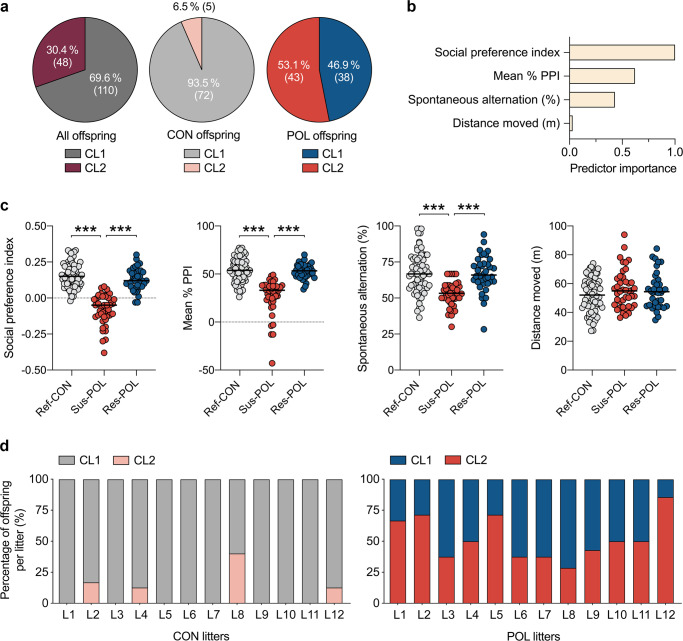
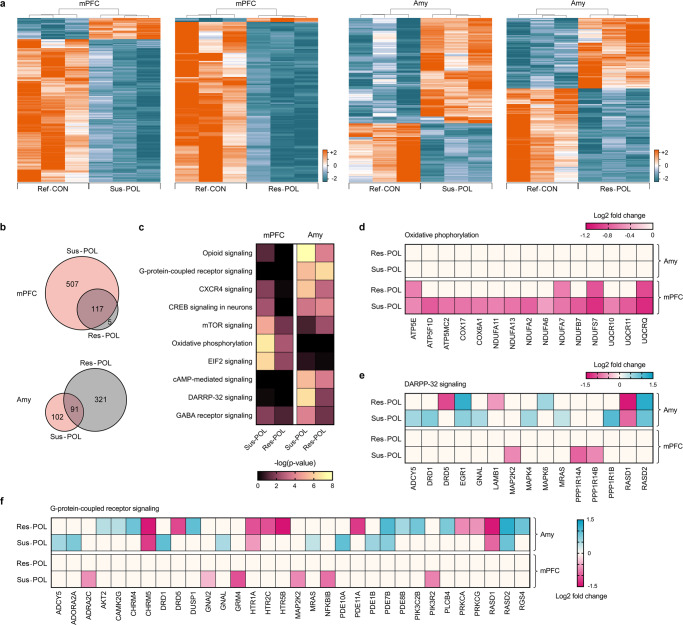
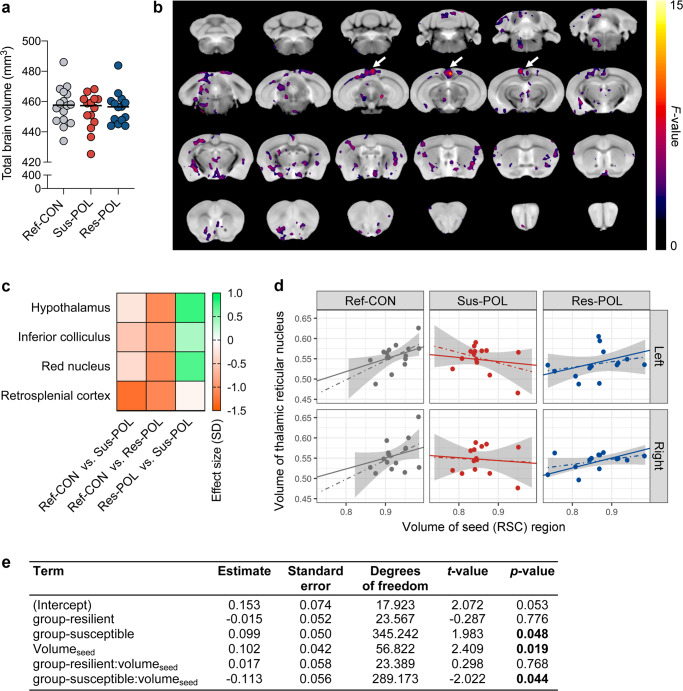
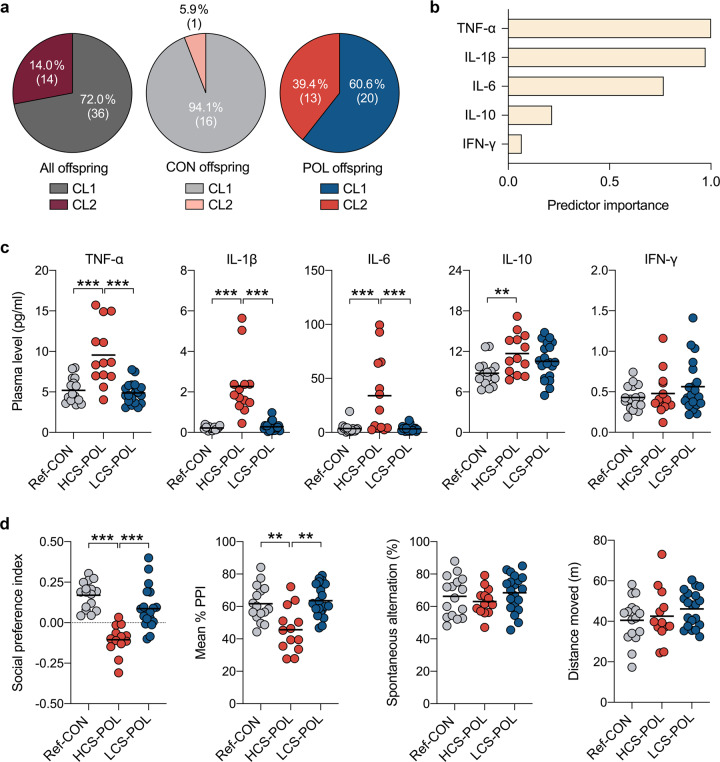
Infectious or noninfectious maternal immune activation (MIA) is an environmental risk factor for psychiatric and neurological disorders with neurodevelopmental etiologies. Whilst there is increasing evidence for significant health consequences, the effects of MIA on the offspring appear to be variable. Here, we aimed to identify and characterize subgroups of isogenic mouse offspring exposed to identical MIA, which was induced in C57BL6/N mice by administration of the viral mimetic, poly(I:C), on gestation day 12. Cluster analysis of behavioral data obtained from a first cohort containing >150 MIA and control offspring revealed that MIA offspring could be stratified into distinct subgroups that were characterized by the presence or absence of multiple behavioral dysfunctions. The two subgroups also differed in terms of their transcriptional profiles in cortical and subcortical brain regions and brain networks of structural covariance, as measured by ex vivo structural magnetic resonance imaging (MRI). In a second, independent cohort containing 50 MIA and control offspring, we identified a subgroup of MIA offspring that displayed elevated peripheral production of innate inflammatory cytokines, including IL-1β, IL-6, and TNF-α, in adulthood. This subgroup also showed significant impairments in social approach behavior and sensorimotor gating, whereas MIA offspring with a low inflammatory cytokine status did not. Taken together, our results highlight the existence of subgroups of MIA-exposed offspring that show dissociable behavioral, transcriptional, brain network, and immunological profiles even under conditions of genetic homogeneity. These data have relevance for advancing our understanding of the variable neurodevelopmental effects induced by MIA and for biomarker-guided approaches in preclinical psychiatric research.


Conflict of interest statement

Unrelated to the present study, U.M. has received financial support from Boehringer Ingelheim Pharma GmbH & Co. and from and Wren Therapeutics Ltd.; and ACV has received investigator-initiated research funding from F. Hoffman La Roche Ltd. and UBC Biopharma Sprl. All authors declare that they have no conflict of interest.

Figures

Fig. 1
Fig. 1. Main behavioral performance of MIA-exposed and control offspring.
Pregnant C57BL6/N mice were exposed to poly(I:C) (POL) or control (CON) treatment on gestation day 12. At adult age (12 weeks onwards), the resulting offspring were subjected to a behavioral testing battery assessing basal locomotor activity in the open field test, working memory in a Y-maze spontaneous alternation test, sociability in a social interaction test (social preference index values >0 represent a preference toward an unfamiliar mouse, whereas values <0 represent a preference towards an inanimate dummy object), and prepulse inhibition (PPI) of the acoustic startle reflex. a Litter-based analyses of the main behavioral data, in which the number of litters (N = 12 per treatment group) was considered as the  experimental unit. The scatter plots show the distance moved (m) in the open field test, spontaneous alternation (%) in the Y-maze working memory test (t(22) = 3.38, **p < 0.01), social preference index in the social interaction test (t(22) = 5.98, ***p < 0.001), and the mean % PPI in the PPI test of the acoustic startle reflex (t(22) = 3.75, **p < 0.01). b The violin plots with overlaid data points show the performance of individual CON (n = 77, from N = 12 litters) and POL (n = 81, from N = 12 litters) offspring in the four behavioral tests. Compared to the CON group, the POL group shows significantly larger dispersion of data relating to social approach behavior (F(80,76) = 2.29, +++p < 0.001) and mean %PPI (F(80,76) = 1.88, ++p < 0.01), based on F-tests to compare variances.
Fig. 2
Fig. 2. Stratification of MIA-exposed offspring into resilient and susceptible subgroups.
A two-step cluster analysis incorporating the main behavioral measures (total distance moved in the open field, spontaneous alternation in the Y-maze test of working memory, social preference index in the social interaction test, and mean % PPI of the acoustic startle reflex) from individual control (CON; n = 77, originating from 12 litters) and poly(I:C)-exposed (POL; n = 81, originating from 12 litters) offspring was performed to identify subgroups with differing behavioral profiles. a Distribution of CON and POL offspring across the two clusters (CL1 and CL2) identified by two-step cluster analysis. The pie charts show the cluster distribution (in percentages, %) for all offspring combined, and for CON and POL offspring separately. The numbers in brackets represent the number of offspring in each cluster. b Summary of the relative predictor importance for cluster separation as revealed by two-step cluster analysis. c The scatter plots show the main behavioral readouts for subgroups of CON and POL offspring as identified by two-step cluster analysis. Compared to reference CON (Ref-CON, n = 72) and resilient POL (Res-POL, n = 38) offspring, susceptible POL (Sus-POL, n = 43) display a significant reduction in the social preference index (F(2,150) = 101.0, p < 0.001; Sus-POL vs. Ref-CON or Res-POL: ***p < 0.001), mean % PPI in the PPI test of the acoustic startle reflex (F(2,150) = 40.8, p < 0.001; Sus-POL vs. Ref-CON or Res-POL: ***p < 0.001) and spontaneous alternation in the Y-maze working memory test (F(2,150) = 22.3, p < 0.001; Sus-POL vs. Ref-CON or Res-POL: ***p < 0.001), based on ANOVA and Tukey’s post hoc tests. d Distribution of CL1 and CL2 offspring across CON and POL litters (N = 12 for each treatment, L1–L12). Note that each POL litter concomitantly contained offspring identified as belonging to CL1 (representing Res-POL offspring) and CL2 (representing Sus-POL offspring).
Fig. 3
Fig. 3. Transcriptional profiles of resilient and susceptible MIA-exposed offspring.
Next-generation RNA sequencing was conducted in the medial prefrontal cortex (mPFC) and amygdala (Amy) of resilient (Res-POL) and susceptible (Sus-POL) MIA-exposed offspring, which were stratified based on their behavioral performance (see Fig. 3). Behaviorally characterized reference control (Ref-CON) offspring were used as a comparison. a Heat maps illustrating the clustering of differentially expressed genes (FDR: q < 0.05) in the mPFC or Amy of Sus-POL or Res-POL offspring relative to Ref-CON offspring. The color-coded key denotes upregulation (orange) and downregulation (blue) in terms of log2 fold changes. b Venn diagram denoting the number of genes that are uniquely and commonly affected in the mPFC or Amy of Sus-POL and Res-POL offspring. c Heat map of the top ten signaling pathways affected in the mPFC or Amy of Sus-POL and Res-POL offspring, as identified by Ingenuity Pathway Analysis (IPA). The color-coded key denotes the significance levels in terms of the −log(p value). d Heat map of individual genes annotated with the term “oxidative phosphorylation”. The color-coded key denotes the level of downregulation (magenta tones) in the mPFC or Amy of Sus-POL and Res-POL offspring. e Heat map of individual genes annotated with the term “DARPP-32 signaling”. The color-coded key denotes the level of upregulation (blue tones) or downregulation (magenta tones) in the mPFC or Amy of Sus-POL and Res-POL offspring. f Heat map of individual genes annotated with the term “G-protein-coupled receptor signaling”. The color-coded key denotes the level of upregulation (blue tones) or downregulation (magenta tones) in the mPFC or Amy of Sus-POL and Res-POL offspring.
Fig. 4
Fig. 4. Neuroanatomical and structural covariance characteristics of resilient and susceptible MIA-exposed offspring.
Structural magnetic resonance imaging (MRI) was performed ex vivo in resilient (Res-POL) and susceptible (Sus-POL) MIA-exposed offspring, which were stratified based on their behavioral performance (see Fig. 3). Behaviorally characterized reference control (Ref-CON) offspring were used as a comparison. a Total brain volume (mm3) across groups. b MRI fly-through of absolute volume differences across groups. No changes survived stringent correction for multiple comparisons (family wise error rate set at p < 0.05). The data shown represent voxel clusters with significant (p < 0.05) group differences revealed in exploratory analyses that were uncorrected for multiple comparisons. The clusters of voxels with the largest effect in the retrosplenial cortex (RSC) are highlighted by arrows. c Heat map showing effect sizes (in units of SD) for regional volume differences in absolute volume (mm3) across each group. Effect sizes are shown for brain areas with significant group differences revealed by uncorrected analyses. d Structural covariance between the seed (RSC) and thalamic reticular nucleus (in both hemispheres). For each group, the linear mixed-effects model fit (solid line) is shown, along with a linear model separately fitted for each subgroup/hemisphere (dotted line and shaded area). A similar pattern of positive covariation in Ref-CON offspring, and loss of covariation in Sus-POL offspring, is also seen in other brain structures (see Supplementary Fig. S7). e Fixed effects for the linear mixed-effects model predicting the volumes of all target structures in the structural covariance analysis. n(Ref-CON) = 16 (8m, 8f), n(Res-POL) = 14 (8m, 6f), and n(Sus-POL) = 14 (8m, 6f).
Fig. 5
Fig. 5. Stratification of MIA-exposed offspring based on plasma cytokine status.
A two-step cluster analysis incorporating plasma IL-1β, IL-6, IL-10, TNF-α and IFN-γ protein levels from individual control (CON; n = 17, originating from 4 litters) and poly(I:C)-exposed (POL; n = 33, originating from 6 litters) offspring was performed to identify subgroups with different cytokine profiles. a Distribution of CON and POL offspring across the two clusters (CL1 and CL2) identified by two-step cluster analysis. The pie charts show the cluster distribution (in percentages, %) for all offspring combined, and for CON and POL offspring separately. The numbers in brackets represent the number of offspring in each cluster. b Summary of the relative predictor importance for cluster separation as revealed by two-step cluster analysis. c The scatter plots show plasma cytokine levels for subgroups of CON and POL offspring as identified by two-step cluster analysis. Compared to reference CON offspring (Ref-CON, n = 16) and POL offspring with a low cytokine status (LCS-POL subgroup, corresponding to POL offspring in CL1; n = 20), POL offspring with a high cytokine status (HCS-POL subgroup, corresponding to POL offspring in CL2; n = 13) display a significant increase in TNF-α (F(2,46) = 19.1, p < 0.001; HCS-POL vs. Ref-CON or LCS-POL: ***p < 0.001), IL-1β (F(2,46) = 32.6, p < 0.001; HCS-POL vs. Ref-CON or LCS-POL: ***p < 0.001), IL-6 (F(2,46) = 13.1, p < 0.001; HCS-POL vs. Ref-CON or LCS-POL: ***p < 0.001) and IL-10 (F(2,46) = 4.9, p < 0.05; HCS-POL vs. Ref-CON: **p < 0.01), based on ANOVA and Tukey’s post hoc tests. d The scatter plots show behavioral readouts for the same Ref-CON, HCS-POL, and LCS-POL subgroups. Compared to Ref-CON (n = 16) and LCS-POL (n = 20) subgroups, HCS-POL offspring (n = 13) display a significant reduction in the social preference index (F(2,46) = 21.1, p < 0.001; HCS-POL vs. Ref-CON or LCS-POL: ***p < 0.001) and mean % PPI in the PPI test of the acoustic startle reflex (F(2,46) = 10.8, p < 0.001; HCS-POL vs. Ref-CON or LCS-POL: **p < 0.01), based on ANOVA and Tukey’s post hoc tests. Spontaneous alternation in the Y-maze working memory test and total distance moved in the open field test were not different between subgroups.

Comment in

References

    1. Brown AS, Meyer U. Maternal immune activation and neuropsychiatric illness: a translational research perspective. Am. J. Psychiatry. 2018;175:1073–83. 10.1176/appi.ajp.2018.17121311. - PMC - PubMed
    1. Meyer U. Developmental neuroinflammation and schizophrenia. Prog Neuropsychopharmacol Biol Psychiatry. 2013;42:20–34. - PubMed
    1. Weber-Stadlbauer U. Epigenetic and transgenerational mechanisms in infection-mediated neurodevelopmental disorders. Transl Psychiatry. 2017;7:e1113. - PMC - PubMed
    1. Meyer U. Neurodevelopmental resilience and susceptibility to maternal immune activation. Trends Neurosci. 2019;42:793–806. - PubMed
    1. Al-Haddad BJS, Jacobsson B, Chabra S, Modzelewska D, Olson EM, Bernier R, et al. Long-term risk of neuropsychiatric disease after exposure to infection in utero. JAMA Psychiatry. 2019;76:594–602. - PMC - PubMed

Publication types