. 2020 Dec;2(12):1413-1426.
doi: 10.1038/s42255-020-00313-3. Epub 2020 Nov 23.

An enolase inhibitor for the targeted treatment of ENO1-deleted cancers

Affiliations

An enolase inhibitor for the targeted treatment of ENO1-deleted cancers

Yu-Hsi Lin et al. Nat Metab. 2020 Dec.

Erratum in

  • Author Correction: An enolase inhibitor for the targeted treatment of ENO1-deleted cancers.
    Lin YH, Satani N, Hammoudi N, Yan VC, Barekatain Y, Khadka S, Ackroyd JJ, Georgiou DK, Pham CD, Arthur K, Maxwell D, Peng Z, Leonard PG, Czako B, Pisaneschi F, Mandal P, Sun Y, Zielinski R, Pando SC, Wang X, Tran T, Xu Q, Wu Q, Jiang Y, Kang Z, Asara JM, Priebe W, Bornmann W, Marszalek JR, DePinho RA, Muller FL. Lin YH, et al. Nat Metab. 2021 Jan;3(1):122. doi: 10.1038/s42255-020-00335-x. Nat Metab. 2021. PMID: 33340032 No abstract available.

Abstract

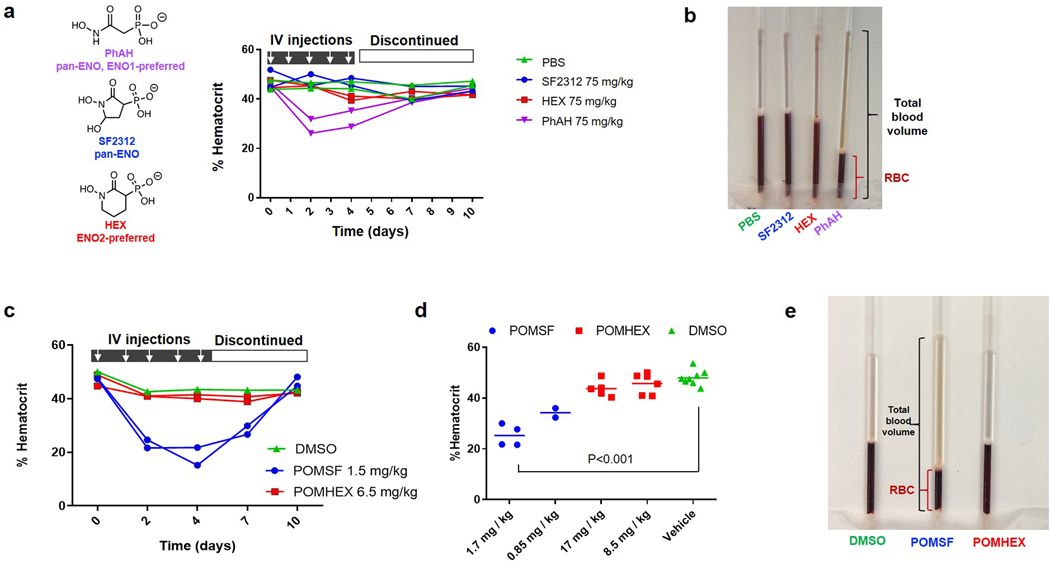
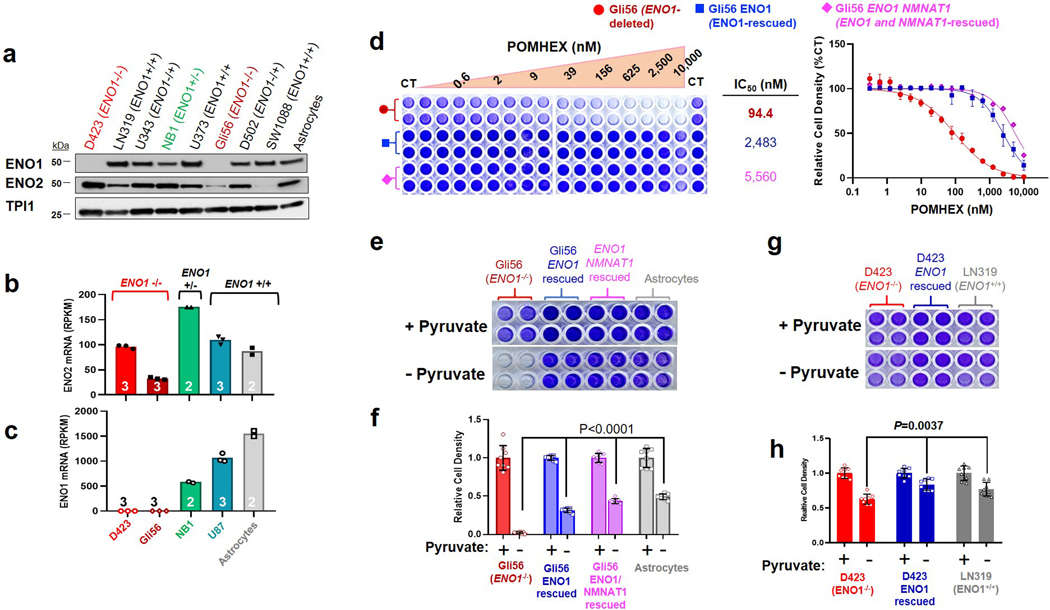
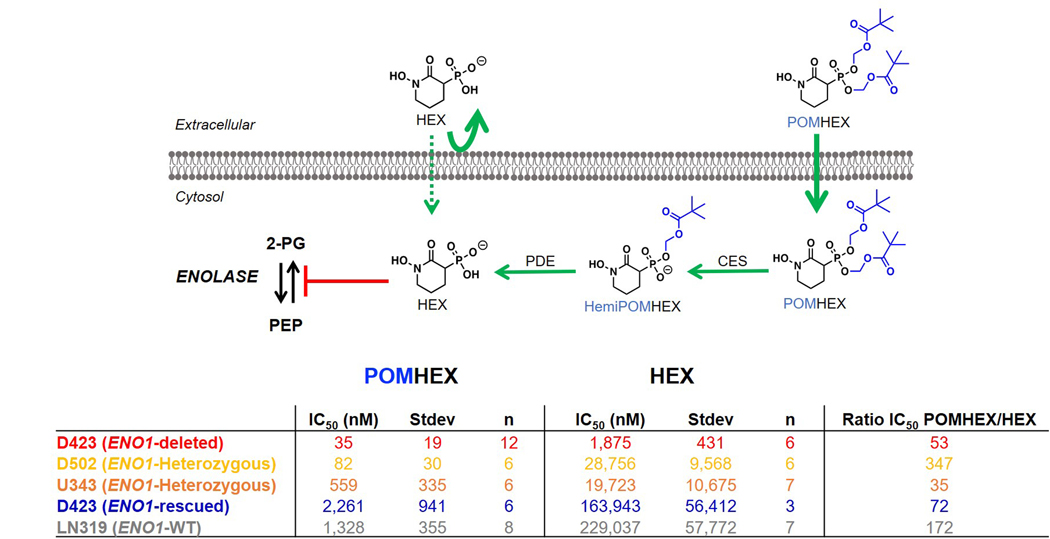
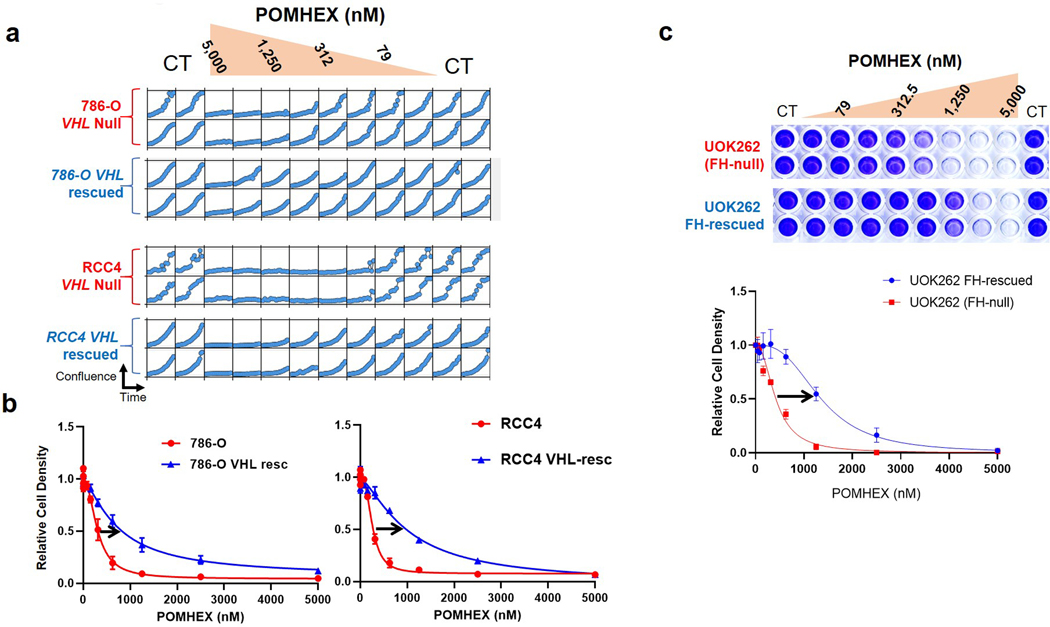
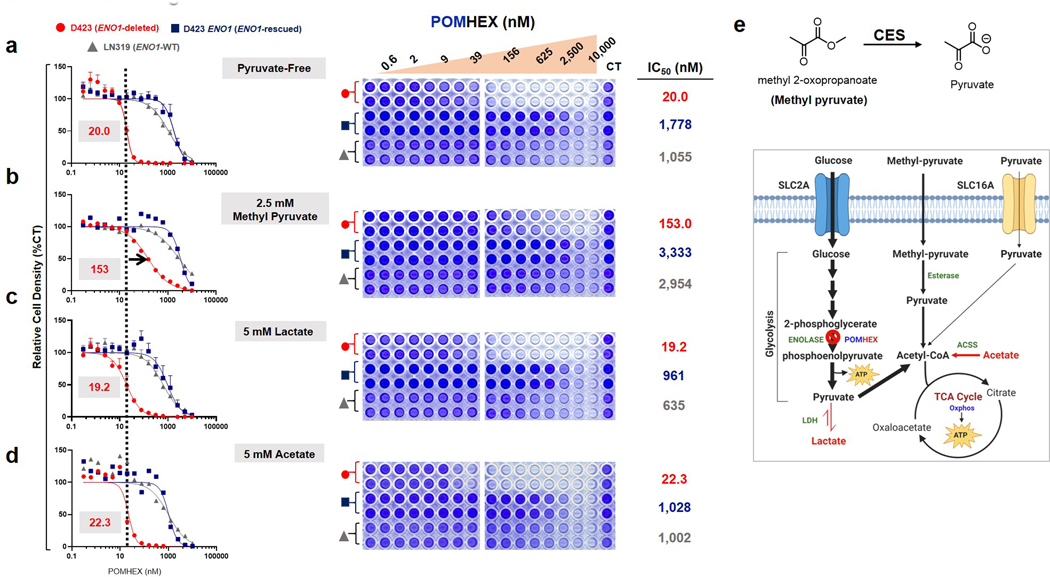
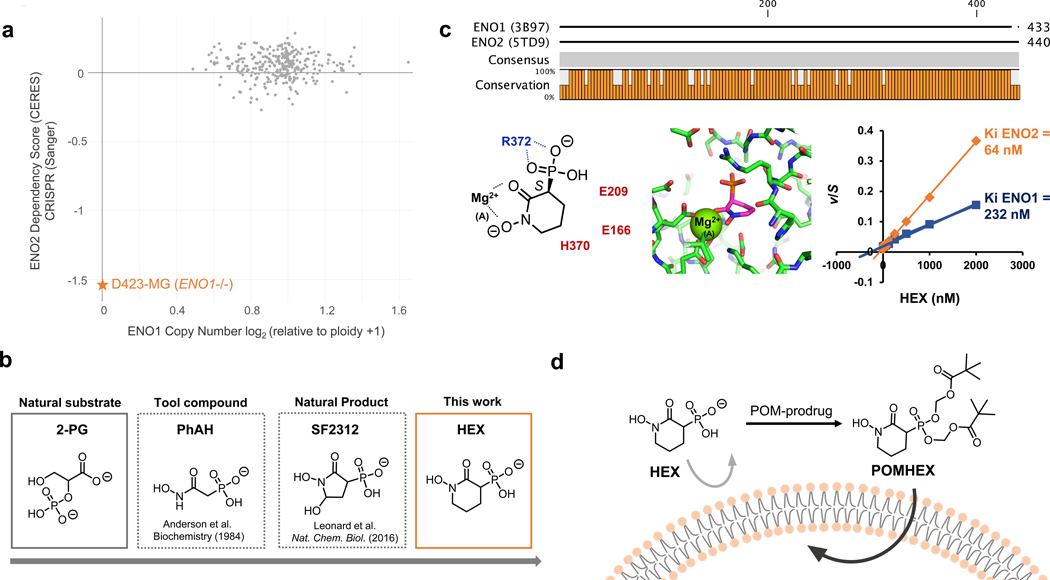
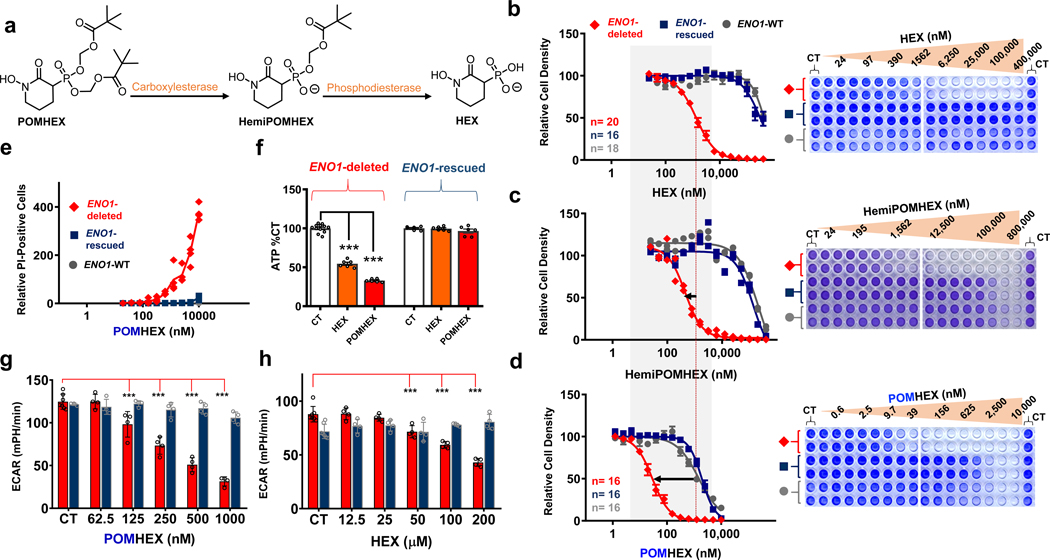
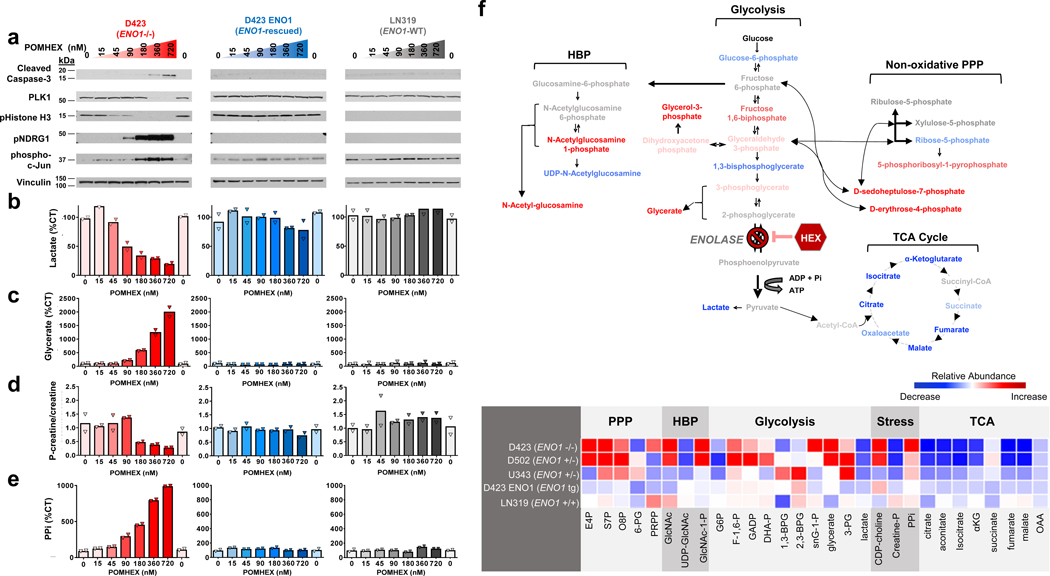
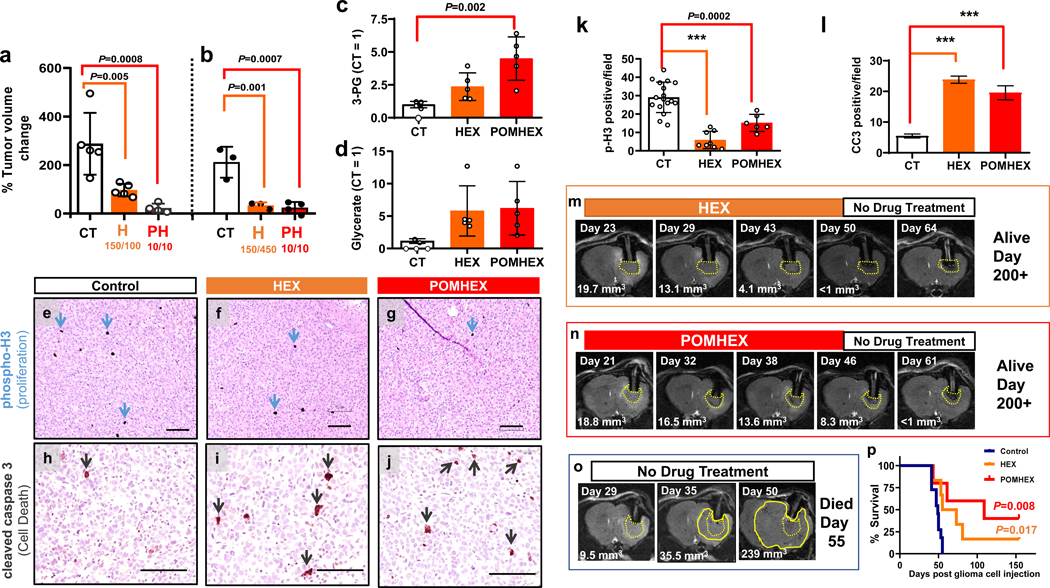
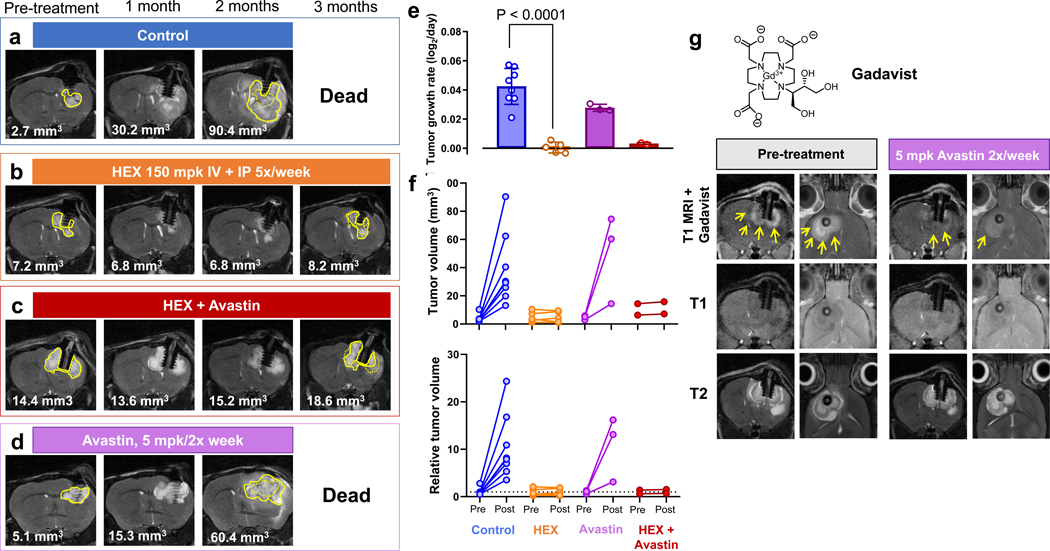
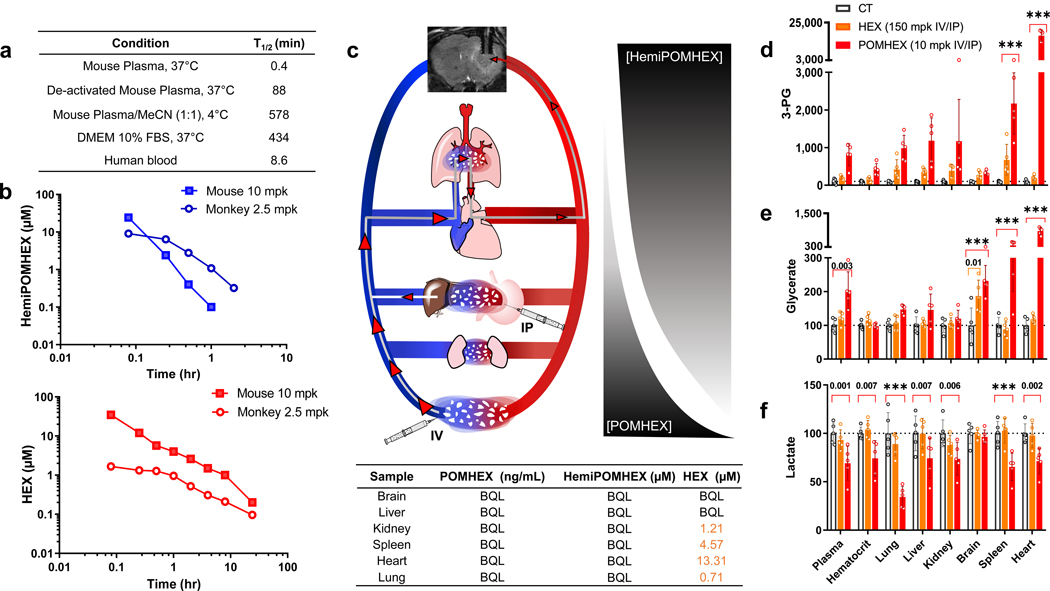
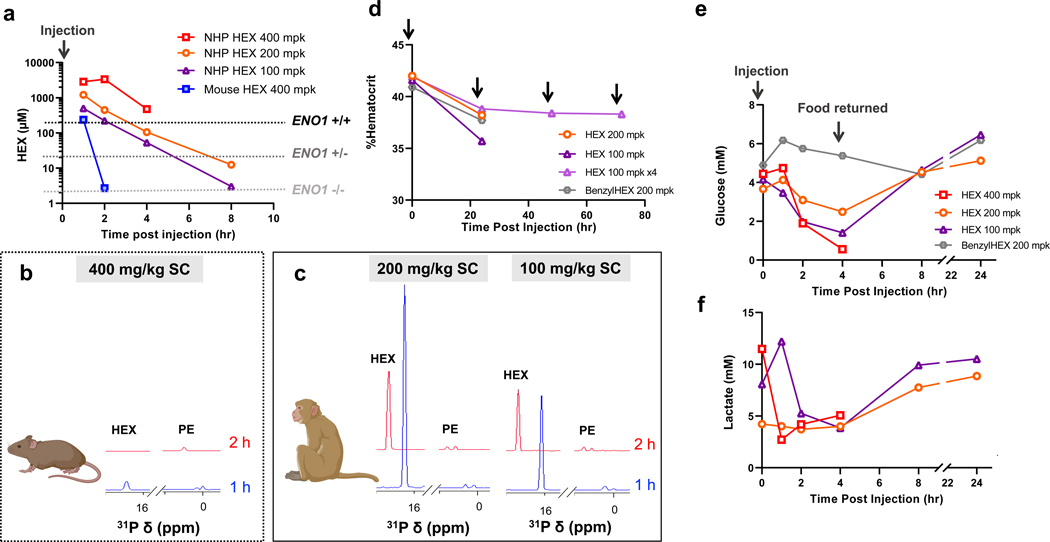
Inhibiting glycolysis remains an aspirational approach for the treatment of cancer. We have previously identified a subset of cancers harbouring homozygous deletion of the glycolytic enzyme enolase (ENO1) that have exceptional sensitivity to inhibition of its redundant paralogue, ENO2, through a therapeutic strategy known as collateral lethality. Here, we show that a small-molecule enolase inhibitor, POMHEX, can selectively kill ENO1-deleted glioma cells at low-nanomolar concentrations and eradicate intracranial orthotopic ENO1-deleted tumours in mice at doses well-tolerated in non-human primates. Our data provide an in vivo proof of principle of the power of collateral lethality in precision oncology and demonstrate the utility of POMHEX for glycolysis inhibition with potential use across a range of therapeutic settings.


Figures

Extended Data Fig. 1
Extended Data Fig. 1. Rapid induction of anemia by non-ENO2-specific Enolase inhibitors
a. Non pro-drugged phosphonate Enolase inhibitors were administered to mice by tail vein IV injection at the times indicated (white arrows) to determine effects on hematocrit (fraction of RBC / total plasma volume). Each trace represents an individual mouse treated and sampled repeatedly over 10 days, with two animals per drug or vehicle (green). Phosphoacetohydroxamate (PhAH; purple) caused a rapid and significant drop in hematocrit (and visible jaundice), which is then restored to initial levels after discontinuing treatment. PhAH is a pan-Enolase inhibitor with slightly greater potency against ENO1 over ENO2. As ENO1 is the sole isoform expressed in RBCs, anemia caused by PhAH is most likely due to on-target inhibitory activity against ENO1. b. Representative capillary tube after centrifugation from the hematocrit experiment described in a. The ratio of RBC fraction to total blood volume is decreased in response to PhAH treatment; pale yellow plasma in the PhAH sample indicates hemolysis. c,d. POMSF is a POM-pro-drug version of SF2312 that was generated for in vivo testing. Mice were IV tail vein injected with either vehicle (DMSO), POMSF, or POMHEX dissolved in PBS at the indicated doses. Capillary tubes were used to measure percent hematocrit. c. Hematocrit was determined as a function of time in response to Enolase inhibitors over a 10-day treatment course. Mice were administered either DMSO (green), POMSF (blue), or POMHEX (red) for 5 days before discontinuing treatment. Compared to the DMSO control and POMHEX, administration of POMSF results in decreased percent hematocrit, which is then restored to initial levels after discontinuing treatment. Significant differences by non-paired t-test with Bonferroni correction are indicated in d. e. Representative capillary tubes from mice treated with DMSO vehicle (left), POMSF (middle), and POMHEX (right). Note the decrease hematocrit (red bracket) as fraction of total blood volume (black bracket) from POMSF treatment; pale orange plasma indicates hemolysis
Extended Data Fig. 2
Extended Data Fig. 2. HEX is a substrate-competitive inhibitor with preference for ENO2
a, b. Enolase activity (1/v, y-axis) was measured spectrophotometrically in vitro using an NADH-coupled assay,, with ENO1 and ENO2 activity plotted as a function of substrate concentration (x-axis, 1/S: 2-phosphoglycerate in mM; HEX in nM). Data were plotted as Lineweaver-Burke with x-axis showing inverse of substrate versus inverse activity (1/V). Each dot represents on independent biochemical rate determination. Slopes (Km-apparent/Vmax) were re-plotted as a function of inhibitor concentration in Figure 1c. c. Enolase activity in lysates from ENO1 and ENO2 overexpressing D423 cells, measured as a function of HEX concentration; 0.5 mM 2-PG substrate concentration.
Extended Data Fig. 3
Extended Data Fig. 3. The Gli56 ENO1-homozygously deleted glioma cell line is sensitive to POMHEX and is pyruvate auxotrophic
Sensitivity to POMHEX was determined in additional ENO1-homozygous deleted cell line, Gli56 (dark red) and its isogenic ENO1-rescued control,. a. Absence of ENO1 protein confirmed by western blot in the Gli56 cell line; note levels of ENO2 are lower than in D423 (ENO1−/−), which is confirmed by mRNA. b, c. RNA-seq mRNA expression of ENO1 and ENO2 in cell lines differing in ENO1-deletion status, confirming lower ENO2-expression in Gli56 compared to D423 cell. Each point represent one biological replicate, means are shown, n number is indicated for each cell line. d. Gli56 (dark red) is selectively sensitive to POMHEX compared to its isogenic ENO1-rescued control (blue). Another Gli56 rescued cell line (purple), in which ENO1 and a neighboring deleted gene, NMNAT1, are re-expressed (generated for a separate collateral lethality project), also shows resistance to POMHEX. Cell density was visualized by crystal violet after 14 days of growth; fresh media (DMEM, contains 1.25 mM pyruvate) containing Enolase inhibitor was provided every 4 days (N = 4 biological replicates +/− S.EM.). In contrast to the D423 cell line, Gli56 cannot be grown in pyruvate-free DMEM media, likely due to lower level of residual ENO2 expression. e, f. Gli56 ENO1-deleted, but not Gli56 ENO1-rescued cells, can grow in pyruvate-free DMEM. g, h. D423 ENO1-deleted cells can grow in pyruvate-free DMEM media, but slower than D423 ENO1-rescued or LN319 (ENO1-WT) cells. N = 8 biological replicates, mean +/− S.E.M. P value by 2-way ANOVA are indicated.
Extended Data Fig. 4
Extended Data Fig. 4. Relative sensitivities of glioma cell lines to the pro-drug POMHEX versus the active Enolase inhibitor HEX
Sensitivity of a panel of glioma cell lines with with varying ENO1 statuses to the Enolase inhibitors POMHEX and HEX. IC50 values were calculated based on terminal cell density measured by crystal violet. D502 and U343 are ENO1-heterozygous deleted cell lines (~50% total Enolase,). Consistent with our previous reports for pan-Enolase inhibitors,, ENO1-homozygous deletion confers the greatest sensitivity to HEX, while ENO1-heterozygous deletion status shows intermediate sensitivity. While sensitivity to HEX is dependent on ENO1-deletion status, the sensitivity to POMHEX like depends not only on ENO1-deletion status but also expression of pro-drug bioactivation enzymes that transform POMHEX into active HEX enolase inhibitor (carboxylesterases, CES and phosphodiesterases, PDE). On average, the potency of POMHEX is ~75-fold greater than HEX though with substantial variation across cell lines. D502 is considerably more sensitive to POMHEX than U343 (IC50 82 vs 559 nM), yet U343 is more sensitive to HEX than D502 (IC50 19,723 nM vs 28,756 nM). This can be explained by higher levels of expression of pro-drug activating enzymes in the D502 glioma cell line result in greater sensitivity to POMHEX as compared to U343. Identification of the specific genes responsible, and their expression could be used for patient stratification, expanding the utility of Enolase inhibitors beyond those with ENO1-homozygous deletions.
Extended Data Fig. 5
Extended Data Fig. 5. ENO1-deletion status predicts sensitivity to Enolase inhibitors in glioma sphere- forming cells (GSC)
GSCs and omics data were kindly shared by the Lang lab,. a. Copy number variation at the 1p36 locus identifies GSC296 (red) as ENO1-homozygous deleted and GSC231, 268, 275, 289 as heterozygous deleted (pink). Dark blue regions represent bi-allelic (homozygous) deletion, while light blue regions correspond to mono-allelic loss. b. Confirmed lack of ENO1 expression by western blot in GSC296 (red), with corresponding levels of ENO2 shown. The western blot analysis for GSC296 was performed at least 3 times with similar outcomes. c. RNA-seq mRNA expression of ENO1 (bottom) and ENO2 (top) in ENO1-homozygous deleted and heterozygous deleted GSCs, confirming lack of ENO1 expression. Each bar represents one biological replicate. d,e. Sensitivity of GSCs with varying ENO1-deletion status to POMHEX. Dissociated GSCs were seeded in 96-well round bottom-low attachment plates in duplicate and allowed to form spheroids. Spheroids were treated with a serial dilution of POMHEX for 1 week; media was changed every 3 days with fresh drug. Viability was visualized with 5 nM TMRE (red). TMRE was quantified by ImageJ and expressed as a function of vehicle controls. Each dot represents one biological replicate. GSC296 (ENO1−/−) was distinctly sensitive to POMHEX. ENO1-heterozygous deleted GSCs showed intermediate sensitivity. ENO1-WT GSCs with the lowest residual ENO2 expression showed the greatest sensitivity amongst ENO1-WT GSCs. Experiments with GSC296 were reproduced independently once.
Extended Data Fig. 6
Extended Data Fig. 6. Normal and near-normal cell lines are minimally sensitive to POMHEX
All indicated cells were grown in RPMI and treated with a serial dilution of POMHEX for 5 days. Cell density was then quantified by crystal violet after 5 days of growth and expressed relative to control (n = 2 biological replicates). a. A panel of hepatocellular carcinoma cell lines (SNU-423, SNU-398, SK-HEP-1; grey) and highly differentiated, hepatoblastoma line (HepG2 C3A; blue) were treated with POMHEX; D423 (red) was tested as a point of reference. The IC50 of POMHEX for most HCC cell lines is about 750 nM (grey), which is slightly lower than that for ENO1-WT glioma cell lines. However, the highly differentiated cell line, HepG2 C3A, was essentially insensitive with an IC50 >10,000 nM. This resistance likely derives from the dependence of hepatocytes on OxPhos, with minimal requirements for glycolysis-derived ATP (excess ATP allows for glycolysis reversal, gluconeogenesis) and concurs with our data in NHP, which indicate no hepatotoxicity. b. HEK293 kidney cells (grey) are immortalized, non-transformed kidney cells. Sensitivity to POMHEX was comparable to that observed in ENO1-WT cancer cell lines. c. Non-immortalized human astrocytes (grey) showed IC50 of >2,500 nM to POMHEX, which is also comparable to ENO1-WT glioma cell lines and far higher than that for ENO1-deleted D423 cells.
Extended Data Fig. 7
Extended Data Fig. 7. Utility of Enolase inhibitors beyond cancers with ENO1-deletions
Hyperactivation of HIF by loss of VHL tumor suppressor gene has been reported to sensitize cells to glycolysis inhibition. a. Proliferation of renal clear cell carcinoma cell lines that lack functional VHL (786-O and RCC4, red) and isogenic rescued cell lines re-expressing VHL (blue) was followed by Incucyte live cell imager (x-axis, time; y-cell confluence) in response to POMHEX treatment. Each box represents one biological replicates. VHL-deleted parental lines showed 4- to 8-fold greater sensitivity than isogenic rescued VHL lines. b. Cell density quantified by crystal violet for the same cell lines corroborates Incucyte live imaging data (N = 4 biological replicates, with +/− S.E.M.). IC50 for POMHEX in the RCC4 line is ~250 nM and 1,000 nM in the isogenic rescued line. TCA-cycle deficiency and defective oxidative phosphorylation by loss of function of Fumarase (FH) increase reliance on glycolysis and sensitize to glucose deprivation. c. Likewise, the FH-null renal carcinoma cell line, UOK262, (red) shows dramatically higher sensitivity to the Enolase inhibitor POMHEX than isogenic FH-rescued cell line control (blue). Cell density in response to POMHEX treatment was quantified by crystal violet (N = 4 biological replicates, with +/− S.E.M.).
Extended Data Fig. 8
Extended Data Fig. 8. The synthetic cell permeable pyruvate pro-metabolite, methyl 2-oxopropanoate, significantly attenuates toxicity of POMHEX
ENO1-deleted (D423, red), ENO1-isogenically rescued (D423 ENO1, blue), and ENO1-WT (LN319, grey) cells were treated with POMHEX at the doses indicated (x-axis) in media (DMEM) free of pyruvate with either (a) 2.5 mM methyl 2-oxopropanoate “methyl pyruvate,” (b) 5 mM lactate, or (c) 5 mM acetate (d). Cell density after 5 days exposure was determined by crystal violet staining and expressed relative to non-drug contain controls (n = 4 biological replicates as indicated, +/ S.E.M.). The IC50 for pyruvate-free media is indicated by a dashed line, for comparison. Exogenous methyl pyruvate attenuates sensitivity to Enolase inhibitors especially in ENO1-homozygously deleted cells (IC50 shifted from ~20 nM to ~150 nM), but supplementation with lactate or acetate had minimal effects. (e) Methyl pyruvate is a cell-permeable, synthetic pro-metabolite of pyruvate that can passively diffuse into the cell without requiring monocarboxylate transporter (SLC16) activity. It can then be hydrolyzed by intracellular carboxylesterases to release pyruvate. While lactate and acetate could serve a similar purpose, the present data (c, d) suggest that the rate of acetyl-CoA production by these carbon sources is insufficient to compensate for loss of ATP and pyruvate by POMHEX-mediated inhibition of glycolysis.
Extended Data Fig. 9
Extended Data Fig. 9. ShRNA knockdown of ENO2 recapitulates metabolic disruptions caused by small-molecule ENO2 inhibitors
a. Knockdown of ENO2 by doxycycline-inducible shRNA in D423 ENO1-deleted and ENO1-rescued cells with the same constructs and cell lines used previously. Induction of shENO2 results in ~70% decrease in ENO2-protein levels (ratios of band densities ENO2 to TPI, loading control, are indicated). The western blot analysis was performed once with each line representing a single biological replicate. Polar metabolites were profiled at specific times after induction of shENO2 with doxycycline (times indicated in x-axis, hours) in both conditioned media (extracellular) and cell pellet (intracellular), with cells passaged after 120 h. b. Schematic showing the Enolase reaction in the context of central carbon metabolism and associated pathways, with metabolites altered selectively in D423 ENO1-deleted cells in response to ENO2-knockdown. c-e. Accumulation of metabolites upstream of Enolase in response to ENO2-knockdown in ENO1-deleted but not ENO1-rescued cells recapitulates observation with Enolase inhibitors (Figure 4). Glycerate (c, d) was the most significantly altered metabolite in polar metabolomic profile of conditioned media in ENO1-deleted but not rescued cells. Intracellular glycerate levels (c) recapitulate this trend and mirror the levels of 3-PG(e), from which it is hydrolyzed. f-j. TCA-cycle metabolites were selectively decreased in response to ENO2-knockdown, recapitulating effects of small molecule Enolase inhibition (Figure 4). Similar to observations with small molecule Enolase inhibition, hexosamine biosynthesis pathway (HBP) metabolites increase in response to ENO2 knockdown. k-l. Each bar represents one biological replicate. P values from T-test of the log of the normalized values of each biological replicate are indicated.
Extended Data Fig. 10
Extended Data Fig. 10. Phosphonate-containing drugs show similar, species-specific pharmacokinetics
The PK properties of phosphonate containing drugs have been well-studied in diverse model species as well as human patients and exhibit remarkable similarity, despite extensive chemical diversity. The very similar PK properties of these diverse drugs, derives from the fact their physiochemistry and pharmacokinetics are predominantly dictated by the negatively charged phosphonate group, conferring water solubility and limited protein binding. This water solubility means that drugs distribute with water and are cleared by a predominantly renal mechanism. Renal excretion is passive glomerular filtration and active tubular secretion, which can be modulated by drugs like Probenecid. Rodent species rapidly eliminate phosphonate drugs, with >95% of injected drug excreted unchanged within 1 hr. In non-human primates, half-lives are typically 10-times longer, and in human patients even more so. This copious body of PK data provides a guide towards predictions of how HEX might behave in human patients. The comparison with fosmidomycin is especially informative as it is nearly identical, except for 1 C-C bond, to fosmidomycin. The elimination half-life of HEX in rodents and NHP falls very much in line with other phosphonate drugs and allows reasonable confidence in PK prediction in other models (canines) and in human patients. N/A = data not found in the literature.
Figure 1.
Figure 1.. HEX is a substrate-competitive inhibitor of Enolase with specificity for ENO2.
a. Cells with ENO1 homozygous deletions (e.g. D423) are highly dependent on ENO2 to perform glycolysis, as indicated by the ENO2 CERES score. Plot adapted from the Cancer Dependency Map. b. Timeline on the development of ENO2-specific Enolase inhibitors. c. HEX displays ~4-fold specificity for ENO2 over ENO1 despite their structural similarities. Co-crystal structure of HEX and ENO2 (PDB: 5IDZ) indicates that the carbonyl and hydroxamate are crucial for chelating to the active site Mg2+ while the anionic phosphonate forms a salt bridge with R372. HEX shows competitive Michealis-Menten kinetics; plot of apparent Km/Vmax (from Supplementary Figure S1) as a function of HEX concentration (x-axis) for ENO1 and ENO2. d. HEX was modified with POM pro-drug groups to enhance its cell- and blood-brain-barrier permeability.
Figure 2.
Figure 2.. POMHEX is a potent pro-drug inhibitor of ENO2.
a. Proposed mechanism of bioactivation. Hydrolysis of the first POM group occurs through carboxylesterases while hydrolysis of the second POM group occurs through phosphodiesterases. b-d. POM groups improve the cellular permeability of HEX as indicated by left-shift in IC50s for HemiPOMHEX and POMHEX. POMHEX is > 40-fold more potent than the non-pro-drug HEX (b versus d). Selective action against ENO1-deleted cells (D423, red) over ENO1-isogenically rescued (D423 ENO1, blue), and ENO1-WT (LN319, grey) cells is maintained. Number of independent experiments (n) is indicated in b and d for each cell line, mean ±SEM are shown. e. POMHEX selectively induces cell death against ENO1-deleted cells. Each data point represents a single biological replicate (n=4 experiments) of propidium iodide-positive cells relative to CT in ENO1-deleted (D423, red), ENO1-isogenically rescued (D423 ENO1, blue), and ENO1-WT (LN319, grey) cells. f. D423 ENO1-null and D423 ENO1-rescued glioma cells were treated with HEX (orange bars, 200 μM) and POMHEX (red bars, 78 nM). Cells were treated for 8 hours and ATP was measured with the cell titer glow assay. Individual data points and the mean ± S.E.M. of n = 12, 6 (CT) and n = 6 (HEX, POMHEX) biological replicates are shown. Significant differences are indicated, using 1-way ANOVA with Tukey’s Multiple Comparison Test. ***P<0.001. g,h: The effect of HEX and POMHEX on glycolytic flux was quantified by extracellular acidification rates (ECAR) in ENO1-null (D423, red bars) and isogenic ENO1-rescued cells (D423 ENO1, blue bars). Individual data points and the mean ± S.D. of n = 7 (CT) but n=3 for ENO1-rescued cells (CT) in g and n= 4 (HEX, POMHEX treated) biological replicates are shown. Significant differences are indicated, ***P<0.001 ANOVA with Tukey’s Multiple Comparison Test.
Figure 3.
Figure 3.. POMHEX selectively induces energy stress, inhibits proliferation, and triggers apoptosis in ENO1-deleted glioma cells.
ENO1-deleted (D423, red), ENO1-isogenically rescued (D423 ENO1, blue), and ENO1-WT (LN319, grey) glioma cells were treated with the Enolase inhibitor POMHEX for 72 hours. Cells were harvested for protein lysates and polar metabolites. a. ENO1-deleted cells experience dose-dependent increase in stress response markers (phosphorylated T346 NDRG1, S73 c-Jun), decrease in proliferation (phosphorylated Histone H3, PLK1), and increase in cell death (cleaved caspsase-3), as indicated by western blot. Such effects are exclusive to ENO1-deleted cells (left, red) and are absent in ENO1-WT cells (middle, blue; right, grey). b. Lactate levels were measured by 1H NMR with the integral of 1.34 ppm doublet normalized to 3-(trimethylsilyl)propionic-2,2,3,3-d4 acid standard and expressed as % of CT [(n=2(CT), mean of n=1 (treated biological replicates)]. A dose-dependent decrease in lactate levels is unique to ENO1-deleted, but not ENO1-WT, glioma cells. c. Glycerate levels were used as a marker of Enolase inhibition and were measured by mass spectrometry. Values are expressed as % of CT [(n = 4(CT), mean of n = 2 (treated biological replicates)]. A dose-dependent increase in glycerate levels was observed in ENO1-deleted but not ENO1-WT glioma cells. d-e. Phosphocreatine/creatine ratio and pyrophosphate (PPi) levels quantified via mass spectrometry were used as measures of energy stress. The dose-dependent decrease in phosphocreatine to creatine ratio (d) and increase in PPi (e) in response to POMHEX treatment is specific to ENO1-deleted glioma cells. Both measurements are expressed as a % of CT [N = 4(CT), mean of N = 2 (treated biological replicates)]. f. Treatment with POMHEX results in depletion of anaplerotic substrates. Top: metabolic map showing relative increases (red) and decreases (blue) of relevant metabolites in glycolysis, hexosamine biosynthesis pathway, non-oxidative pentose phosphate pathway, and TCA cycle in ENO1-deleted (D423) cells. Bottom: heat map of relevant metabolites in ENO1-deleted (D423), ENO1-heterozygous deleted (D502, U343), and ENO1-WT (LN319) glioma cells. A decrease in TCA metabolites is observed across all cell lines treated with POMHEX, Relative abundance is expressed as area-under-the-curve calculations of metabolite levels obtained from dose-response POMHEX treatment.
Figure 4.
Figure 4.. Target engagement and Anti-neoplastic effects of Enolase inhibitors in vivo.
Intracranial tumors were generated by implantation of D423 (ENO1-deleted) glioma cells in nude immunocompromised mice. Tumor progression was followed by T2-MRI. a,b Tumor volumes (mm3) and percent changes calculate in response to 1-week treatments. a: tumor volume changes for non-treated controls (n=5), HEX-treated (150 mpk IV + 100 mpk IP, n=5) and POMHEX-treated (10 mpk IV + 10 mpk IP, n=5) tumor bearing mice (b: tumor volume changes, for non-treated animals (n = 3), HEX (150 mpk IV + 450 mpk S.C., n = 3) and POMHEX (10 mpk IV + 10 mpk IP, n = 5) treated for 1-week. Animals were sacrificed after 7 day treatment for evaluation of pharmacodynamics metabolites (c,d) (n = 5 individual data points, see Reporting Summary) and immunohistochemistry staining (a-d) Mean ± S.D. are shown, One way ANOVA, with Dunnett’s multiple comparison test used, P-values are indicated. (e-j). Representative images of tissue sections of HEX and POMHEX treated tumors are shown. Black size bar, 100 μm. Counts of p-H3 and CC3 positive cells per 100X section are summarized in k and l. Markers of proliferation (phospho-H3, black stain, blue arrows, k) and cell death (cleaved caspase 3; Red brown stain, red arrows, l). (CT, HEX, POMHEX n= 17, 8, 6 and n= 47, 33, 27 fields, mean ± S.E.M.). Brown-Forsythe and Wetch ANOVA, and Uri-Wiggins multiple comparisons test, with individual variance was used Adjusted P<0.0001; is indicated as ***). Tumor formation was also followed by T2-MRI in the with long term treatments (m-o). While tumor growth inexorably increases in non-treated controls (o), treatment with HEX (75 mg/kg IV and 75 mg/kg IP, m) or POMHEX (10 mg/kg IV + 10 mg/kg IP per day, n) yielded tumor regression to the point of negligibility (Day 50). After treatment discontinuation, animals were effectively cured; tumors did not recur. p. Tumor-free survival curves, with long term survivors censured after 150 days. POMHEX and HEX survival curves are compared to control. P values for Kaplan Mayer, with Log-rank (Mantel-Cox) test analysis are indicated.
Figure 5.
Figure 5.. Efficacy of the phosphonate Enolase inhibitor HEX is not dependent on a breached blood brain barrier.
Intracranial tumors were generated by implantation of Gli56 (ENO1-deleted) glioma cells in NSG immunocompromised mice and tumor formation was followed by T2-MRI. Tumor volume changes were calculated from stacked images (mm3) for a vehicle-treated controls, b HEX-treated (150 mpk IV + 150 mpk IP, 5 times/week), c Avastin + HEX, and d Avastin treated (5 mg/kg IP, twice per week). e. Intracranial tumor growth rates, (Mean ±SD), with Brown-Forsythe and Wetch ANOVA with Tamhane’s T2 multiple comparisons test with individual variances P<0.0001 for the effect of HEX. f. Tumor volumes pre- and 2 months post-treated with HEX and Avastin as indicated. Each trace represents one mouse. g. Gli56 intracranial tumors have extensive breach of the blood brain barrier, as shown by dramatic T1-MRI contrast enhancement upon IV injection with negatively charged, tissue impermeable, GADAVIST (yellow arrows). Treatment with Avastin (5 mg/kg twice per week) for 1 week resulted in near complete loss of T1-contrast enhancement, demonstrating restoration of the breached blood brain barrier. Tumor volume itself, as measured by T2-MRI, was minimally altered by Avastin treatment.
Figure 6.
Figure 6.. Ex-vivo and in vivo pharmacology of HEX and POMHEX.
a. High levels of carboxylesterase in ex vivo mouse plasma results in rapid hydrolysis of the first POM pro-drug group. Lower levels of carboxylesterase in human blood results in a longer half-life of POMHEX. In contrast, in cell culture media DMEM with 10% heat inactivated fetal bovine serum (FBS), POMHEX is reasonably stable, explaining the excellent in vitro potency. b. Dramatically higher drug exposure in non-human primates as compared to mice following IV injections of POMHEX. Mice (n=3; pooled) and monkeys (n=3; pooled) were injected IV with POMHEX at 10 mg/kg and 2.5 mg/kg, respectively. The lower dose in monkey was in anticipation of potentially higher toxicity (which did not materialize). POMHEX was undetectable (<50 nM) even at the earliest time point, in both monkey and mouse experiments; at 98 nM, POMHEX was detectable 1-minute post-injection, but at no time thereafter. The half-lives of HemiPOMHEX and HEX are both longer in monkey (open circles) compared to mouse (shaded circles). HEX and HemiPOMHEX were not measured at doses higher than 10 mg/kg due to the hazards associated with the derivatization agent, trimethylsilyl-diazomethane. c. Schematic of POMHEX in circulation when administered IP or IV in mice. Due to high levels of plasma carboxylesterase, a gradient decrease in POMHEX away from the site of injection is accompanied by a concurrent increase in HemiPOMHEX. d-f. Pharmacodynamic markers of Enolase inhibition in tissues of mice treated with HEX and POMHEX. Nude mice (n = 5 animals) were injected with POMHEX (10 mpk IV + 10 mpk IP; red), HEX (150 mpk IV + 150 mpk IP, orange) or DMSO (grey). After a 1-week treatment, animals were sacrificed, exsanguinated with organs flash frozen for metabolomic profiling. Key polar metabolites are expressed relative to a DMSO control. Treatment with HEX resulted in minimal Enolase inhibition, POMHEX treatment resulted in substantial Enolase inhibition, as indicated by significant increases in 3-PG and glycerate and a decrease in lactate. Two-way ANOVA with Bonferroni’s multiple comparison test used, adjusted P values are shown and indicated as *** if <0.001.
Figure 7.
Figure 7.. Plasma exposure of HEX is dramatically higher in NHP compared to mice.
a, b, c Animals were fasted overnight and injected with a single dose of HEX SC. Plasma concentrations of HEX were measured by 1H-31P HSQC (NS = 128) with a detection limit of >1 μM. In mice, even at a dose of 400 mg/kg, HEX became undetectable 2 h post- injection (blue). In contrast, the same dose yielded plasma concentrations of >2,000 μM in NHP over several hours. Approximate in vitro IC50 for ENO1-deleted and ENO1-intact glioma cells are indicated (dashed lines). b,c. 1D 31P spectral projections from 1H-31P HSQC NMR of either mouse (b) or NHP (c) plasma taken at 1- and 2 h post-injection. HEX (δ 16 ppm) and endogenous phosphate esters used as an internal reference (PE) are indicated. d. Hematrocrit levels remain stable even with repeated injections of HEX with no changes in body weight (3.03 vs 2.96 kg). Black arrows indicate drug injection. An initial drop is observed 24 h after HEX injection, but this is also observed with treatment of the inactive synthetic precursor, BenzylHEX, and normalizes thereafter. According to veterinarians at Charles River Laboratories, this decrease in hematocrit can be attributed to multiple blood samplings for PK studies (a, b). e. Glucose levels decrease in response to HEX, but not BenzylHEX, treatment. Decreased glucose levels in the fasting state are most parsimoniously explained by Enolase inhibition in liver and kidney, which attenuate gluconeogenesis. These levels recover when food is returned, and HEX is washed out. f. Decreases in lactate levels in response to HEX treatment concur with overall glycolysis inhibition.

References

    1. Fonvielle M, Mariano S. & Therisod M. New inhibitors of rabbit muscle triose-phosphate isomerase. Bioorganic Med. Chem. Lett. 15, 2906–2909 (2005). - PubMed
    1. Anderson VE, Weiss PM & Cleland WW Reaction Intermediate Analogues for Enolase. Biochemistry 23, 2779–2786 (1984). - PubMed
    1. Muller FL et al. Passenger deletions generate therapeutic vulnerabilities in cancer. Nature 488, 337–343 (2012). - PMC - PubMed
    1. Leonard PG et al. SF2312 is a natural phosphonate inhibitor of enolase. Nat. Chem. Biol. 12, 1053–1058 (2016). - PMC - PubMed
    1. P B-H et al. Decreased red cell enolase activity in a 40-year-old woman with compensated haemolysis. Scand. J. Haematol. 33, 401–404 (1984). - PubMed

Publication types

MeSH terms