. 2021 Feb;20(2):260-271.
doi: 10.1038/s41563-020-00853-9. Epub 2020 Nov 23.

Cellular extrusion bioprinting improves kidney organoid reproducibility and conformation

Affiliations

Cellular extrusion bioprinting improves kidney organoid reproducibility and conformation

Kynan T Lawlor et al. Nat Mater. 2021 Feb.

Abstract

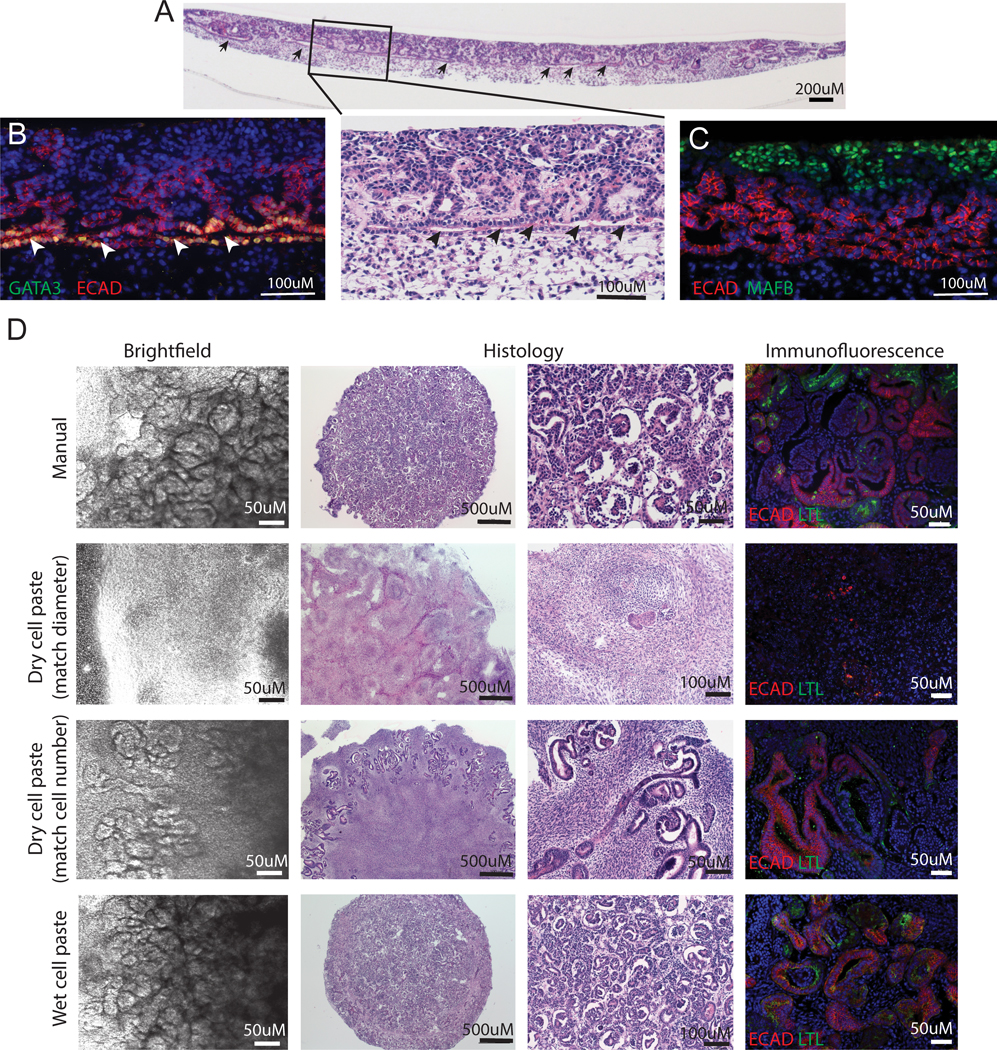
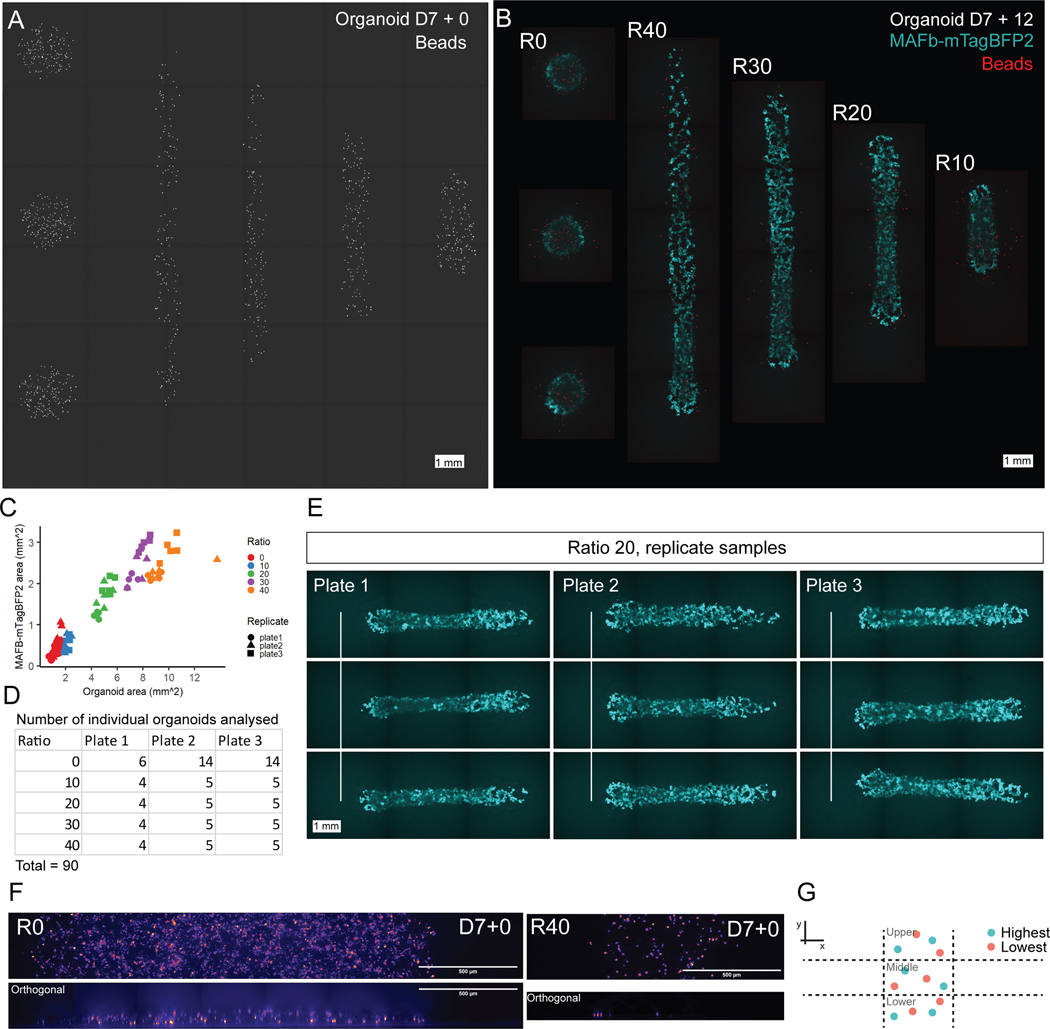
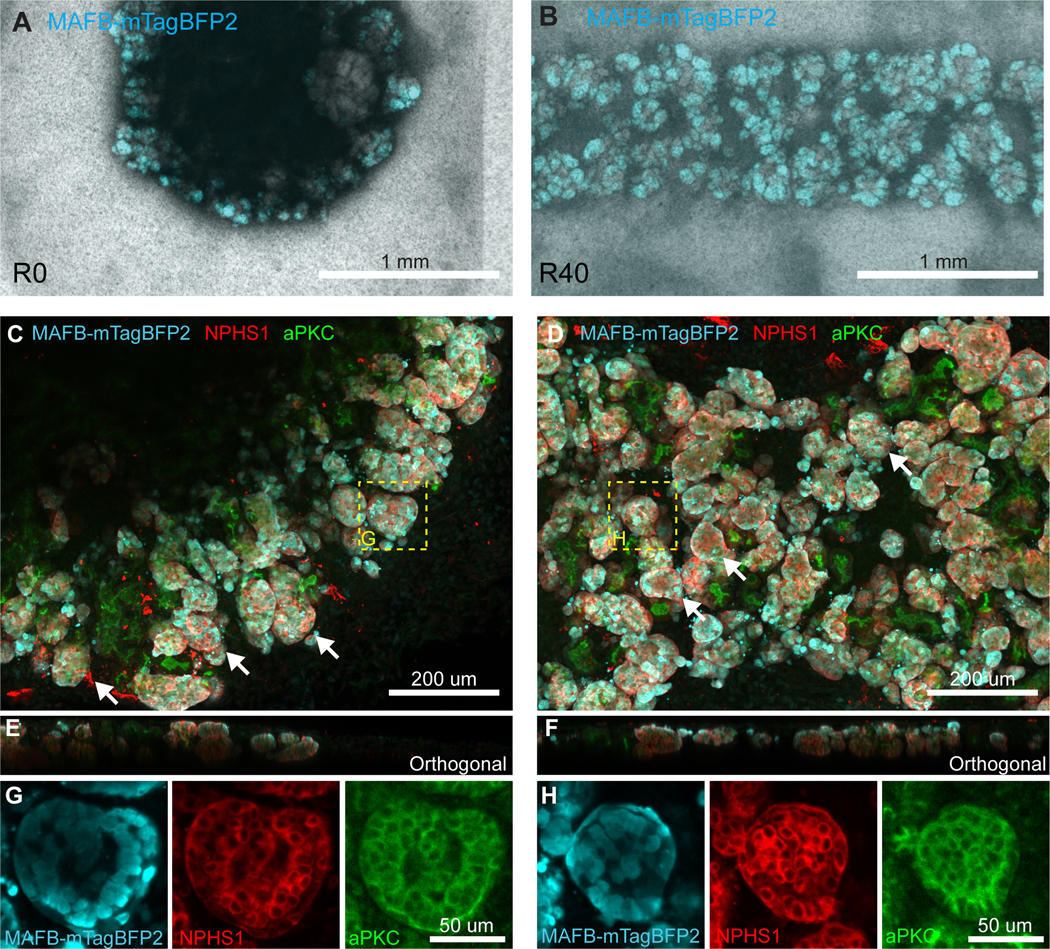
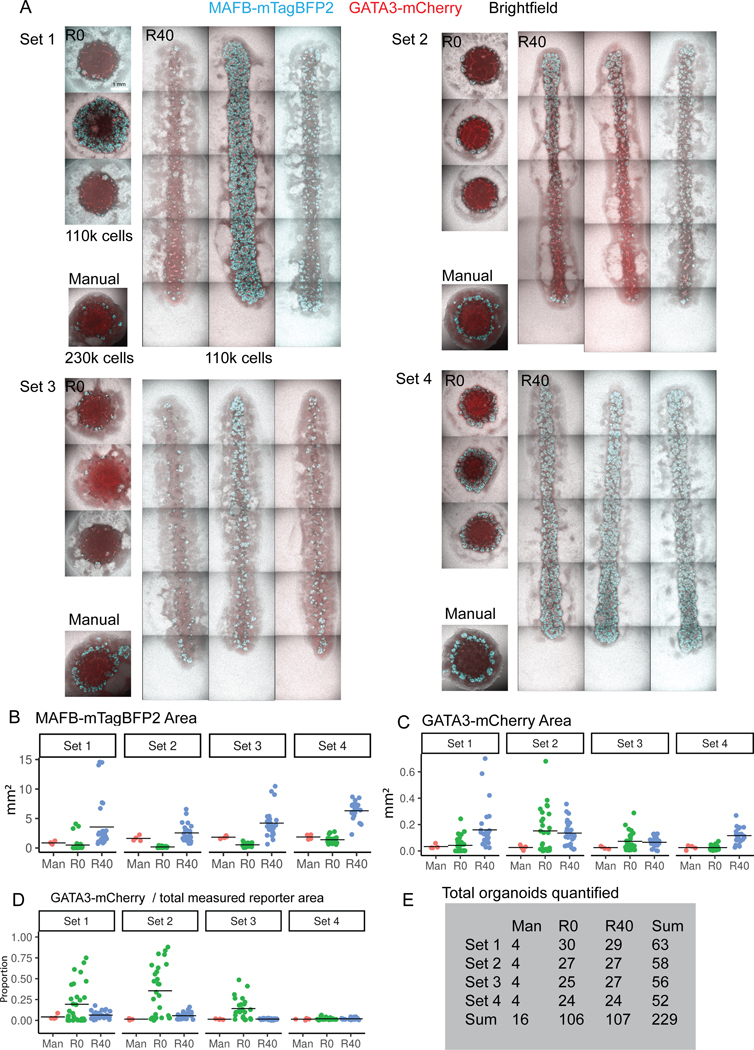
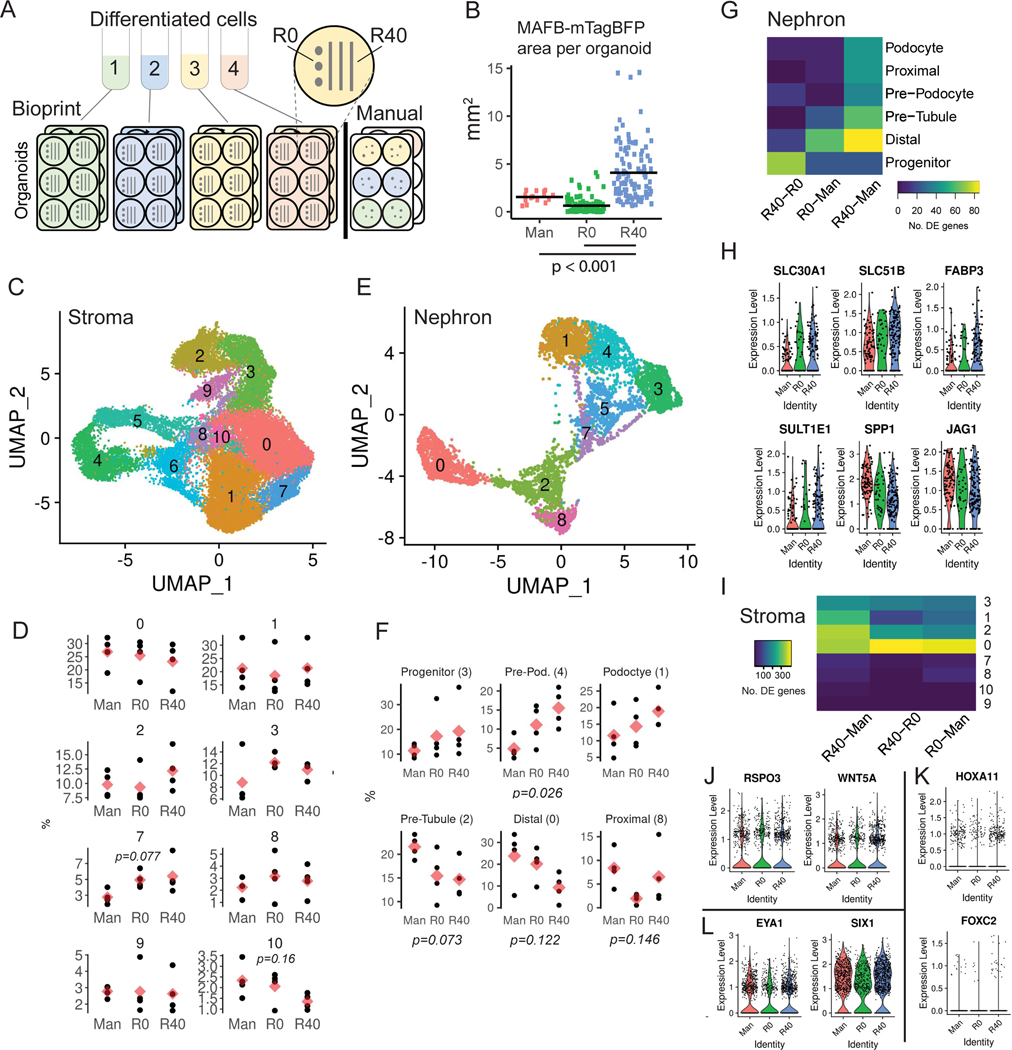
Directed differentiation of human pluripotent stem cells to kidney organoids brings the prospect of drug screening, disease modelling and the generation of tissue for renal replacement. Currently, these applications are hampered by organoid variability, nephron immaturity, low throughput and limited scale. Here, we apply extrusion-based three-dimensional cellular bioprinting to deliver rapid and high-throughput generation of kidney organoids with highly reproducible cell number and viability. We demonstrate that manual organoid generation can be replaced by 6- or 96-well organoid bioprinting and evaluate the relative toxicity of aminoglycosides as a proof of concept for drug testing. In addition, three-dimensional bioprinting enables precise manipulation of biophysical properties, including organoid size, cell number and conformation, with modification of organoid conformation substantially increasing nephron yield per starting cell number. This facilitates the manufacture of uniformly patterned kidney tissue sheets with functional proximal tubular segments. Hence, automated extrusion-based bioprinting for kidney organoid production delivers improvements in throughput, quality control, scale and structure, facilitating in vitro and in vivo applications of stem cell-derived human kidney tissue.


Figures

Extended Data Figure 1.
Extended Data Figure 1.. Histology of bioprinted kidney organoids.
A. Histological cross section of an entire day 7 +18 bioprinted kidney organoid showing clear evidence of an interconnecting epithelium (arrowheads) from which nephrons arise. B. Immunostaining of a bioprinted kidney organoid section showing a GATA3+ECAD+ connecting segment / collecting duct with multiple attached ECAD+GATA3− nephrons. C. Immunostaining of bioprinted kidney organoid section showing ECAD+ nephrons attached to MAFB+ glomeruli. D. Brightfield, histological and immunofluorescence comparisons of kidney organoids generated manually (5 × 10⁵ cells per organoid), using dry cell paste controlled for organoid diameter versus dry cell paste controlled for cell number versus wet cell paste. All image panels are representative of at least n = 3 organoids from multiple experiments.
Extended Data Figure 2.
Extended Data Figure 2.. Patterning of kidney structures in bioprinted organoids generated from varying starting cell numbers.
A. Immunofluorescence of organoids from a single starting differentiation used to generate manual organoids (5 × 10⁵ cells) versus bioprinted organoids generated from as few as 4,000 cells. Representative images from n = 3 organoids stained. Scale bars represent 200μm. B. Differentiation timecourse of bioprinted organoids generated using the MAFBmTagBFP2 reporter iPSC line. C. MAFBmTagBFP2 bioprinted organoids on the same Transwell filter with 4K, 50K or 100K of cells per organoid showing fluorescence reporter imaging (blue) and staining for differentiation (ECAD,green; LTL, blue; GATA3, red; NPHS1, purple). Images are representative of at least n = 3 organoids. Scale bars represent 200μm. D. MAFBmTagBFP2 bioprinted organoids on the same Transwell filter all generated using 100K of cells per organoid showing live fluorescence imaging (blue) and staining for differentiation (ECAD,green; LTL, blue; GATA3, red; NPHS1, purple). Scale bars represent 200μm. Representative wells from at least n = 3 are shown, with representative stained organoids alongside.
Extended Data Figure 3.
Extended Data Figure 3.. Quantification of bead density and MAFBmTagBFP2 reporter signal in organoids with varied conformations.
A. Representative image of fluorescent bead signal (greyscale) at D7+0 across an entire print pattern showing all 5 conformations, from left to right: ratio 0 (3 replicates), ratio 40, ratio 30, ratio 20, ratio 10. B. Composite image of each conformation at D7+12 showing mTagBFP2 reporter expression (cyan) and bead signal (red). Note images are placed on a black background. Scale bar is 1mm for A and B. C. Quantification of total organoid area (refer to Methods) and mTagBFP2 area in replicate organoids (compare to Figure 3G). D. Table of organoid numbers by replicate plate and ratio used for quantification in C and Figure 3G. E. Example of 9 replicate organoids produced using ratio 20. Organoids are consistent between 3 organoids from separate wells on each plate, and between plates. F. Representative images (from total n = 27 organoids from 2 independent experiments) of sparse labelling with CellTrace Far Red dye to quantify organoid height at D7+0 (Figure 3D). XY and orthogonal view are shown. G. Schematic of the scoring method used for quantification, described fully in Supplementary Methods.
Extended Data Figure 4.
Extended Data Figure 4.. MAFBmTagBFP2 reporter expression in organoids correlates to total nephron number.
A,B. Examples of low resolution, high throughput imaging used to quantify MAFB+ area as a proxy for nephron volume in organoids. Brightfield and MAFBmTagBFP2 signal was captured for each organoid using a low NA 4x objective with a spinning disk system, enabling fast capture of many samples. With a large axial depth of field, these images capture the majority of signal within each organoid in a single plane. Given the similarity in thickness (E,F, Figure 3) this planar area is approximately proportional to total MAFB+ glomerular volume and hence correlates to nephron number. A portion of an example image used for quantification of R0 (A) and R40 (B) organoids at D7+12 is shown. Note R40 organoids are much longer and were captured by stitching multiple image fields. Only a small portion of the organoid is shown. C, D. Samples were fixed and stained at D7+12 for MAFBmTagBFP2 reporter (Cyan), mature podocyte marker NPHS1 (Red) and atypical protein kinase C (aPKC, Green), a marker of the apical cell membrane. Each nephron consists of a rounded glomerular structure containing podocytes (examples highlighted by white arrows) connected to other tubular segments that are marked by aPKC but lack NPHS1. Nephrons are seen throughout the field and are packed together so that individual nephrons cannot be easily separated visually. MAFBmTagBFP2 reporter is expressed specifically in NPHS1 expressing podocytes, but is absent from other nephron segments (aPKC+, NPHS1 regions) or from other cell types. Images are maximum projections (50 μm span). E,F. Both conditions have a similar axial morphology in nephron-containing regions when viewed as an orthogonal slice (ie along the imaging Z-axis). A single orthogonal slice rendered from a 3D stack is shown. G,H. Cropped high-resolution fields showing a single glomerulus for each condition confirm co-expression of MAFBmtagBFP2 reporter and NPHS1 in podocytes. A single confocal slice is shown. All images are representative of at least n = 3 stained samples.
Extended Data Figure 5.
Extended Data Figure 5.. Quantification of large image data sets associated with organoids used for single cell RNA seq.
Line organoids are approximately 12 mm long. A. Representative images from 3 separate wells across replicates and conditions. B. Quantification of MAFB-mTagBFP2 reporter area by set and condition. Data is as in Figure 5B, but here is separated by set. C. Quantification of GATA3-mCherry reporter area. Note that Y-axis scale differs between B and C, as GATA3 area represents a substantially smaller proportion of the organoid in most cases. D. GATA3 area as a proportion of total measured reporter area (MAFB + GATA3), highlighting a shift in R0 toward a more distalised fate. E. The total number of individual organoids used for quantification, by set and condition.
Extended Data Figure 6.
Extended Data Figure 6.. Analysis of single cell RNA datasets.
A. Variability within the datasets represented as a UMAP plot, coloured by transcriptional cluster, predicted cell cycle phase, main cell type and organoid conformation (clockwise from top left). B. Marker genes of main cells type, WT1 and PAX2 (nephron), PDGFRA (stroma) and SOX17 (endothelial). C. Proportion of each cell type in replicate conditions. P value (one-way ANOVA) indicated if p < 0.2. D. UMAP representation of nephron cells after re-transformation and clustering at higher resolution. Plots are coloured by transcriptional cluster, predicted cell cycle phase and organoid conformation. Cluster identities are stated. E. Marker genes identifying each cluster: GATA3 (distal), HNF1B (pre-tubule), CUBN (proximal), HNF4A (proximal), FOXC2 (pre-podocyte), MAFB (pre-podocyte / podocyte), PODXL (podocyte), SIX2 (progenitor), EYA1 (progenitor). F. Stromal UMAP coloured by transcriptional cluster, predicted cell cycle phase and organoid conformation (top to bottom). G. Markers of specific stromal clusters; SIX2, LYPD1, FOXC2, HOXA11 (Cluster 3, nephron progenitor-like), WNT5A, LHX9 (Cluster 7) and ZIC1 and ZIC4 (Cluster 10). H. Heatmap of scaled log counts per million of pseudo bulk counts from scRNAseq sets for the top 100 most significantly expressed genes identified in bulk RNAseq analysis (Figure 4). Each column represents a single cluster from a single replicate (e.g. R40, Nephron, Set 1). Hierarchical clustering of the limited gene set indicates that bulk-RNAseq changes are largely driven by changes in the nephrons and endothelial cells.
Extended Data Figure 7.
Extended Data Figure 7.. The spatial distribution of stromal markers by wholemount immunoflouresence.
A – C. Immunofluorescence staining for markers of organoid stromal populations based on scRNA profiling. R0 organoids consist of a nephron containing area (Nephrons), a central role (Core) where nephrons are largely absent, and a thin edge (Thin edge) of monolayer cells that are typically not observed in brightfield imaging. R40 line organoids are primarily composed of a dense nephron-containing region and a thin monolayer edge, with no central core. Stromal population markers (A) MEIS1/2/3, (B) SIX1 and (C) SOX9 are present in the areas surrounding nephrons, and within the thin monolayer sheet at the edge of each organoid, but are largely absent from the central core of R0 organoids. Representative images from n = 3 organoids stained per condition are shown. Images are maximum projections spanning the full volume of the organoid. D. UMAP plots representing stromal cells in scRNA datasets, colour coded to show expression of MEIS1, MEIS2, SIX1 and SOX9. These combined markers include most of the cells in the dataset, suggesting that the absence of staining in the central core observed in (E) may indicate low overall cellularity in that region.
Extended Data Figure 8.
Extended Data Figure 8.. Direct comparison between kidney organoids and human fetal kidney confirms improved maturation of proximal tubules within R40 bioprinted lines.
A. UMAP plots comparing transcriptional identity based on unbiased clustering in Seurat (left) and prediction using the scPred method where cells are according to their similarity to a human fetal kidney (HFK) dataset (right). Identity assignment is based the most similar human fetal kidney cell type. B. The proportion of cells assigned to each cell type identity across replicates. Points show individual replicate values colour coded by replicate barcode (where HTO-1 is Set 1). Bars show SEM. P-values based on one-way ANOVA indicate a significant difference in the number of cells predicted to be Pre-Pod cells, with greatest abundance in the R40 datasets. Bioprinted conditions (R40 and R0) have more cells predicted to be podocytes, and less distal and pre-tubule cells. However, these changes were not significant. These results support the trends presented in Figure 5. C. The distribution of maximum similarity scores for the classification of each cell across conformations, plotted by cell type predicted. Most cells show a high similarity to the predicted fetal kidney cell type. D. Genes identified as significantly increased in R40 versus Manual organoids (SLC51B, FABP3 and SULT1E1) are expressed in the mature proximal tubule cells of human fetal kidney, confirming their association with a more mature cell type. A gene that was significantly decreased in R40 vs Manual organoids (SPP1) is expressed selectively in less mature cell types, supporting increased maturity in R40 proximal cells. UMAP shows transcriptional identity in human fetal kidney data. Top left plot is colour coded by human fetal kidney cell types specific to developing (renal vesicle and comma shaped body [RV_CSB], blue; proximal early nephron [PEN], red) and mature proximal tubule (PT, green). Lower left plot shows a ‘dot plot’ style representation of selected gene where size indicates the percentage of HFK cells expressing the gene and colour indicates normalised expression level. Normalised expression of each gene per cell is indicated on individual UMAP plots where expression is colour coded.
Figure 1.
Figure 1.. Generation of highly reproducible iPSC-derived kidney organoids via extrusion-based cellular bioprinting of day 7 intermediate mesoderm cell paste.
A. Diagram illustrating the protocol for manual versus bioprinted kidney organoid formation, comparing the relative cell count and speed of organoid generation between the two methods. B. Brightfield images of micromass cultures from day of printing (day 7 + 0) to day 20 of culture (day 7 + 20) depicting spontaneous nephron formation across time. Scale bars = 800μm. Images representative of ≥3 independent experiments. C. Wholemount immunofluorescence of a day 7 + 18 organoid showing patterned and segmented nephrons (distal tubule [E-CADHERIN, green], proximal tubule [LTL, blue], podocytes [NEPHRIN, white] and connecting segment/collecting duct [GATA3, red]). Scale bar =100μm. D. Wholemount immunofluorescence staining of day 7 + 18 bioprinted organoids showing proximal tubular segments (CD13, CUBN, LTL), tubular basement membranes (LAMININ), surrounding stroma (MEIS1/2/3), distal tubule/loop of Henle TAL (SLC12A1) and endothelium (CD31). Scale bars = 100μm. E. Brightfield (day 7 + 7) and wholemount immunofluorescence of manual and bioprinted kidney organoids generated simultaneously from the same batch of iPSC-derived intermediate mesoderm showing patterning and segmented nephrons in both (EPCAM, green: epithelium; LTL, blue: proximal tubule; NPHS1, white: glomeruli; GATA3, red: connecting segment/collecting duct). Scale bars = 100μm (brightfield) and 50μm (immunofluorescence). F. Demonstration of bioprinted kidney organoids showing the use of reduced numbers of cells at printing (500K, 400K, 300K) and the reproducibility of size across multiple wells (200K). G. 6-well Transwell® insert with 9 bioprinted organoids, each containing approximately 96,000 cells. H. Differentiation within bioprinted organoids is equivalent with reduced starting cell number. Images show H&E stained sections from mature organoids printed as either 2 × 10⁵ or 4 × 10⁵ cell organoids. Scale bar = 100μm. For C-E, H, images are representative of ≥ 3 stained organoids.
Figure 2.
Figure 2.. Application of bioprinted organoids for compound testing in 96-well format.
A. Bioprinted day 7 + 18 organoids within a 96-well Transwell format (1× 10⁵ cells per organoid). B. 96-well plate within plate holder on print stage. C. Quality control assessment of cell number per organoid and viability across a 96-well plate. Error bars show SD for cell number measurements (see Methods). D. Immunofluorescence after 10μM Doxorubicin treatment depicts podocytes (MAFB), apoptotic cells (cleaved caspase 3 [CC3]), distal tubules (cytokeratin 8/18; CCK8/18), proximal tubules (LTL) and nuclei (DAPI). Images representative of n = 3 experiments, Scale bars = 50μm. E. Expression of kidney injury molecule-1 (HAVCR) and apoptosis genes (CASP3, BAX) after Doxorubicin treatment (n = 3 per treatment group, n = 2 for controls). 10μM Doxorubicin increases HAVCR (p < 0.0001) and BAX (p = 0.04) expression. F. Expression of podocyte (NPHS1, PODXL) and proximal tubule (CUBN) genes after Doxorubicin treatment (n = 3 per treatment group, n = 2 for controls). NPHS1 and PODXL are decreased at both doses (p < 0.0001 for all). CUBN expression is decreased with 10μM treatment (p = 0.0019). For E. and F significance was determined by two-way ANOVA, with Dunnett’s multiple comparison test. **** = p < 0.0001, ** = p < 0.01. Error bars = SD, shaded bars = mean. G. Cell viability 72 hours after Doxorubicin treatment in 6-well (green) or 96-well (blue) format. 6-well data are n = 6 (control) or n = 3 (treatment) per dose from 3 independent experiments. 96-well data are minimum n = 1, maximum n = 3 per dose from a single experiment. Error bars = SD, shaded bars = mean. Curves represent a non-linear fit for each plate type, total n = 27 (6-well) or n = 22 (96-well). H. Application of 96-well bioprinted organoids for testing viability in response to aminoglycoside antibiotics. Curves represent a non-linear fit for each compound; n = 19 (Amikacin), n = 24 (Tobramycin), n = 30 (Gentamycin), n = 30 (Neomycin), n = 22 (Streptomycin).
Figure 3.
Figure 3.. Use of extrusion bioprinting to alter organoid conformation.
A. Generation of organoids of increasing length from an identical starting cell number (1.1 × 10⁵ cells). Diagram illustrates the relative effect on organoid profile / height at bioprinting, moving from ratio 0 (no needle movement at extrusion) to ratio 40 (extrusion with needle movement across the Transwell surface), not to scale. Ratio refers to the ratio of tip movement to extrusion B. Ratio 0 and 40 cell paste depositions containing fluorescent beads to measure cell paste spread across the Transwell surface. Representative images from dataset used for quantification in C. Dotted lines marks the edge of cell paste. C. Quantification of beads density per unit of Transwell surface area. Higher ratios give more spreading and hence lower beads densities (n = 21 organoids total [n = 3 per condition, except for ratio 0 where n = 9]). D. Measured tissue height at D7+0, shortly after bioprinting (n = 27 organoids from 2 independent experiments). E. Measured organoid height at day 7 + 12 for organoids printed with varying conformations (n = 21 organoids). Red points in D and E represent mean value. Note that the Y-axis scale differs between D and E (also refer to Extended Data Figure 3). F. Fluorescence imaging of live organoids printed in varying conformations and generated using the MAFBmTAGBFP2 reporter line. Blue fluorescent protein marks glomerular area. G. Quantification of mTagBFP2 area versus organoid length in replicate bioprinted organoids of different conformations. Each point represents a single organoid (n = 90 organoids total, see Extended Data Figure 3). H. Immunofluorescence of representative bioprinted organoids from each conformation (n = 3 organoids stained) showing MAFBmTagBFP2 (glomeruli, endogenous blue fluorescence), epithelium (EPCAM, grey), proximal tubule (LTL, green) and connecting segment/collecting duct (GATA3, red). Scale bar = 100μm.
Figure 4.
Figure 4.. Changing organoid conformation reduces unpatterned tissue and increases nephron number and maturation (also refer to Extended Data Figure 4).
A. Heatmap comparing scaled log counts per million expression values in bulk-RNAseq transcriptional profiles of ratio 0 (R0), ratio 20 (R20) and ratio 40 (R40) organoids. B. Heatmap of scaled log counts per million expression values of genes representing the top most significantly enriched GO terms in ratio 40 vs ratio 0 organoids. C. Immunofluorescence to validate transcriptional changes (n = 3 representative organoids stained per condition from total n = 90), illustrating a reduction in the endothelial marker SOX17 and an increase in the loop of Henle thick ascending limb (TAL) marker SLC12A1 as ratio increases. Scale bars = 100μm. D. 3D rendering of bioprinted organoids, illustrating the distinct morphology between a ratio 0 and a ratio 40 organoid. A single representative stained organoid from data in C was imaged at high resolution. Images are rendered to show the XY plane tilted at 45 degrees. Movies of these rendered images are provided as Supplementary data (Supplementary Movies 2 and 3).
Figure 5.
Figure 5.. Single cell RNAseq comparison of manual organoids, bioprinted R0 ‘dots’ and bioprinted R40 ‘lines’.
A. A single scRNAseq library per condition was generated from multiple barcoded organoids sets. R40 and R0 were generated from 1.1 × 10⁵ cells, manual organoids from 2.3 × 10⁵ cells. B. MAFB reporter area is increased, indicating greater nephron number in R40 organoids. Bars indicate mean. R40-Man, p = 2.1 × 10⁻⁵, R40-R0, p = 2 × 10⁻¹⁶ (two-sided t-tests with the Holm correction for multiple comparisons). See Extended Data Figure 5. C. UMAP of stromal lineage scRNAseq data. See Extended Data Figure 6F and Supplementary Table 5. D. Cluster proportions by replicate and condition. P-value is stated where p < 0.2 (one-way ANOVA). Red diamonds represent mean for n = 4. E. UMAP of nephron lineage scRNAseq data. See Extended Data Figure 6D and Supplementary Table 4. F. Cluster proportion per condition. P-values as for D. For cluster 4, p = 0.021 for R40 vs Man (Tukey multiple comparison test, following ANOVA). G. Total number of filtered differentially expressed (DE) genes per pseudo-bulk comparison for nephron clusters. (Adjusted p-value < 0.05, Benjamini-Hochberg correction, see Supplementary Methods). Full gene lists and p-values are in Supplementary Data 1. H. R40 proximal tubule cells show significantly increased expression of genes associated with proximal tubule maturity (SLC30A1, SLC51B, FABP3, SULT1E1) and decreased expression of genes associated with early immature tubule (SPP1, JAG1) compared to manual organoids. Violin plots show the distribution of normalised single cell expression values, with individual cell values overlayed. I. Total number of filtered DE genes per pseudo-bulk comparison for stromal clusters (Supplementary Data 1). J. RSPO3 and WNT5A are significantly increased in R40 vs manual stromal cluster 2 cells. K, L. Genes associated with nephron progenitor identity are significantly increased in K. R40 vs Manual (HOXA11, FOXC2) and L. R40 vs R0 (EYA1, SIX1) stromal cluster 3 cells.
Figure 6.
Figure 6.. Generation of a kidney tissue patch using 3D extrusion cellular bioprinting.
A. Illustration of the scripted movement of the needle tip for cell paste extrusion, generating a patch organoid across an area of approximately 4.8mm × 6mm, containing approximately 4×10⁵ cells. Lines indicate continuous movements. B. Brightfield imaging of the bioprinted kidney tissue patch demonstrating uniform formation of nephron structures. C. Live confocal imaging of MAFBmTAGBFP2 reporter signal throughout a patch organoid at D7+12. Scale bar =1mm. Image is representative of n = 3 replicate patches. D. Confocal immunofluorescence of a D7+14 patch organoid demonstrating uniform distribution of nephrons expressing markers for podocytes (mTagBFP2 [left panel; blue]), proximal tubules (LTL [left panel; green] and HNF4A [right panel; red]), nephron epithelium (EPCAM [left panel; red]), distal tubule/loop of Henle TAL (SLC12A1 [right panel; green]) and endothelial cells (SOX17 [right panel; grey]). Scale bars = 100μm. Representative image from n = 3 patches. E. Live confocal imaging of a D7+14 patch organoid derived from the HNF4AYFP reporter iPSC line following incubation in TRITC-albumin substrate. Images depict TRITC-albumin (red) uptake into YFP-positive proximal tubules (yellow). Outlined areas (whole organoid images) are shown at higher magnification below, with and without phase contrast overlays. Scale bars = 100μm. Assay performed on a representative sample from n = 3 patches.

Comment in

References

    1. Freedman BS et al. Modelling kidney disease with CRISPR-mutant kidney organoids derived from human pluripotent epiblast spheroids. Nat Commun 6, 8715, doi:10.1038/ncomms9715 (2015). - DOI - PMC - PubMed
    1. Morizane R. et al. Nephron organoids derived from human pluripotent stem cells model kidney development and injury. Nat Biotechnol 33, 1193–1200, doi:10.1038/nbt.3392 (2015). - DOI - PMC - PubMed
    1. Taguchi A. et al. Redefining the in vivo origin of metanephric nephron progenitors enables generation of complex kidney structures from pluripotent stem cells. Cell Stem Cell 14, 53–67, doi:10.1016/j.stem.2013.11.010 (2014). - DOI - PubMed
    1. Taguchi A. & Nishinakamura R. Higher-Order Kidney Organogenesis from Pluripotent Stem Cells. Cell Stem Cell 21, 730–746 e736, doi:10.1016/j.stem.2017.10.011 (2017). - DOI - PubMed
    1. Little MH & Combes AN Kidney organoids: accurate models or fortunate accidents. Genes Dev 33, 1319–1345, doi:10.1101/gad.329573.119 (2019). - DOI - PMC - PubMed

Methods references

    1. Takasato M. et al. Directing human embryonic stem cell differentiation towards a renal lineage generates a self-organizing kidney. Nat Cell Biol 16, 118–126, doi:10.1038/ncb2894 (2014). - DOI - PubMed
    1. Chen G. et al. Chemically defined conditions for human iPSC derivation and culture. Nat Methods 8, 424–429, doi:10.1038/nmeth.1593 (2011). - DOI - PMC - PubMed
    1. Schindelin J. et al. Fiji: an open-source platform for biological-image analysis. Nat Methods 9, 676–682, doi:10.1038/nmeth.2019 (2012). - DOI - PMC - PubMed
    1. van der Walt S. et al. scikit-image: image processing in Python. PeerJ 2, e453, doi:10.7717/peerj.453 (2014). - DOI - PMC - PubMed
    1. Dobin A. et al. STAR: ultrafast universal RNA-seq aligner. Bioinformatics 29, 15–21, doi:10.1093/bioinformatics/bts635 (2013). - DOI - PMC - PubMed

Publication types

MeSH terms