. 2020 Dec;23(12):1597-1605.
doi: 10.1038/s41593-020-00742-z. Epub 2020 Nov 23.

Acute social isolation evokes midbrain craving responses similar to hunger

Affiliations

Acute social isolation evokes midbrain craving responses similar to hunger

Livia Tomova et al. Nat Neurosci. 2020 Dec.

Erratum in

Abstract

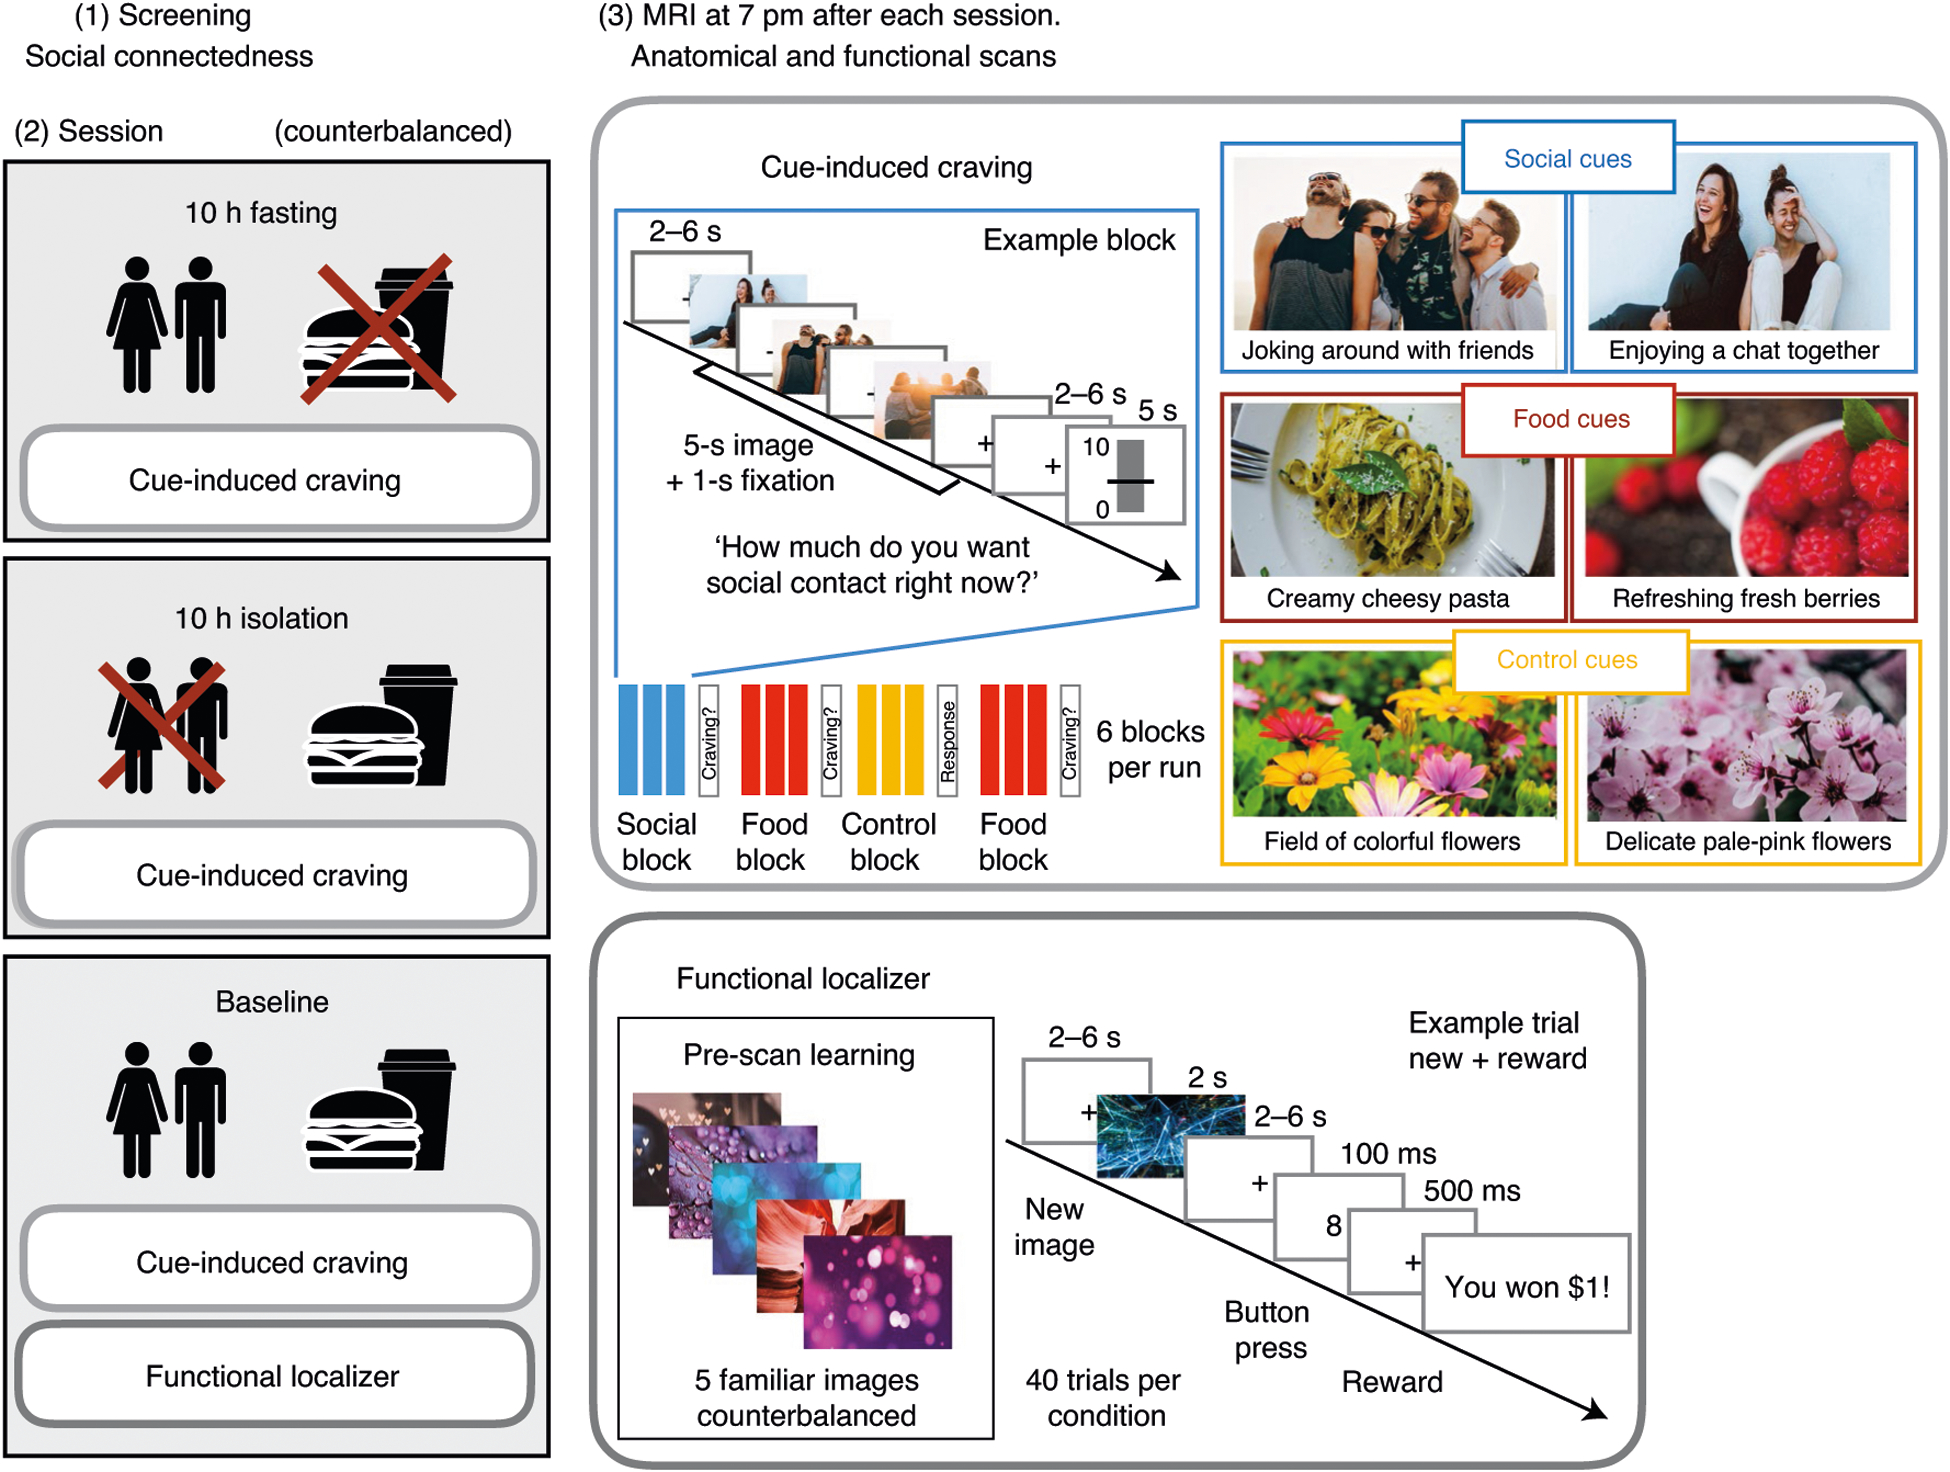
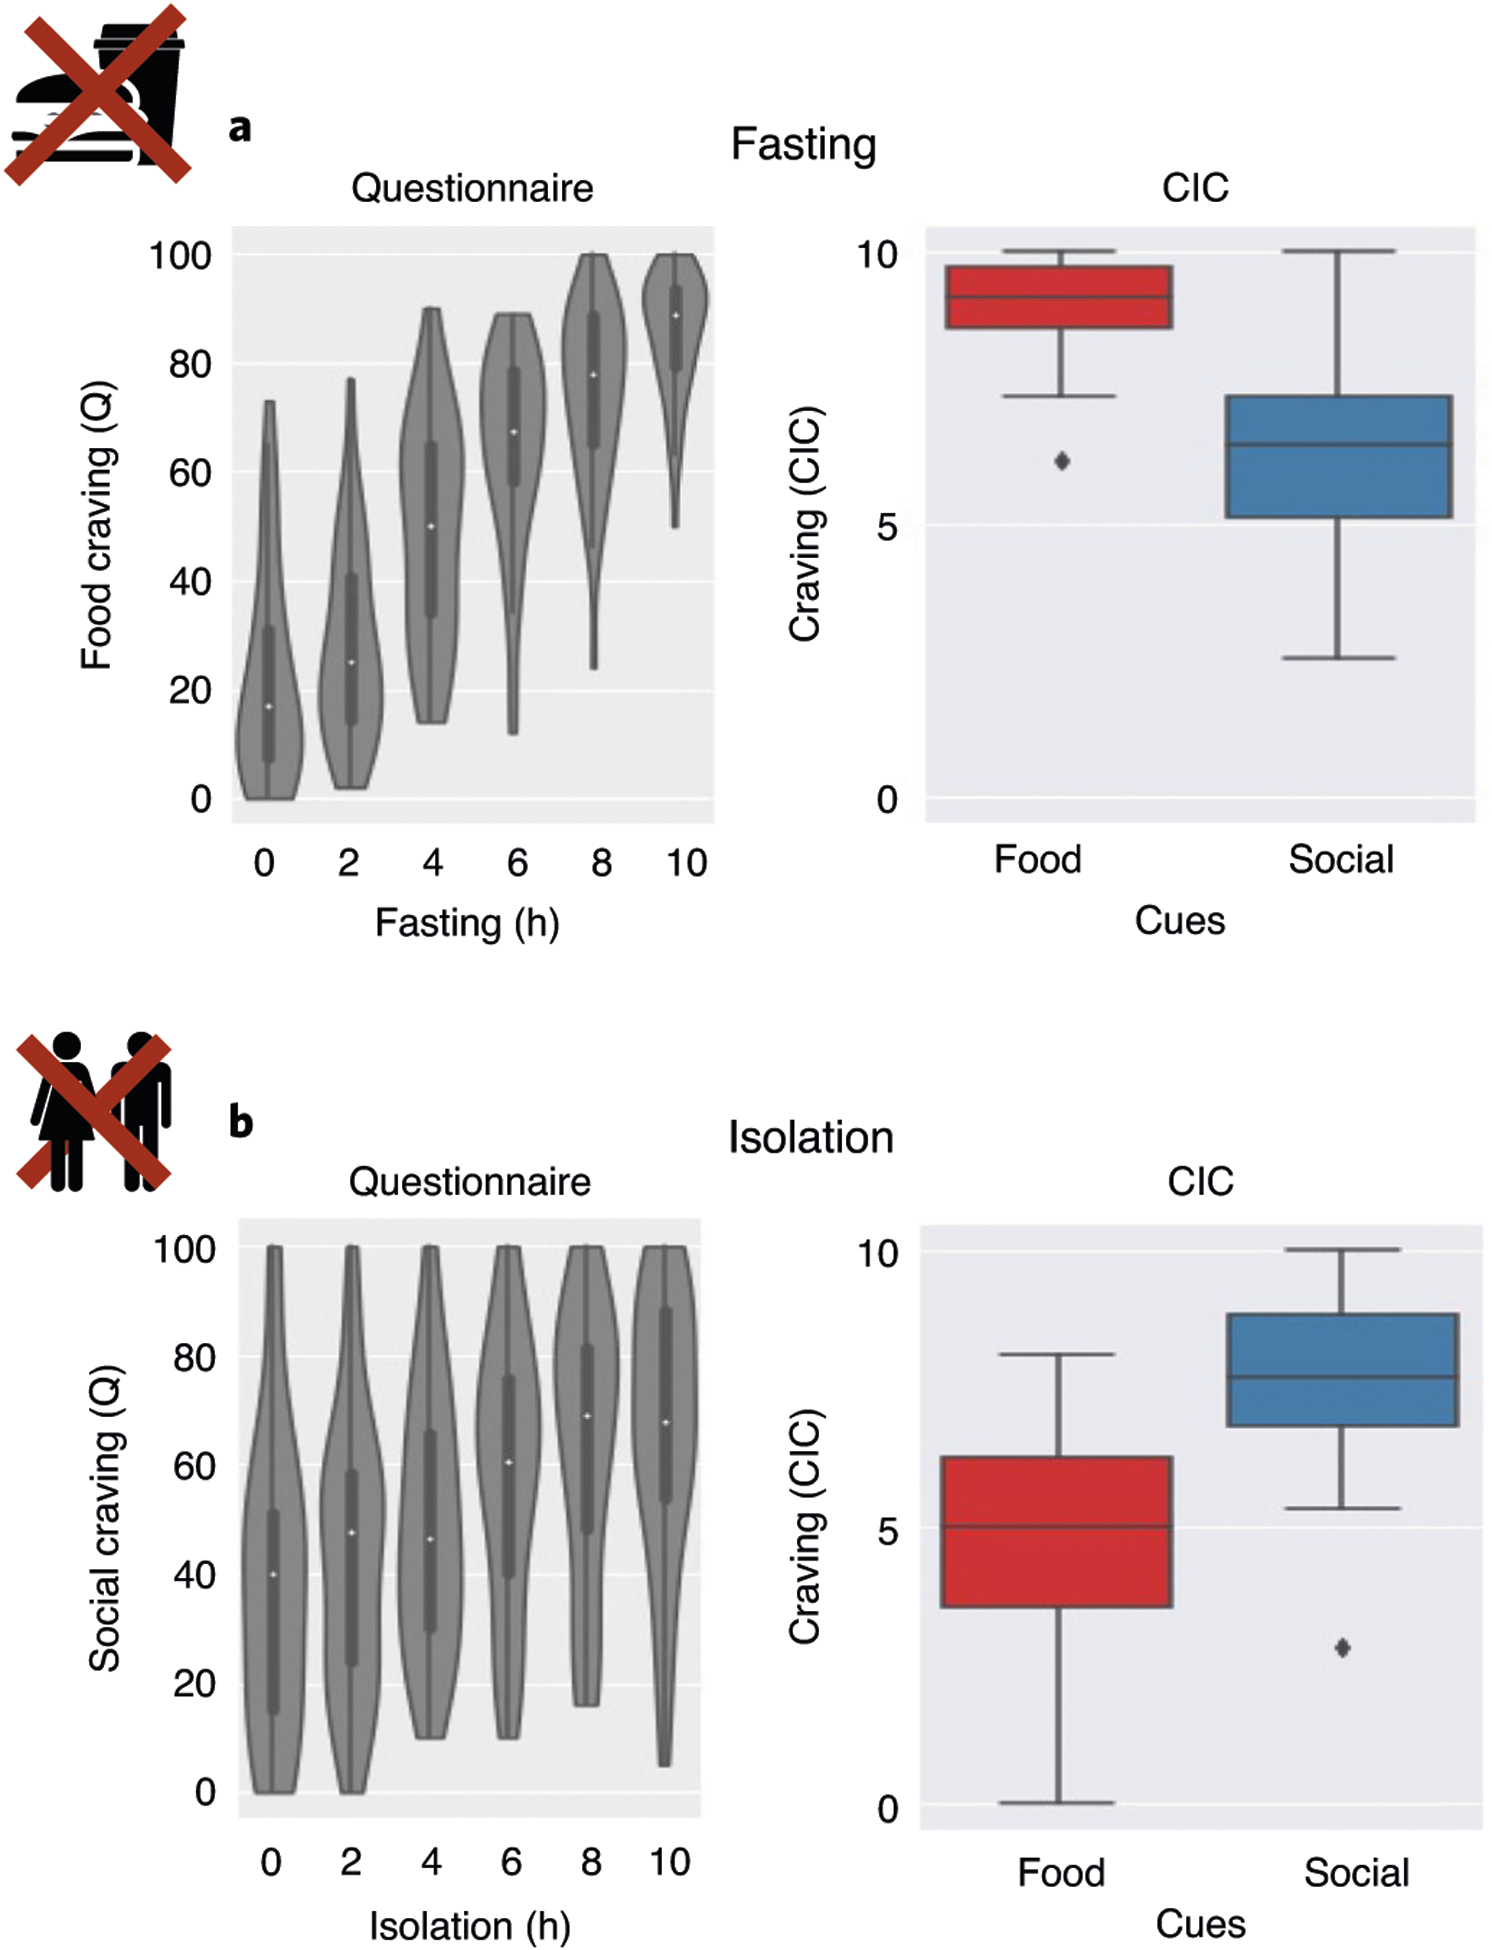
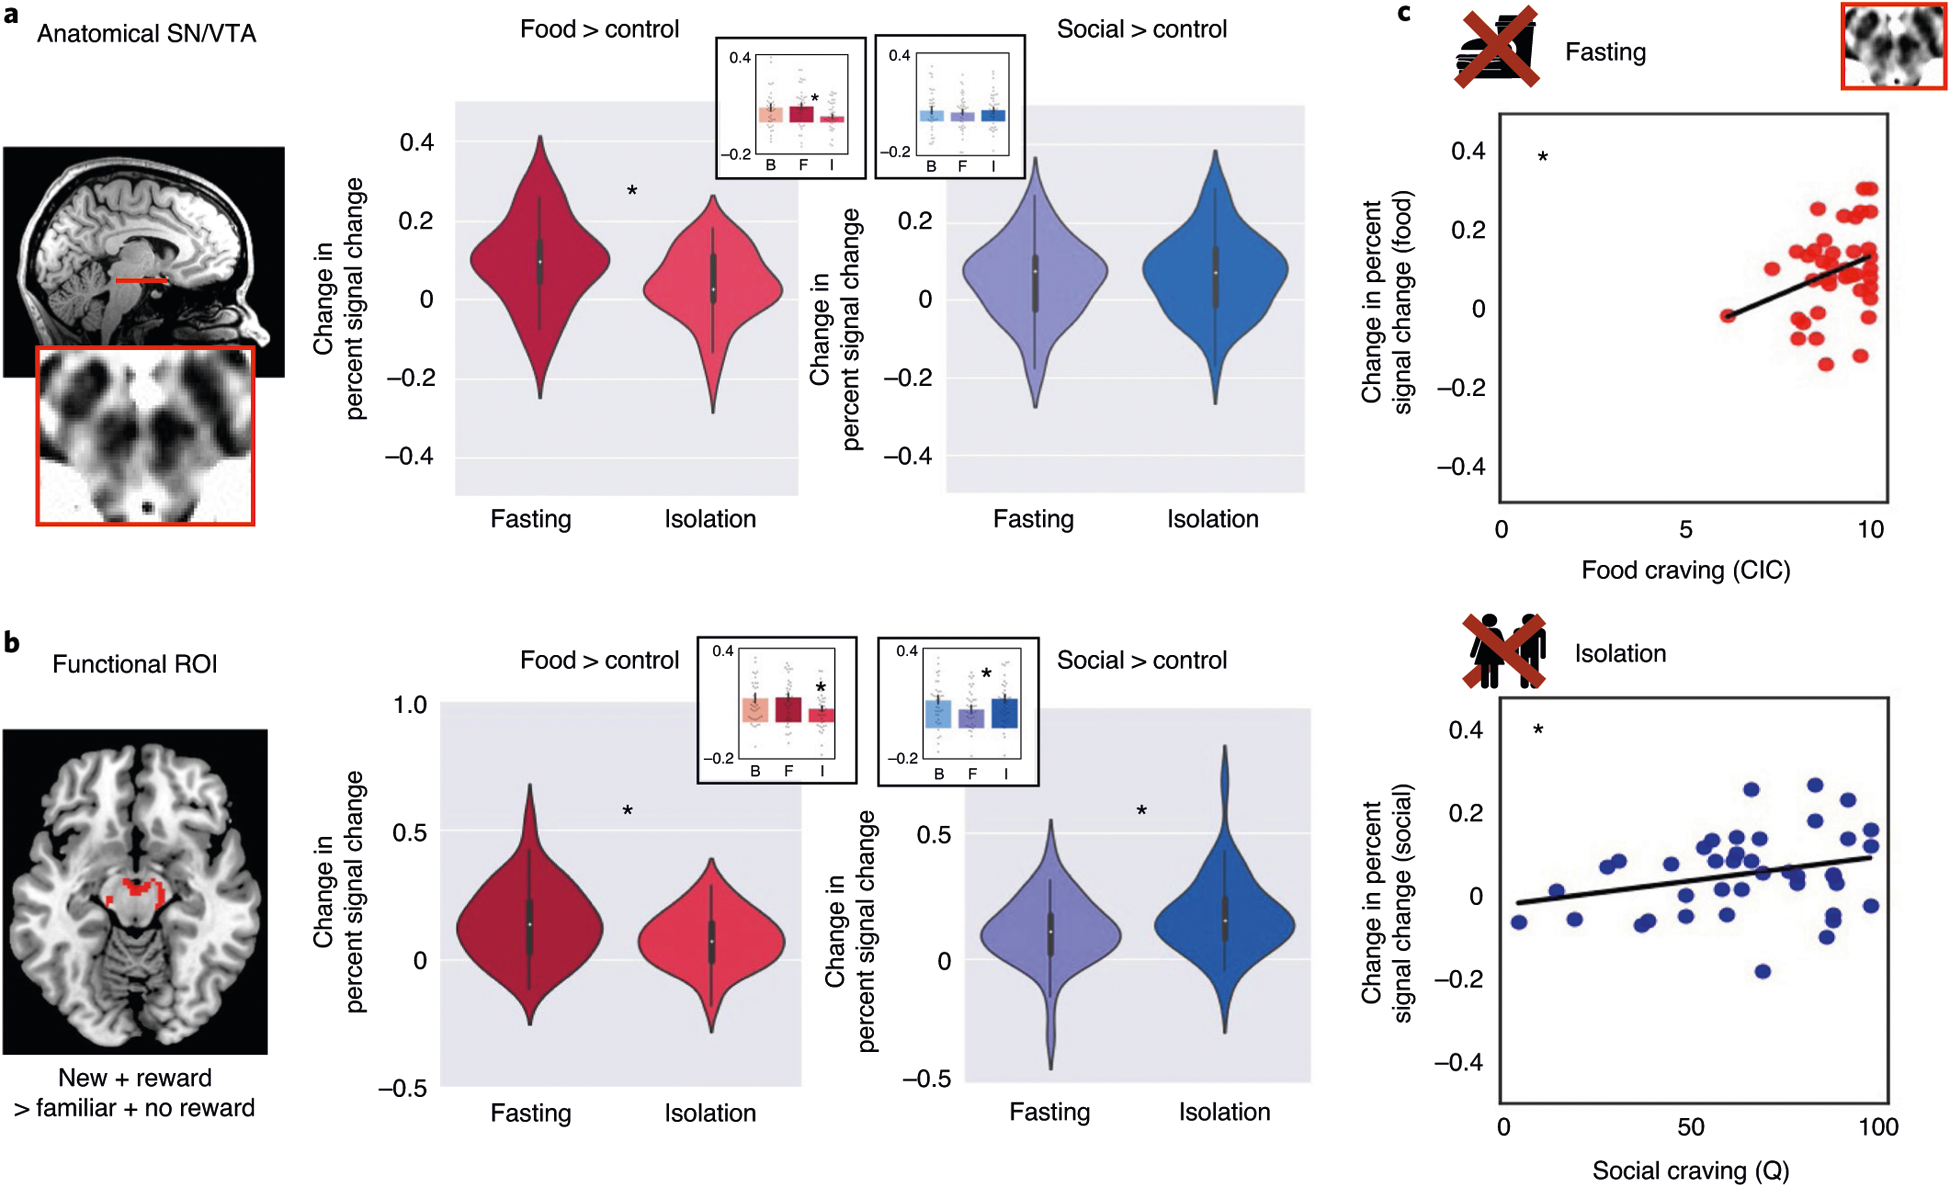
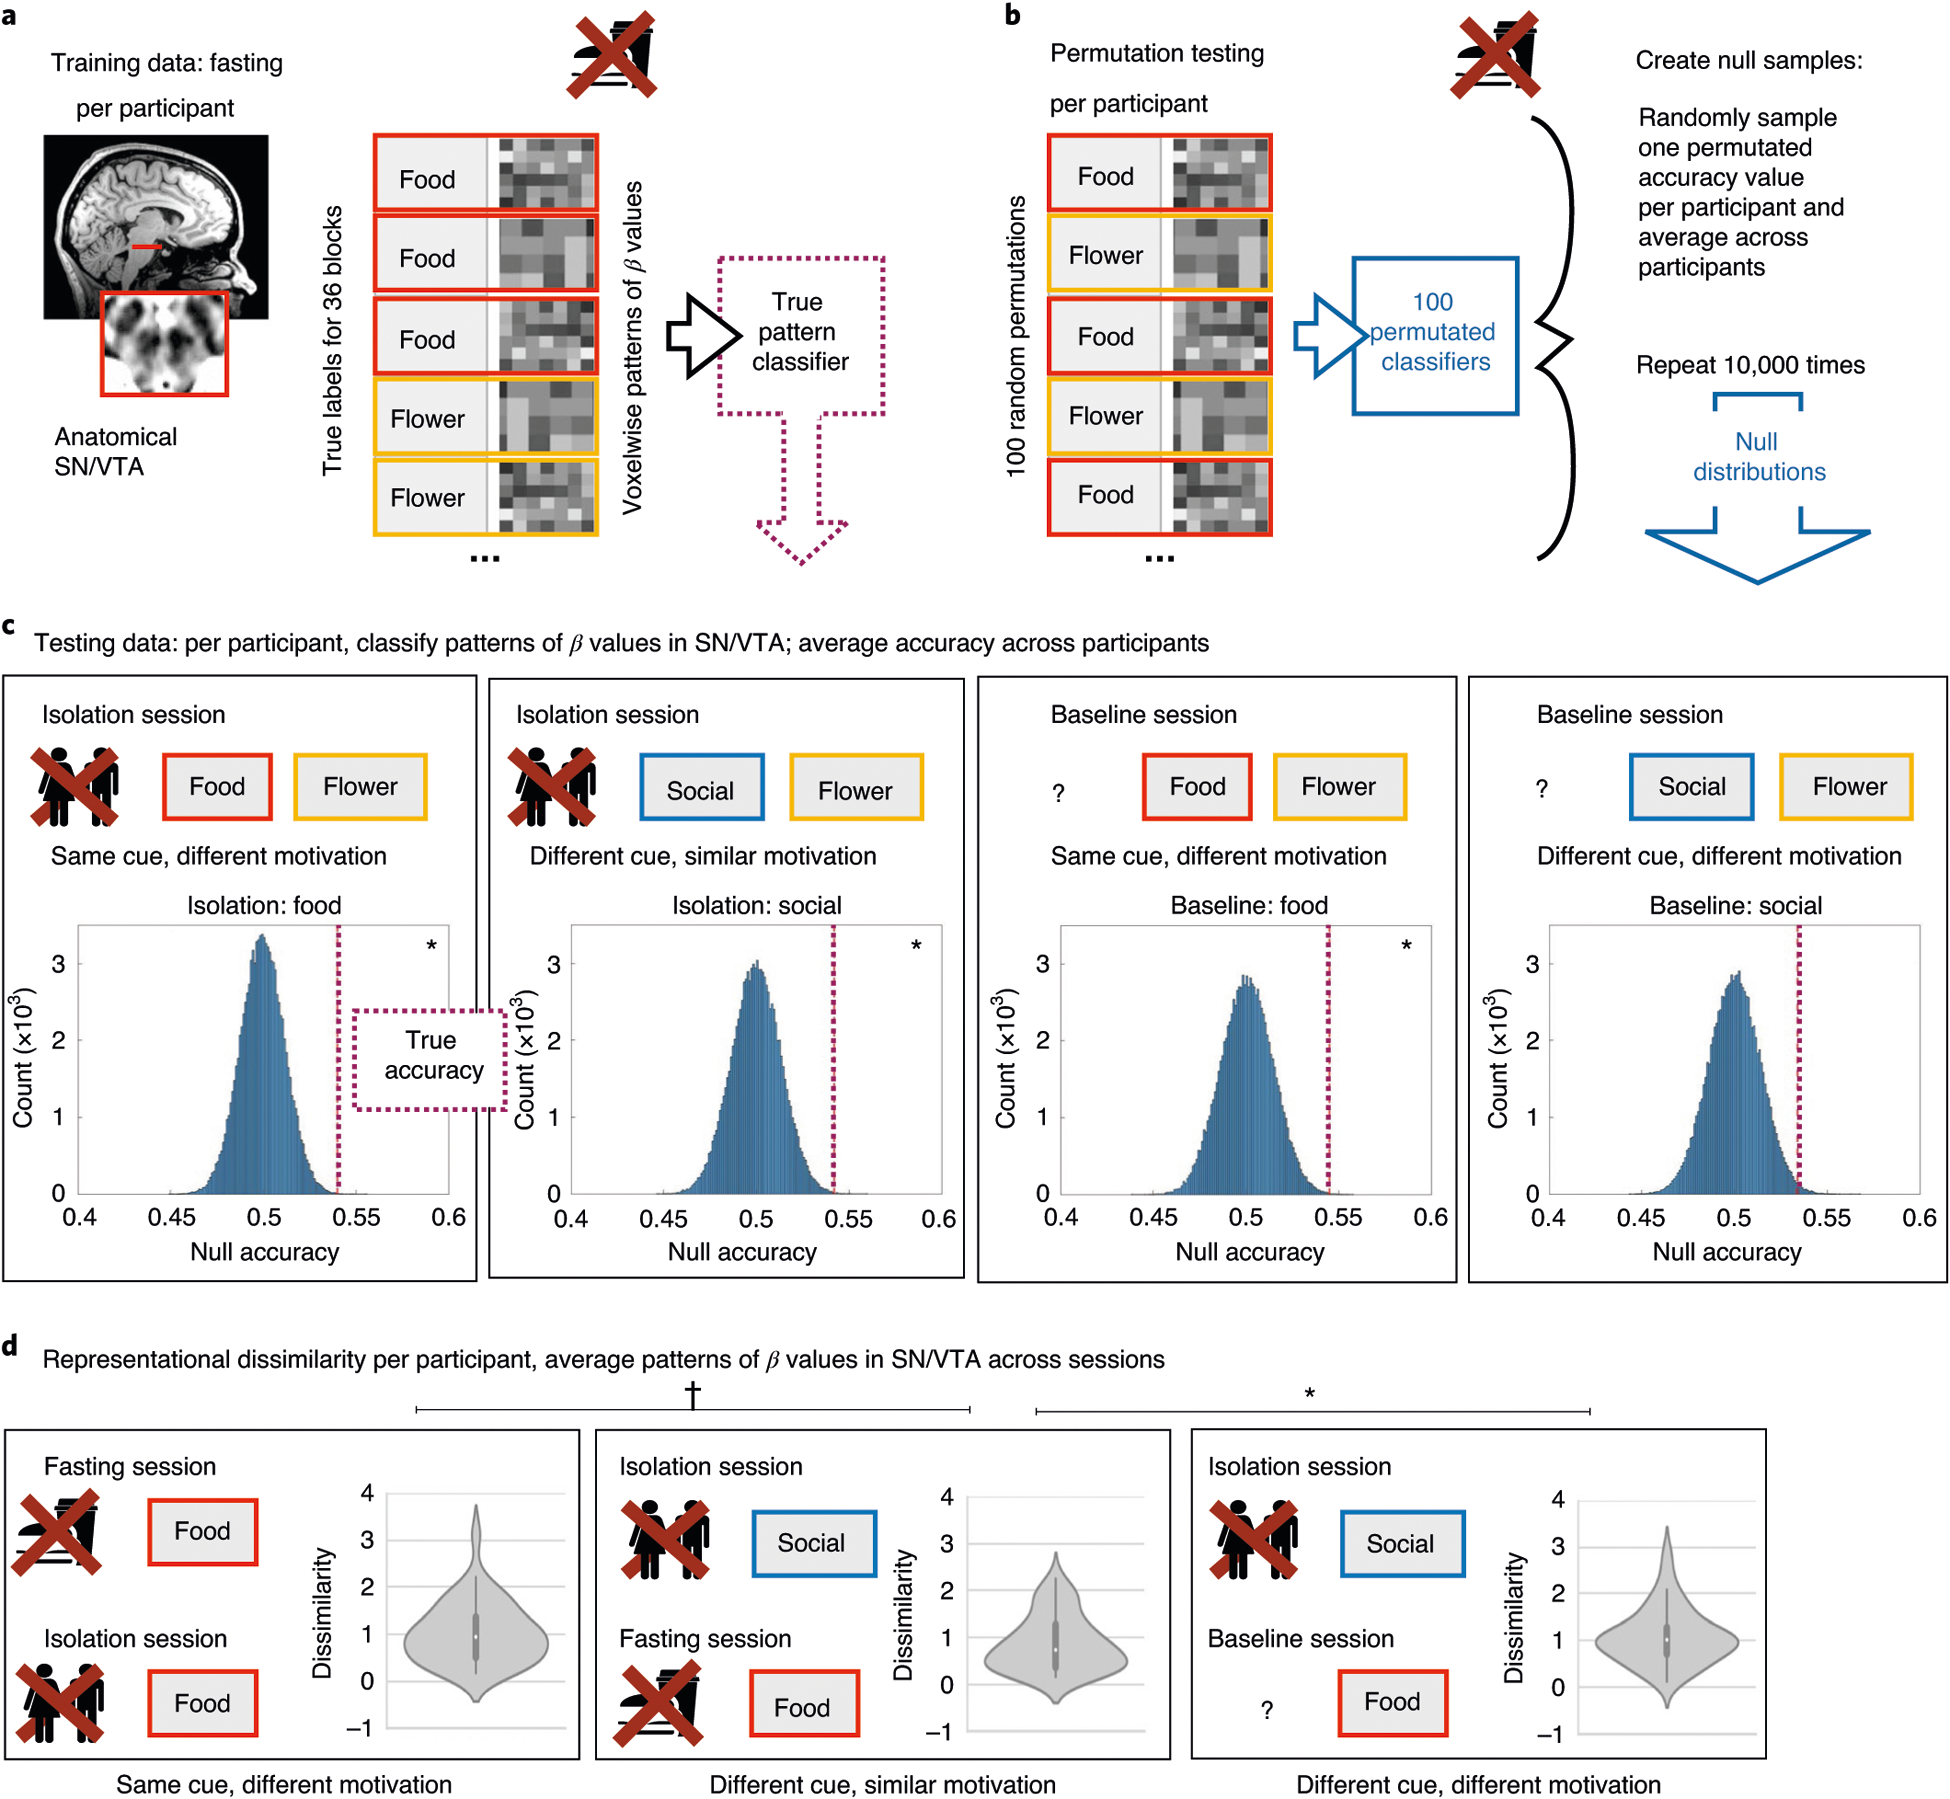
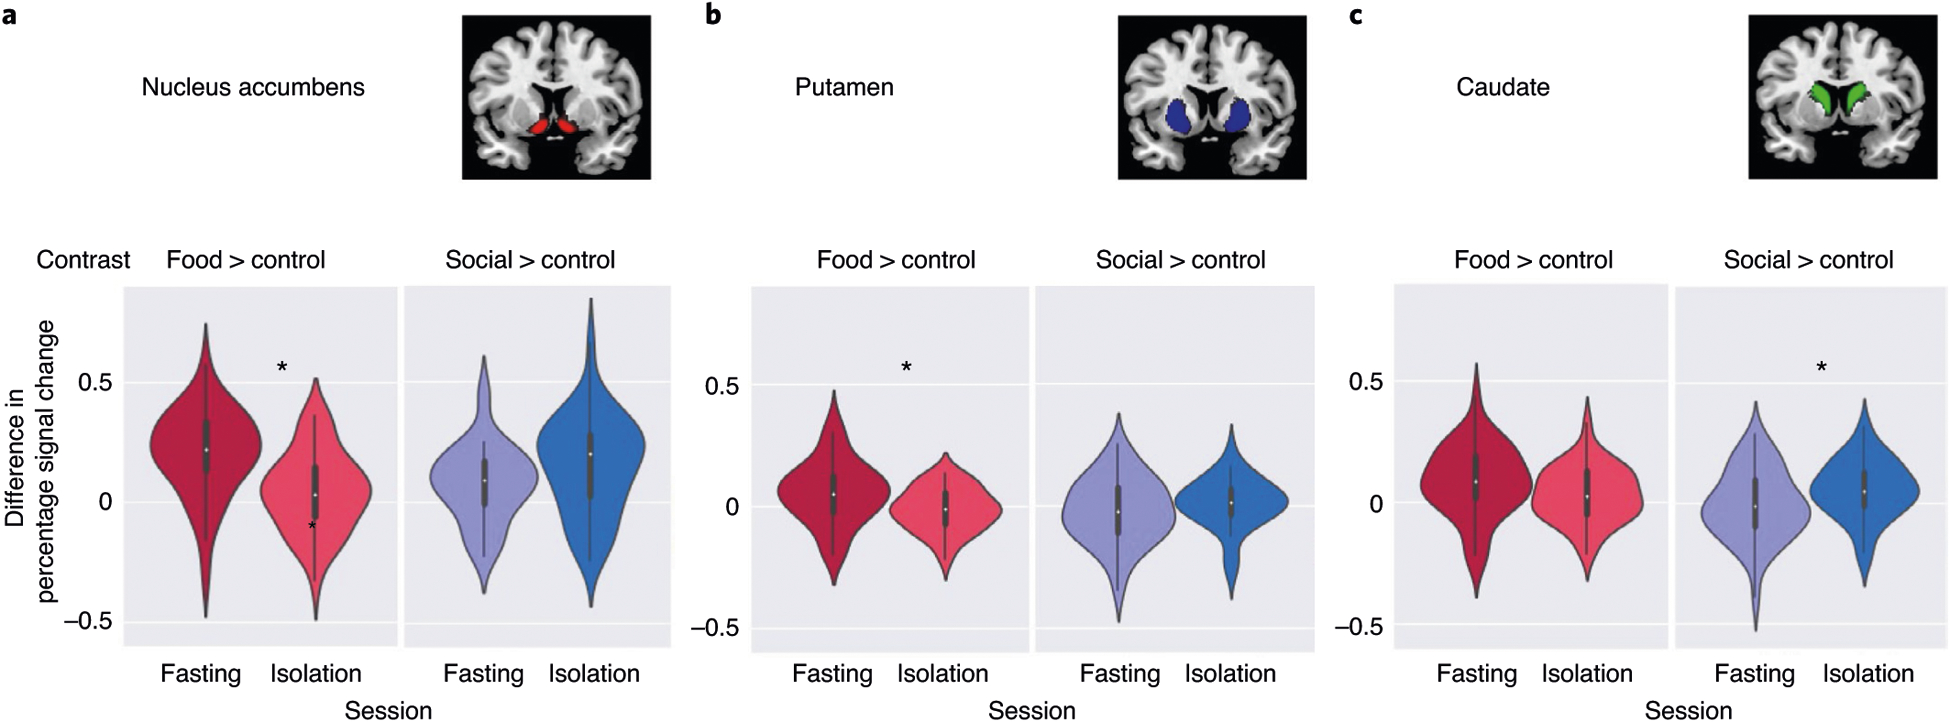
When people are forced to be isolated from each other, do they crave social interactions? To address this question, we used functional magnetic resonance imaging to measure neural responses evoked by food and social cues after participants (n = 40) experienced 10 h of mandated fasting or total social isolation. After isolation, people felt lonely and craved social interaction. Midbrain regions showed selective activation to food cues after fasting and to social cues after isolation; these responses were correlated with self-reported craving. By contrast, striatal and cortical regions differentiated between craving food and craving social interaction. Across deprivation sessions, we found that deprivation narrows and focuses the brain's motivational responses to the deprived target. Our results support the intuitive idea that acute isolation causes social craving, similar to the way fasting causes hunger.


Conflict of interest statement

Competing interests

The authors declare no competing interests.

Figures

Fig. 1 |
Fig. 1 |. Overview of the experimental procedures.
First, individuals underwent screening for their social connectedness (measured by social network size and self-reported loneliness; see Methods for details). each participant (n = 40) then underwent three experimental sessions: fasting, baseline and isolation (the order of sessions was counterbalanced across participants) and subsequently an MR scan with the CIC task. On the baseline day, participants also underwent a functional localizer task. In the CIC task, participants saw cues for social contact, food and control cues depicting flowers. After each block of cues (showing three images), participants rated their self-reported social craving (after social blocks), food craving (after food blocks) and how much they liked the flower pictures (after control blocks). In the functional localizer task, participants memorized a set of five images before the scan (four different sets of images were counterbalanced across participants). Immediately before the localizer task, participants were shown the memorized pictures again. During the task, participants saw either one of the memorized pictures or a new picture indicating whether or not they would be able to win money.
Fig. 2 |
Fig. 2 |. Behavioral results.
a, Changes in self-reported food craving over time during fasting (left; n = 37) and compared with ratings of social craving during the CIC task (right; n = 40). b, Changes in self-reported social craving over time during isolation (left; n = 40) and in comparison to ratings of food craving during the CIC task (right; n = 40). The boxplots in a and b indicate the median (dark center line), the interquartile range (IQR; box) and the 1.5× IQR minima and maxima (whiskers). Data points outside the whiskers are shown as individual data points.
Fig. 3 |
Fig. 3 |. Univariate activity in response to food fasting and social isolation.
ac, Data (n = 40) shown for the anatomical ROI (a), the functional ROI (b) and correlations with self-reported craving (c). The violin plots depict the difference (in percentage signal change) in response to food cues (contrast: food > flowers) and social cues (contrast: social > flowers) after fasting and isolation. The violin plots illustrate the distribution of the data, the white dots indicate the median, the bold dark-gay vertical line the IQR and the thin gray lines the 1.5× IQR minima and maxima. The insert barplots depict the contrast values for all three sessions: baseline (B), fasting (F) and isolation (I), showing the mean for each session. The error bars indicate the s.e.m. a, Responses in the anatomical SN/VTA were higher for food after fasting compared with isolation. b, Responses in the midbrain functional ROI were higher for food after fasting (compared with isolation) and for social cues after isolation (compared with fasting). c, In the anatomical SN/VTA, responses to food cues were correlated with craving reported in the CIC task, after fasting (top) and responses to social cues were correlated with craving reported on the final questionnaire, after isolation (bottom).
Fig. 4 |
Fig. 4 |. Multivoxel pattern analysis.
a, A linear classifier was trained to distinguish the pattern of activity across voxels in the anatomical SN/VTA of each participant (n = 40), in response to food and control cues after fasting. This classifier was then tested on patterns of activity in the same participant in the other two sessions. b, For comparison, we generated null distributions using permutation and bootstrapping procedures: first, we permutated the labels within runs for each participant’s training data, and then we tested the permutated classifier on each testing dataset. We created a null distribution by randomly sampling one of the permutated accuracies for each participant and then averaging the accuracy values across subjects. This procedure was repeated 105 times to generate the group-level null distributions. c, Null distributions for each testing dataset. The dotted red line shows the true accuracy value (that is, classification accuracy from the real classifier) for each testing dataset. The classifier was generalized to (that is, successfully decoded above chance) food cues (versus control cues) on both isolation and baseline days and to social cues (versus control cues) on the isolation day, but not on the baseline day. d, We directly compared the spatial pattern of activity for deprived and nondeprived cues. Note that these results show Fisher-transformed dissimilarity, a measure of representational distance, so lower numbers indicate a more similar spatial pattern. The violin plots illustrate the distribution of the data, the white dots indicate the median, the bold dark-gray vertical line the IQR and the thin gray lines the 1.5× IQR minima and maxima. Social cues after isolation were more similar to food cues after fasting than to food cues at baseline. Food cues after fasting were (trending) more similar to social cues after isolation than food cues after isolation. Both c and d show that the pattern of activity in SN/VTA is determined not only by the category of visual stimulus, but also by the motivational salience of the category, with craved cues evoking a similar pattern whether what is craved is food or social interaction.
Fig. 5 |
Fig. 5 |. Univariate activity in response to food fasting and social isolation within the striatum.
ac, The striatum was divided into three subregions: NAcc (a), Ca (b) and Pu (c). The violin plots depict the difference (in percentage signal change) in response to food cues (contrast: food > flowers) and social cues (contrast: social > flowers) after fasting and isolation, respectively. The violin plots illustrate the distribution of the data (n = 40), the white dots indicate the median, the bold dark-gray vertical line the IQR and the thin gray lines the 1.5× IQR minima and maxima.

References

    1. Hawkley LC & Cacioppo JT Loneliness and pathways to disease. Brain Behav. Immun 17, S98–S105 (2003). - PubMed
    1. Leigh-Hunt N et al. An overview of systematic reviews on the public health consequences of social isolation and loneliness. Public Health 152, 157–171 (2017). - PubMed
    1. Cacioppo JT, Hawkley LC & Thisted RA Perceived social isolation makes me sad: 5-year cross-lagged analyses of loneliness and depressive symptomatology in the Chicago Health, Aging, and Social Relations Study. Psychol. Aging 25, 453–463 (2010). - PMC - PubMed
    1. Wang J et al. Social isolation in mental health. Soc. Psychiatry Psychiatr. Epidemiol 52, 1451–1461 (2017). - PMC - PubMed
    1. Cacioppo JT, Cacioppo S & Boomsma DI Evolutionary mechanisms for loneliness. Cogn. Emot 28, 3–21 (2014). - PMC - PubMed

Publication types

MeSH terms