

Preeclampsia-Associated lncRNA INHBA-AS1 Regulates the Proliferation, Invasion, and Migration of Placental Trophoblast Cells
- PMID: 33230466
- PMCID: PMC7585871
- DOI: 10.1016/j.omtn.2020.09.033
Preeclampsia-Associated lncRNA INHBA-AS1 Regulates the Proliferation, Invasion, and Migration of Placental Trophoblast Cells
Abstract
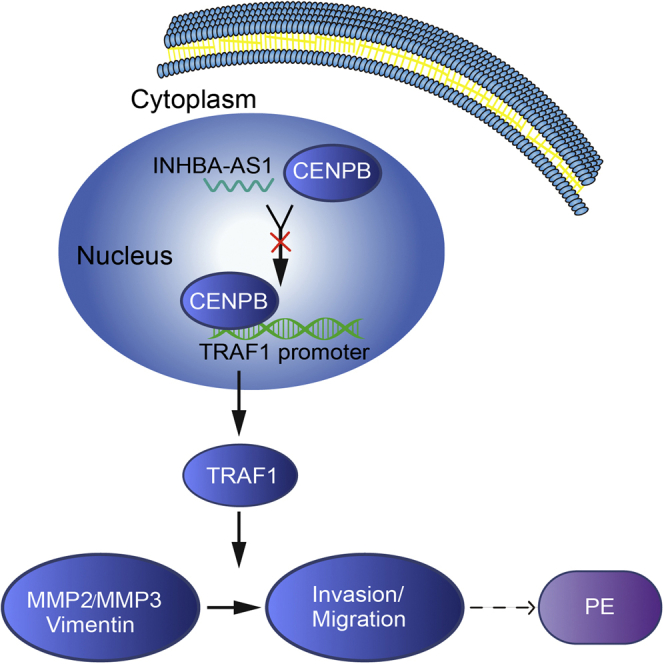
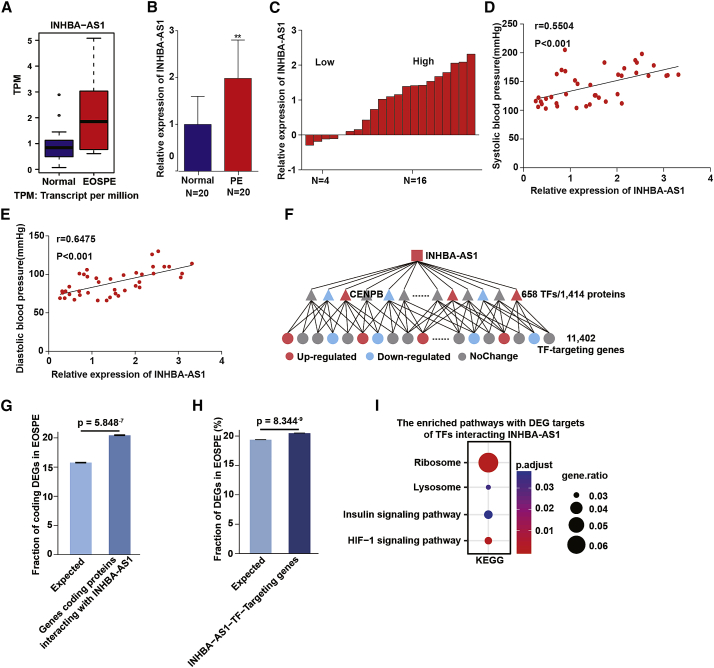
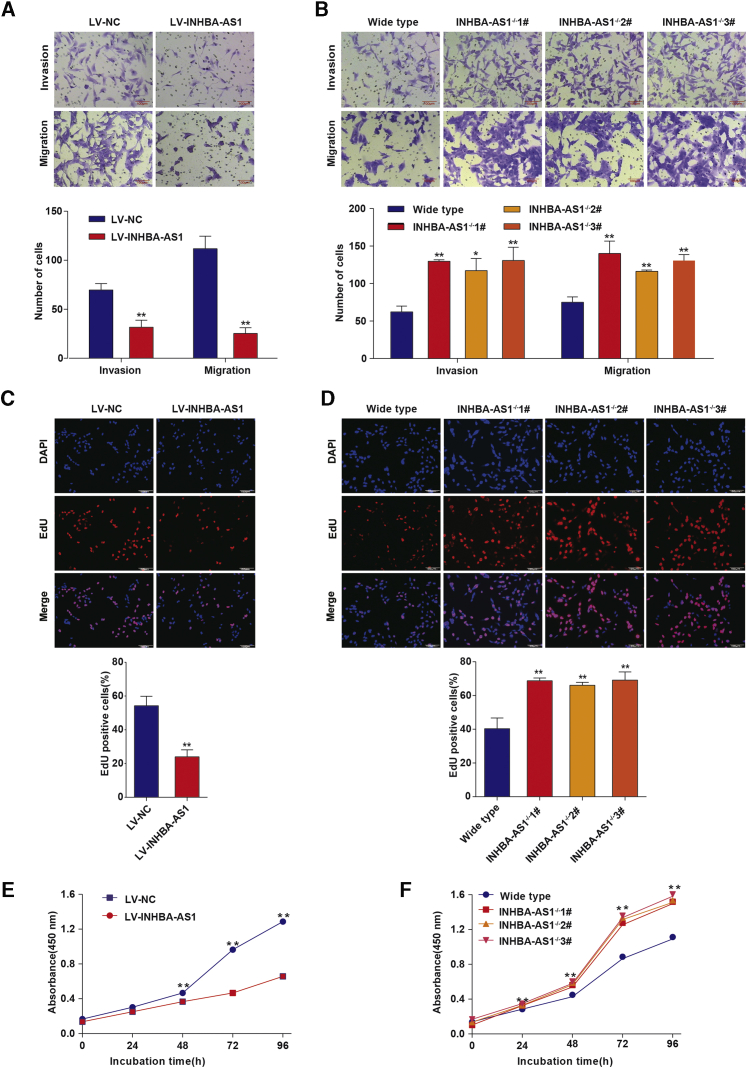
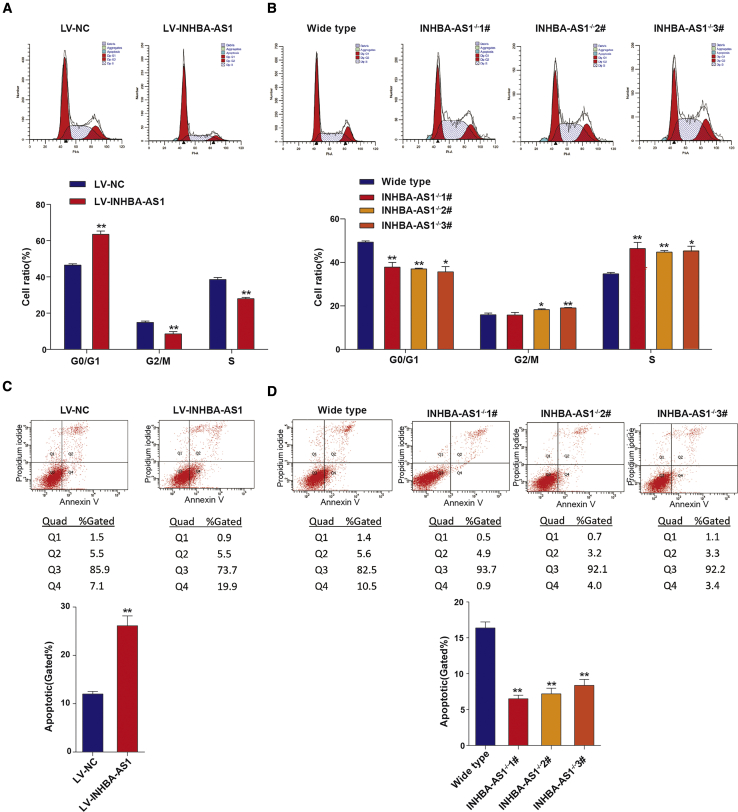
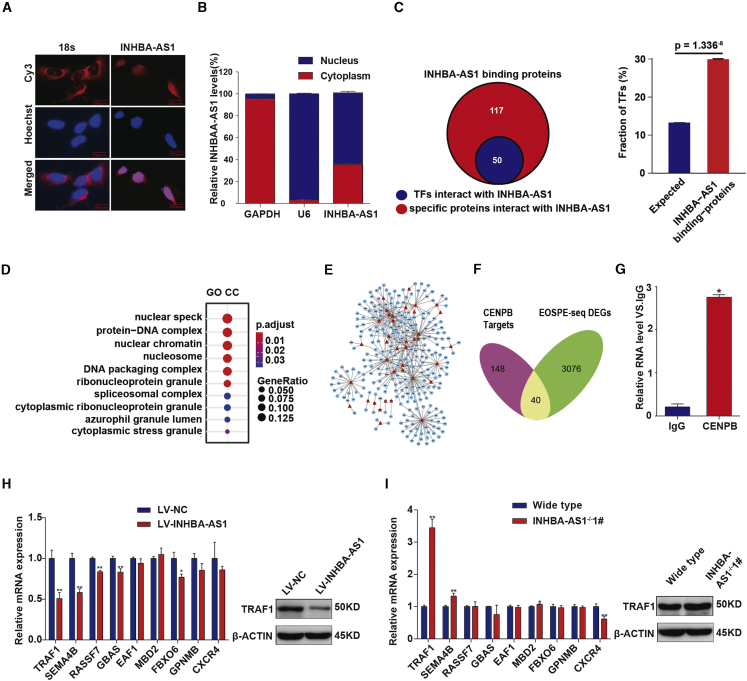
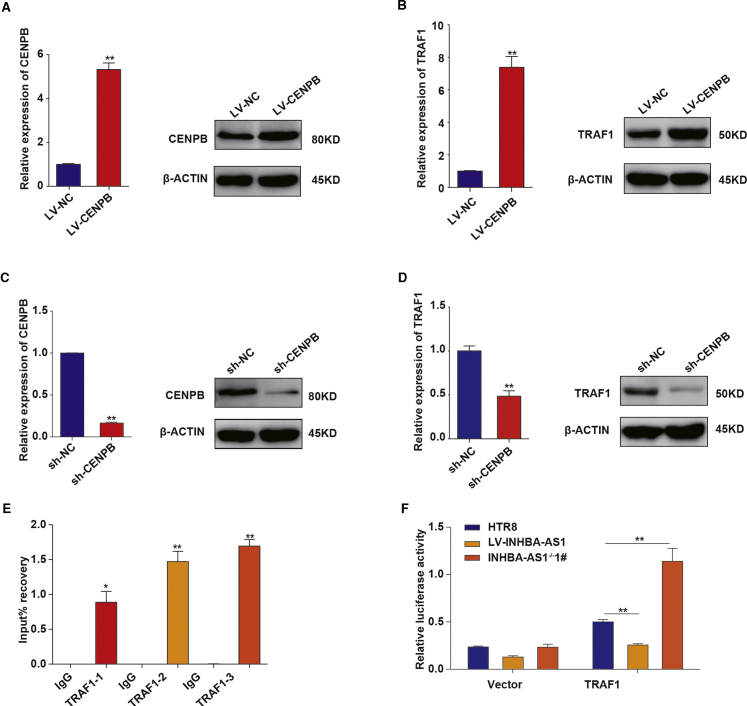
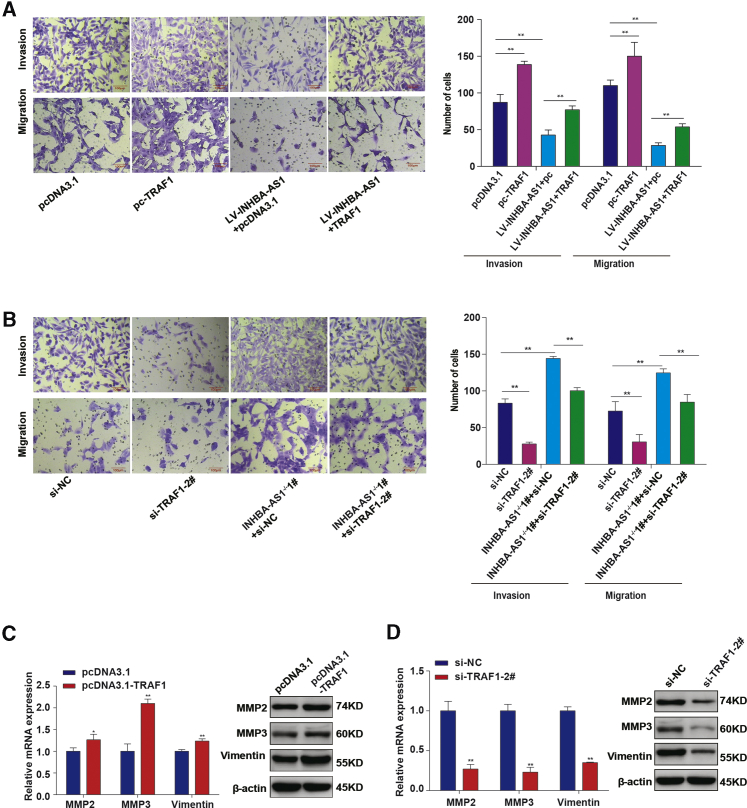
Preeclampsia is believed to be caused by impaired placentation with insufficient trophoblast invasion, leading to impaired uterine spiral artery remodeling and angiogenesis. However, the underlying molecular mechanism remains unknown. We recently carried out transcriptome profiling of placental long noncoding RNAs (lncRNAs) and identified 383 differentially expressed lncRNAs in early-onset severe preeclampsia. Here, we are reporting our identification of lncRNA INHBA-AS1 as a potential causal factor of preeclampsia and its downstream pathways that may be involved in placentation. We found that INHBA-AS1 was upregulated in patients and positively correlated with clinical severity. We systematically searched for potential INHBA-AS1-binding transcription factors and their targets in databases and found that the targets were enriched with differentially expressed genes in the placentae of patients. We further demonstrated that the lncRNA INHBA-AS1 inhibited the invasion and migration of trophoblast cells through restraining the transcription factor CENPB from binding to the promoter of TNF receptor-associated factor 1 (TRAF1). Therefore, we have identified the dysregulated pathway "INHBA-AS1-CENPB-TRAF1" as a contributor to the pathogenesis of preeclampsia through prohibiting the proliferation, invasion, and migration of trophoblasts during placentation.
Keywords: cell invasion; cell migration; long noncoding RNA; placenta; preeclampsia; transcriptome; trophoblast.
© 2020 The Author(s).
Figures
Similar articles
-
Association of lncRNA SH3PXD2A-AS1 with preeclampsia and its function in invasion and migration of placental trophoblast cells.Cell Death Dis. 2020 Jul 27;11(7):583. doi: 10.1038/s41419-020-02796-0. Cell Death Dis. 2020. PMID: 32719429 Free PMC article.
-
Small extracellular vesicles-transported lncRNA TDRKH-AS1 derived from AOPPs-treated trophoblasts initiates endothelial cells pyroptosis through PDIA4/DDIT4 axis in preeclampsia.J Transl Med. 2023 Jul 24;21(1):496. doi: 10.1186/s12967-023-04346-6. J Transl Med. 2023. PMID: 37488572 Free PMC article.
-
LncRNA INHBA-AS1 promotes cell growth, migration, and invasion of oral squamous cell carcinoma by sponging miR-143-3p.Eur Rev Med Pharmacol Sci. 2020 Feb;24(4):1821-1828. doi: 10.26355/eurrev_202002_20360. Eur Rev Med Pharmacol Sci. 2020. Retraction in: Eur Rev Med Pharmacol Sci. 2020 Sep;24(18):9240. doi: 10.26355/eurrev_202009_23000. PMID: 32141551 Retracted.
-
Emerging role for dysregulated decidualization in the genesis of preeclampsia.Placenta. 2017 Dec;60:119-129. doi: 10.1016/j.placenta.2017.06.005. Epub 2017 Jun 9. Placenta. 2017. PMID: 28693893 Free PMC article. Review.
-
Why is placentation abnormal in preeclampsia?Am J Obstet Gynecol. 2015 Oct;213(4 Suppl):S115-22. doi: 10.1016/j.ajog.2015.08.042. Am J Obstet Gynecol. 2015. PMID: 26428489 Free PMC article. Review.
Cited by
-
Decidualization of human endometrial stromal cells requires steroid receptor coactivator-3.Front Reprod Health. 2022 Nov 24;4:1033581. doi: 10.3389/frph.2022.1033581. eCollection 2022. Front Reprod Health. 2022. PMID: 36505394 Free PMC article.
-
lncRNA PROX1-AS1 mediates the migration and invasion of placental trophoblast cells via the miR-211-5p/caspase-9 axis.Bioengineered. 2021 Dec;12(1):4100-4110. doi: 10.1080/21655979.2021.1953213. Bioengineered. 2021. PMID: 34288800 Free PMC article.
-
Advances in pathogenesis of preeclampsia.Arch Gynecol Obstet. 2024 May;309(5):1815-1823. doi: 10.1007/s00404-024-07393-6. Epub 2024 Feb 29. Arch Gynecol Obstet. 2024. PMID: 38421424
-
LINC00240/miR-155 axis regulates function of trophoblasts and M2 macrophage polarization via modulating oxidative stress-induced pyroptosis in preeclampsia.Mol Med. 2022 Sep 24;28(1):119. doi: 10.1186/s10020-022-00531-3. Mol Med. 2022. PMID: 36153499 Free PMC article.
-
AC092100.1 promotes angiogenesis in pre-eclampsia through YTHDC2/VEGFA signaling.Funct Integr Genomics. 2024 Sep 6;24(5):157. doi: 10.1007/s10142-024-01428-6. Funct Integr Genomics. 2024. PMID: 39237822
References
-
- Khan K.S., Wojdyla D., Say L., Gülmezoglu A.M., Van Look P.F. WHO analysis of causes of maternal death: a systematic review. Lancet. 2006;367:1066–1074. - PubMed
-
- World Health Organization . World Health Organization; 2011. WHO Recommendations for Prevention and Treatment of Pre-Eclampsia and Eclampsia. - PubMed
-
- Zeeman G.G. Neurologic complications of pre-eclampsia. Semin. Perinatol. 2009;33:166–172. - PubMed
LinkOut - more resources
Full Text Sources
