Comparative Study
. 2020 Nov 24:9:e54501.
doi: 10.7554/eLife.54501.

Semiochemical responsive olfactory sensory neurons are sexually dimorphic and plastic

Affiliations
Comparative Study

Semiochemical responsive olfactory sensory neurons are sexually dimorphic and plastic

Aashutosh Vihani et al. Elife. .

Abstract

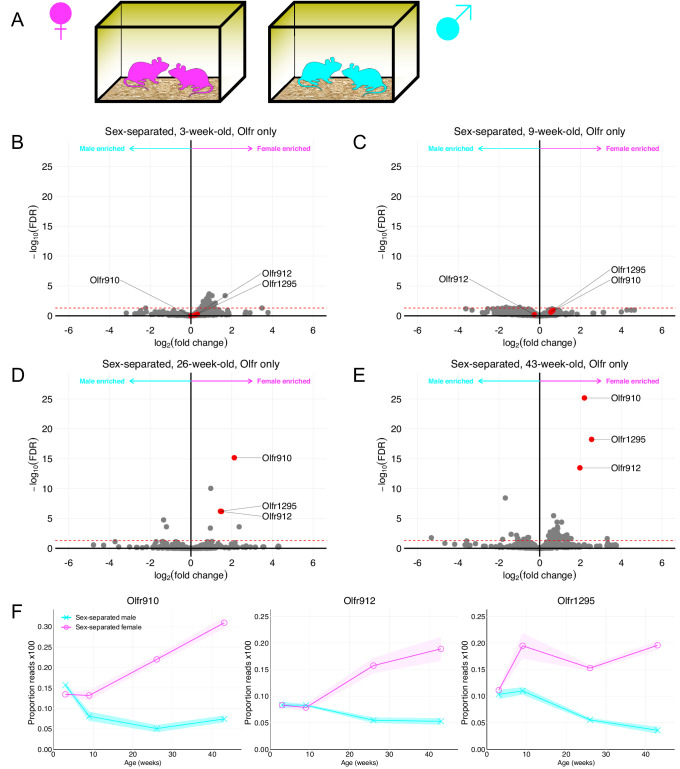
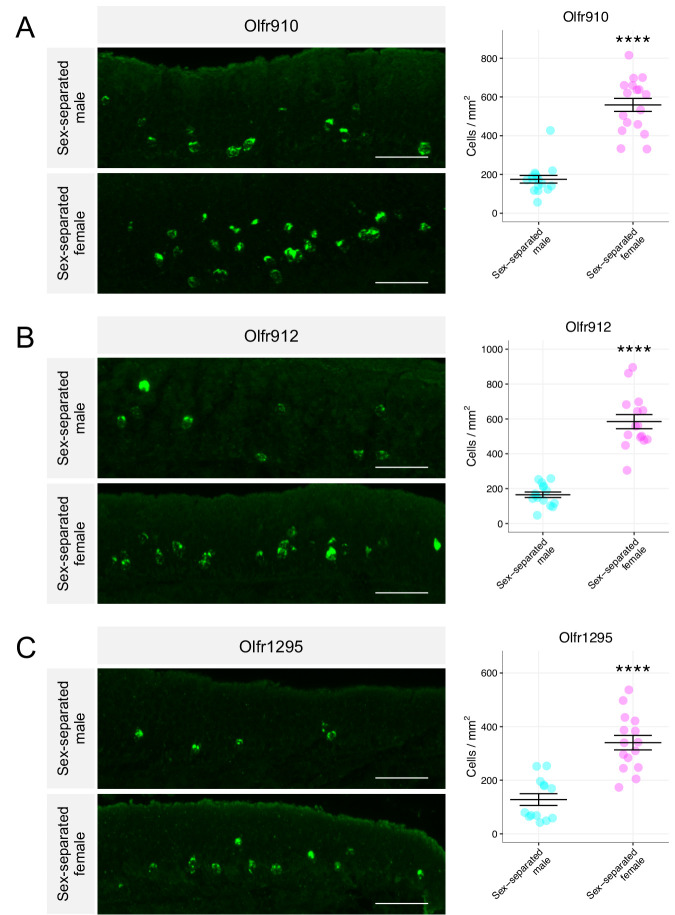
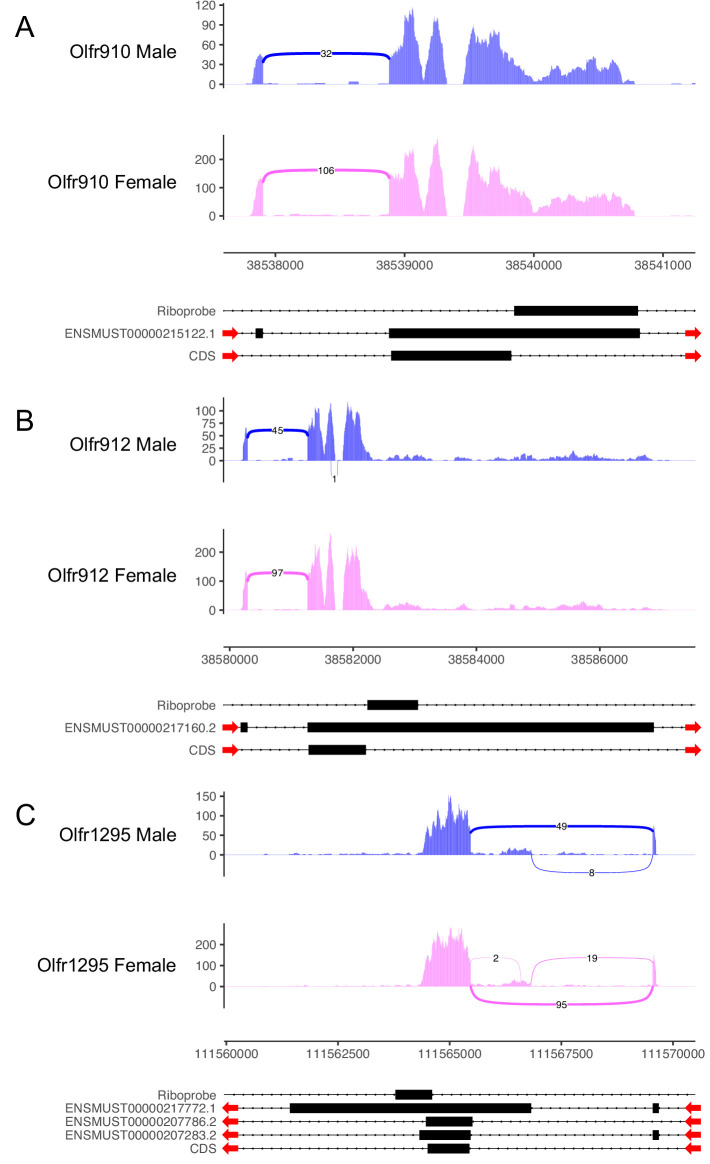
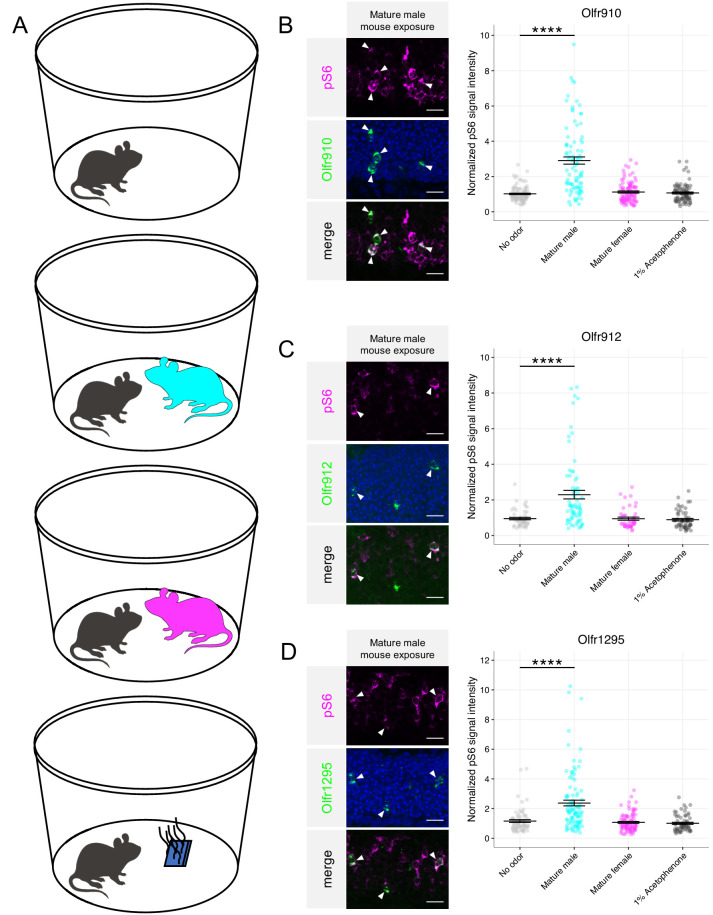
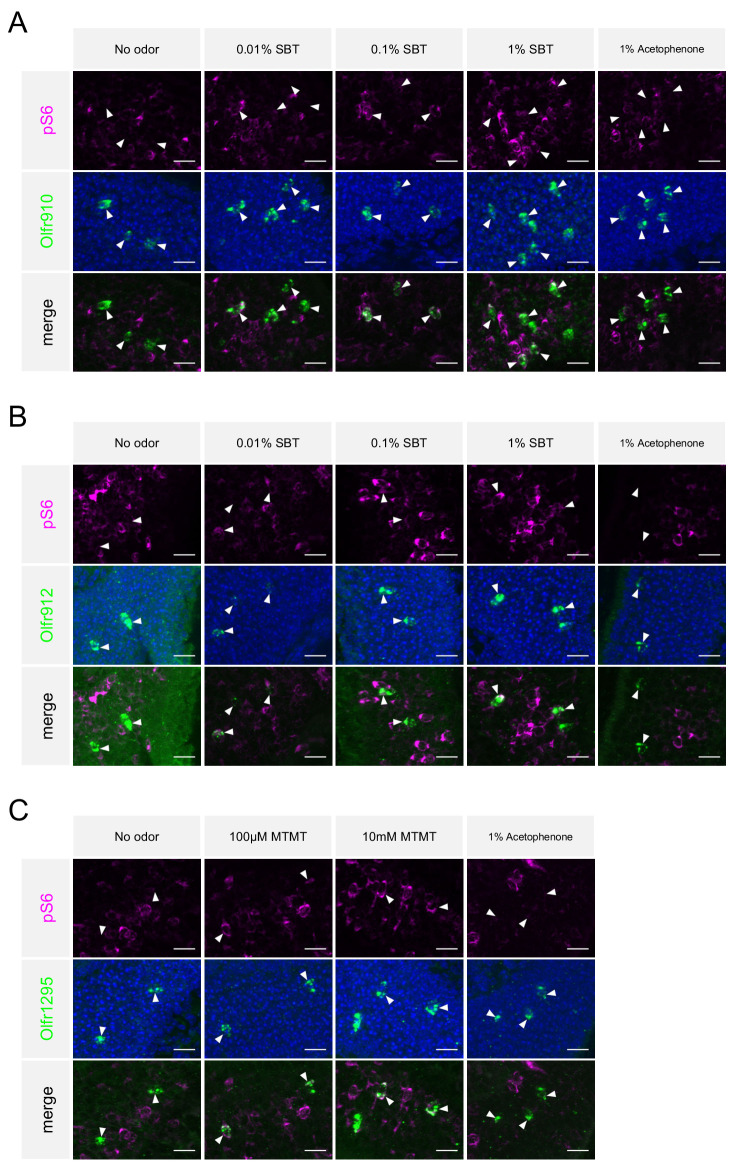
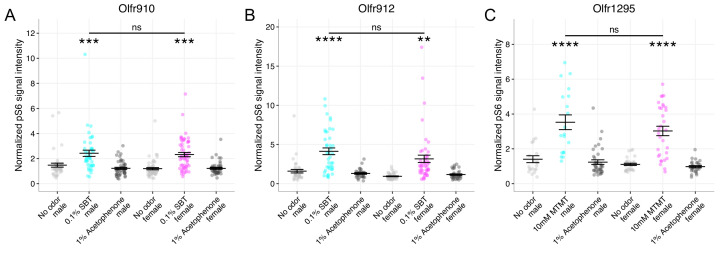
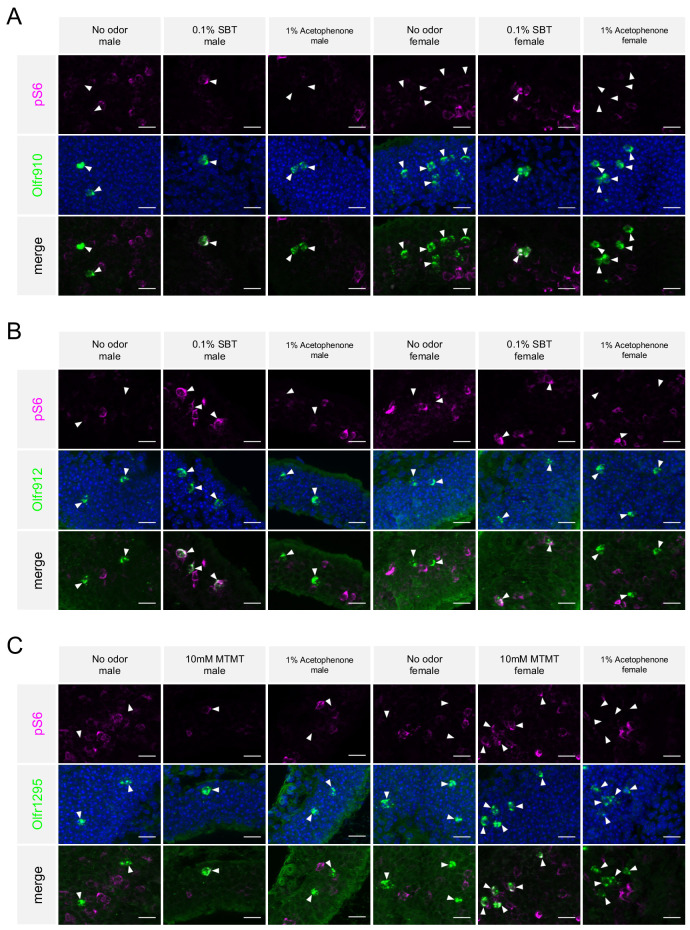
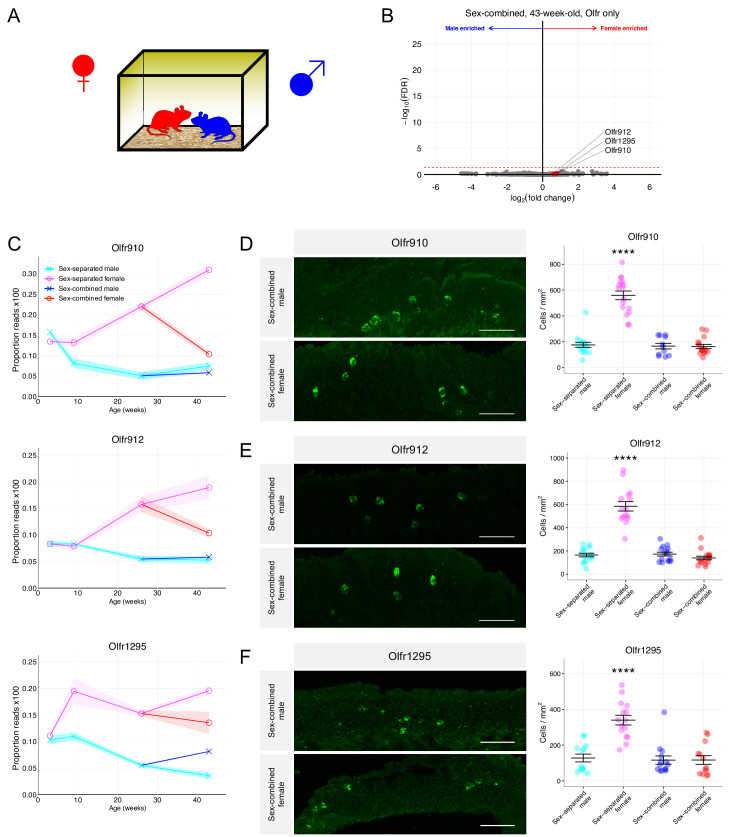
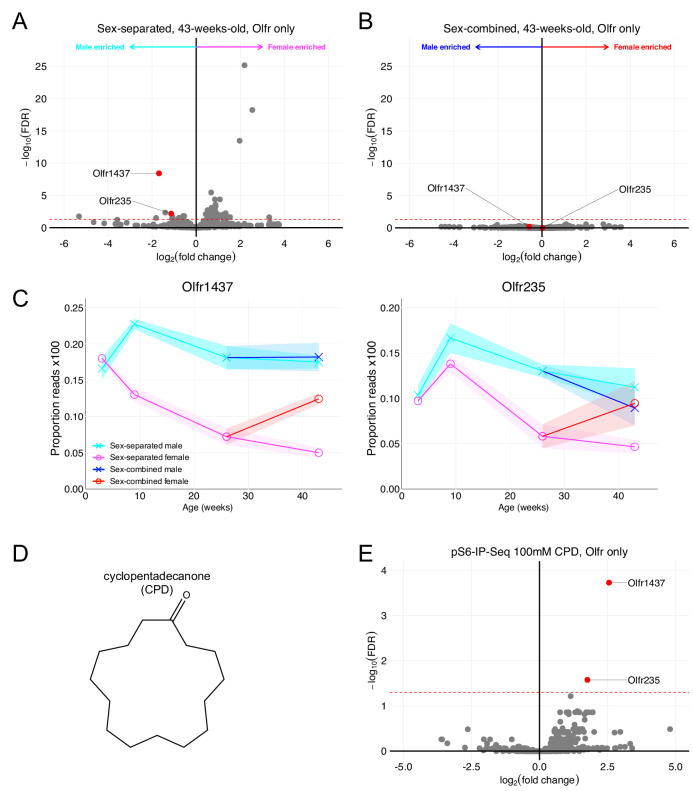
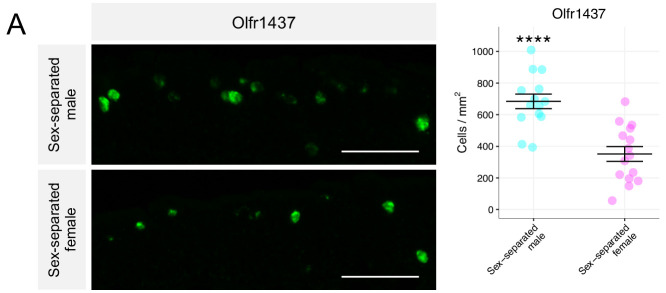
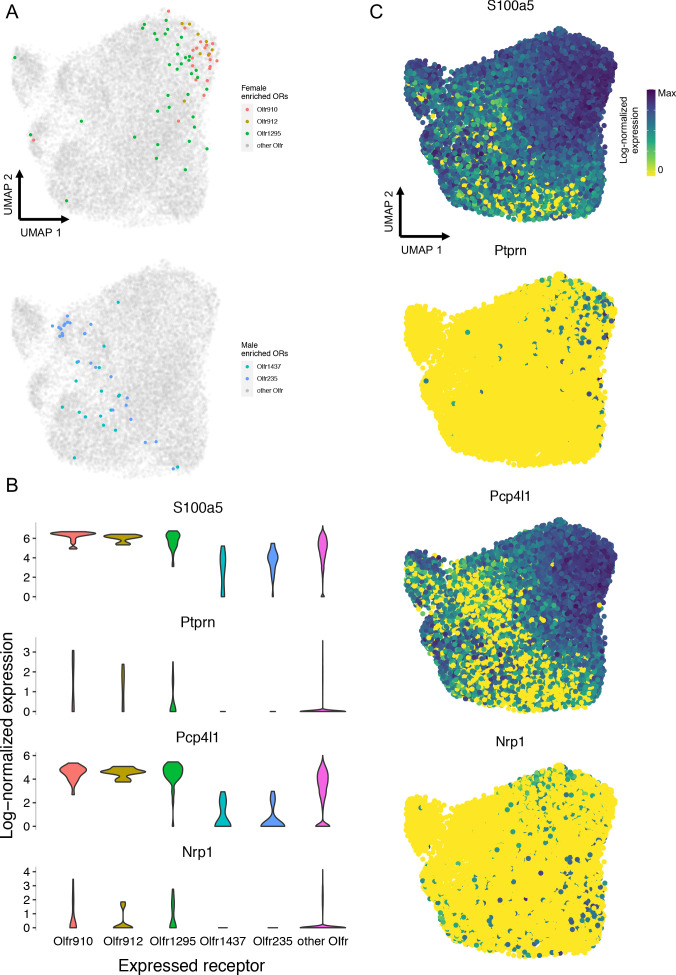
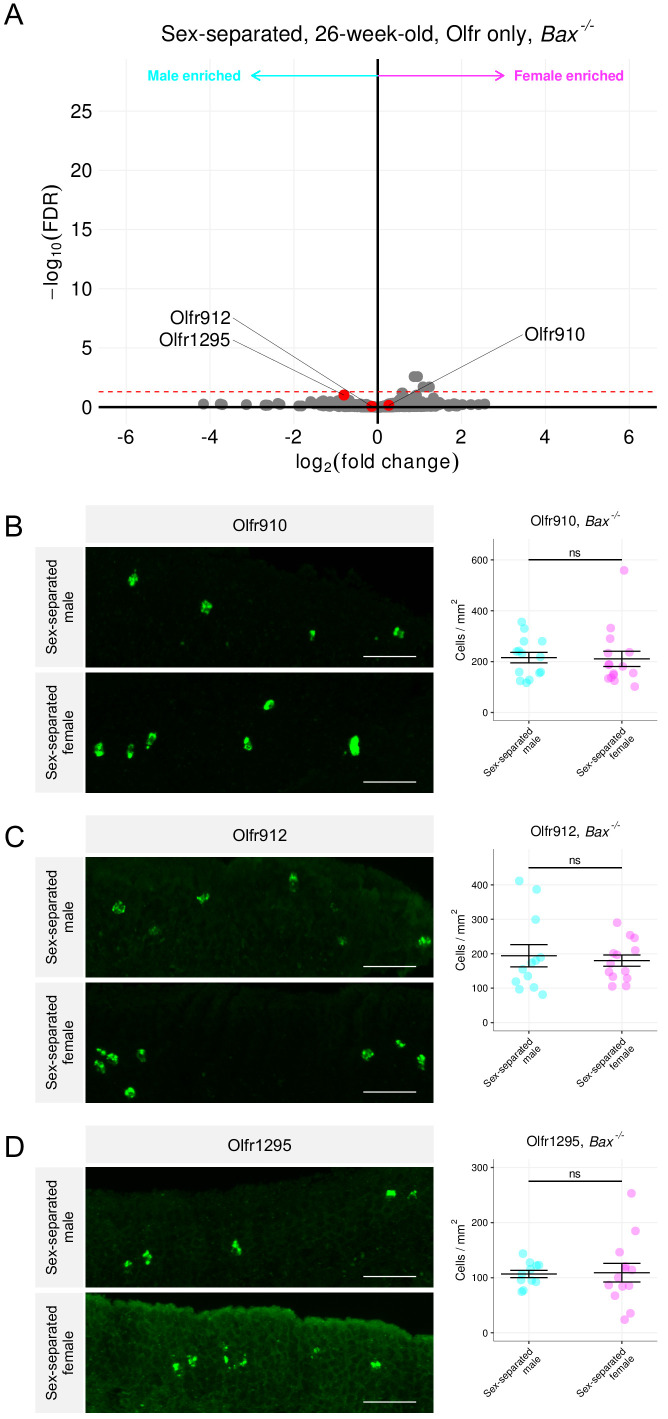
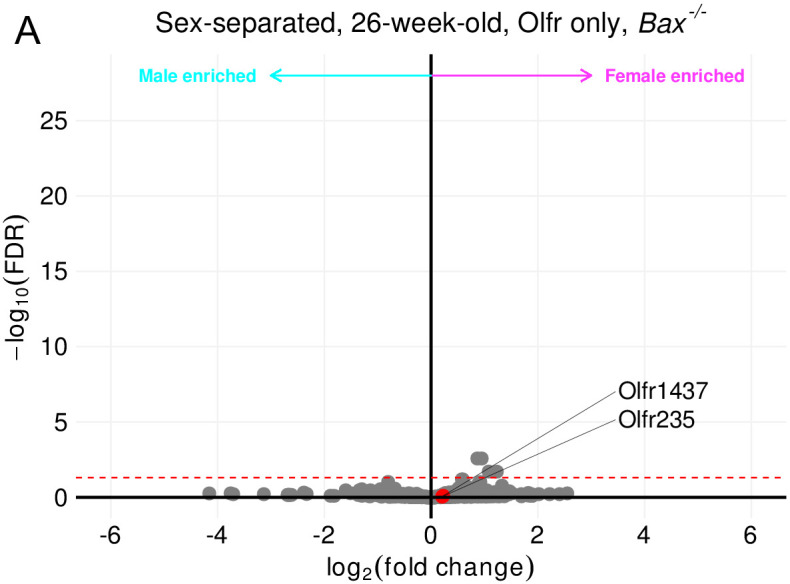
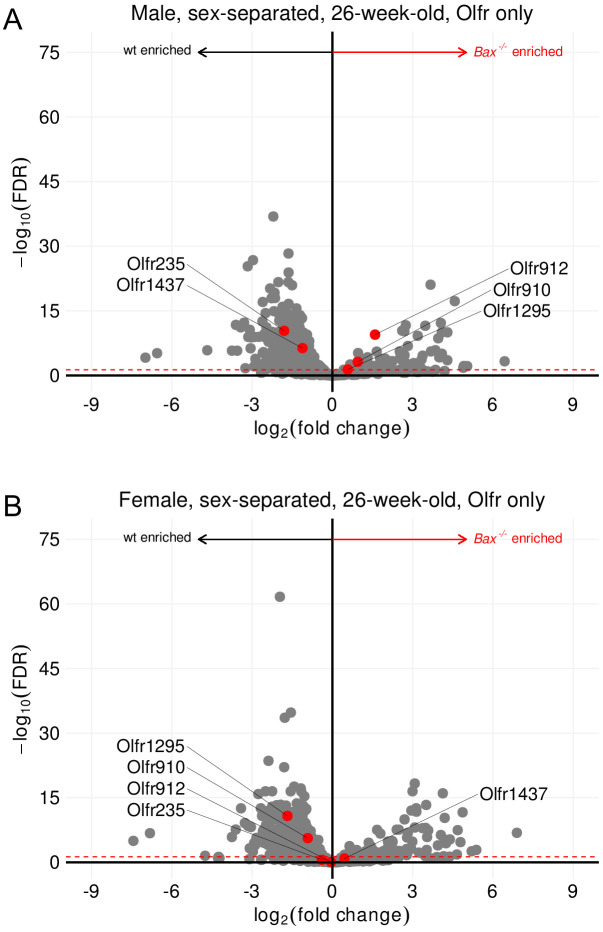
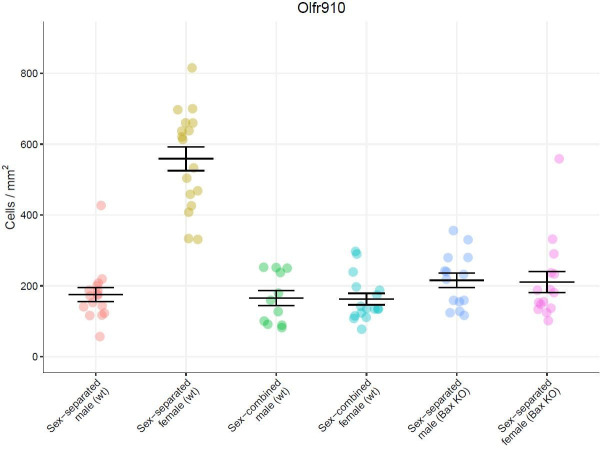
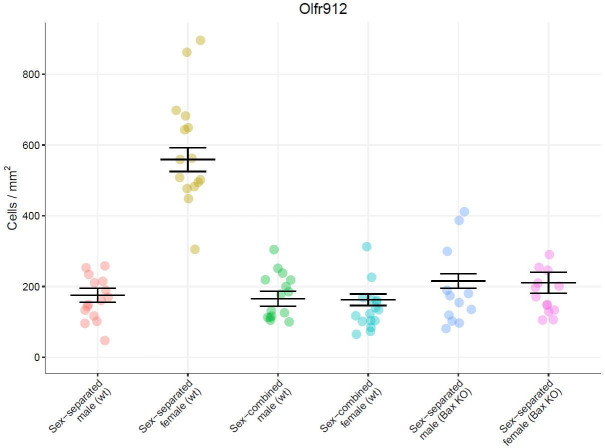
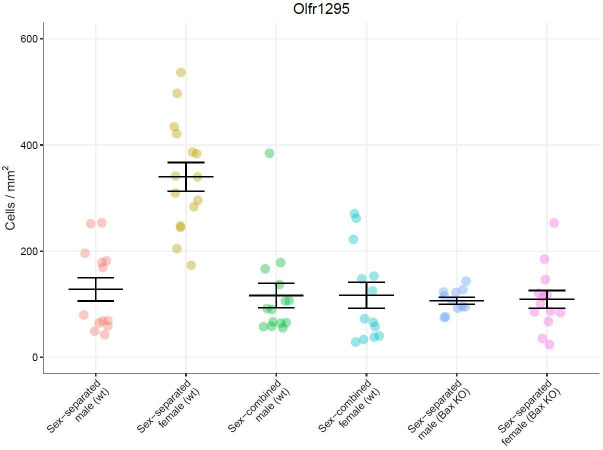
Understanding how genes and experience work in concert to generate phenotypic variability will provide a better understanding of individuality. Here, we considered this in the main olfactory epithelium, a chemosensory structure with over a thousand distinct cell types in mice. We identified a subpopulation of olfactory sensory neurons, defined by receptor expression, whose abundances were sexually dimorphic. This subpopulation of olfactory sensory neurons was over-represented in sex-separated mice and robustly responsive to sex-specific semiochemicals. Sex-combined housing led to an attenuation of the dimorphic representations. Single-cell sequencing analysis revealed an axis of activity-dependent gene expression amongst a subset of the dimorphic OSN populations. Finally, the pro-apoptotic gene Baxwas necessary to generate the dimorphic representations. Altogether, our results suggest a role of experience and activity in influencing homeostatic mechanisms to generate a robust sexually dimorphic phenotype in the main olfactory epithelium.

Keywords: mouse; neuroscience; olfaction; olfactory receptor; pheromone; plasticity; semiochemical; sex differences.


Conflict of interest statement

AV, XH, SG, SK, EB No competing interests declared, HM HM receives royalties from Chemcom.

Figures

Figure 1.
Figure 1.. Identification of ORs exhibiting sexually dimorphic expression in sex-separated mice.
(A) Schematic of the housing setup. For sex-separation, male mice were co-housed exclusively with male mice. Female mice were co-housed exclusively with female mice. (B) Volcano plot comparing expression of Olfrs between 3-week-old sex-separated male and female mice. Olfr910, Olfr912, and Olfr1295 are highlighted in red. The red dashed line indicates an FDR = 0.05. Data are from n = 3 male and n = 3 female mice. (C) Volcano plot comparing expression of Olfrs between 9-week-old sex-separated male and female mice. (D) Volcano plot comparing expression of Olfrs between 26-week-old sex-separated male and female mice. (E) Volcano plot comparing expression of Olfrs between 43-week-old sex-separated male and female mice. (F) Longitudinal plotting of the mean and SEM of proportions of reads aligned to Olfr910, Olfr912, and Olfr1295 in sex-separated male and female mice.
Figure 2.
Figure 2.. Sexually dimorphic expression of ORs is consistent with a change in the number of OSNs expressing those ORs.
(A) Left: representative in situ mRNA hybridization pictures probing for the expression of Olfr910 in 43-week-old sex-separated male (top) and female (bottom) mice. Scale bars indicate 50 μm. Right: summary data showing mean and SEM of the density of OSNs expressing Olfr910 in 43-week-old male and female mice. An unpaired two-tailed t-test revealed statistical difference (****p < 0.0001) between males and females. Data are from n = 3 male and n = 3 female mice. (B) Representative in situ mRNA hybridization pictures probing for the expression of Olfr912 in 43-week-old sex-separated male (top) and female (bottom) mice. Right: summary data showing mean and SEM of the density of OSNs expressing Olfr912 in 43-week-old male and female mice. An unpaired two-tailed t-test revealed statistical difference (****p < 0 .0001) between males and females. (C) Left: representative in situ mRNA hybridization pictures probing for the expression of Olfr1295 in 43-week-old sex-separated male (top) and female (bottom) mice. Right: summary data showing mean and SEM of the density of OSNs expressing Olfr1295 in 43-week-old male and female mice. An unpaired two-tailed t-test revealed statistical difference(****p < 0 .0001) between males and females.
Figure 2—figure supplement 1.
Figure 2—figure supplement 1.. Architecture of reads uniquely mapping to female-enriched ORs.
(A) Architecture of reads uniquely mapped to Olfr910 in male and female mice. Shown are the defined transcript variants, coding sequence (CDS), uniquely designed riboprobe, and 5′ to 3′ directionality (red arrows). The y-axis shows the number of mapped reads along genomic coordinates described on the x-axis. Reads crossing exon junctions are also quantified. (B) Architecture of reads uniquely mapped to Olfr912. (C) Architecture of reads uniquely mapped to Olfr1295.
Figure 3.
Figure 3.. Sexually dimorphic ORs are activated by mature male mouse odor.
(A) Schematic of exposure experiment. A juvenile mouse (black) was exposed to (in descending order) a clean environment, mature male mice, mature female mice, or 1% (v/v) acetophenone for 1 hr in a sealed container. (B) Left: representative in situ mRNA hybridization and pS6 immunostaining showing co-localization events, as indicated by arrowheads, between OSNs expressing Olfr910 and pS6 signal induction following exposure of a juvenile mouse to adult male mice. Scale bars indicate 20 μm. Right: summary data showing the mean and SEM of pS6 induction in OSNs expressing Olfr910 following exposure of a juvenile mouse to multiple stimuli. One-way ANOVA with Dunnett’s multiple comparisons test correction reveals that only exposure to mature male mice leads to significant (****p < 0.0001) pS6 induction within OSNs expressing Olfr910. Data are from n = 3 juvenile mice. (C) Left: representative in situ mRNA hybridization and pS6 immunostaining showing co-localization events between OSNs expressing Olfr912 and pS6 signal induction following exposure of a juvenile mouse to adult male mice. Right: summary data showing the mean and SEM of pS6 induction in OSNs expressing Olfr912 following exposure of a juvenile mouse to multiple stimuli (****p < 0.0001). (D) Left: representative in situ mRNA hybridization and pS6 immunostaining showing co-localization events between OSNs expressing Olfr1295 and pS6 signal induction following exposure of a juvenile mouse to adult male mice. Right: summary data showing the mean and SEM of pS6 induction in OSNs expressing Olfr1295 following exposure of a juvenile mouse to multiple stimuli (****p < 0.0001).
Figure 3—figure supplement 1.
Figure 3—figure supplement 1.. Example in situ stainings showing sexually dimorphic ORs are activated by mature male mouse odor.
(A) Representative images showing in situ mRNA hybridizations probing for Olfr910 expression and pS6 immunostainings. Co-localization events are only seen following mature male mouse exposure as indicated by arrowheads. Scale bars indicate 20 μm. (B) Representative images showing in situ mRNA hybridizations probing for Olfr912 expression and pS6 immunostainings. (C) Representative images showing in situ mRNA hybridizations probing for Olfr1295 expression and pS6 immunostainings.
Figure 4.
Figure 4.. Sexually dimorphic ORs are activated by mature male mouse semiochemicals SBT and MTMT.
(A) Schematic of the pS6-IP-Seq experiment. Litter matched, ~3 week-old (juvenile) mice are used. Mice are habituated to an odor-free environment for 1 hr. One mouse then receives exposure to an odor stimulus, while another receives exposure to the diluent, each for 1 hr. Whole olfactory mucosa is then harvested and immunoprecipitated using an antibody against pS6. (B) The panel of sex-specific and sex-enriched volatiles screened using pS6-IP-Seq. (C) Volcano plot showing the results of pS6-IP-Seq using 0.01% (v/v) SBT diluted in water as stimulus. Olfr910, Olfr912, and Olfr1295 are highlighted in red. The red dashed line indicates an FDR = 0.05. Data are from n = 3 control (diluent-exposed) mice and n = 3 experimental (odor-exposed) mice. (D) Volcano plot showing the results of pS6-IP-Seq using 100 μM MTMT dissolved in ethanol as stimulus. (E) Top: representative in situ mRNA hybridization and pS6 immunostaining showing co-localization events between OSNs expressing Olfr910 and pS6 signal induction following exposure of a juvenile mouse to 1% (v/v) SBT diluted in water. Scale bars indicate 20 μm. Bottom: summary data showing the mean and SEM of pS6 induction in OSNs expressing Olfr910 following exposure of a juvenile mouse to increasing concentrations of SBT and 1% (v/v) acetophenone. One-way ANOVA with Dunnett’s multiple comparisons test correction reveals only exposure to 0.01% (v/v) SBT, 0.1% (v/v) SBT, and 1% (v/v) SBT leads to significant pS6 induction within OSNs expressing Olfr910 (****p < 0.0001). Data are from n = 3 juvenile mice. (F) Top: representative in situ mRNA hybridization and pS6 immunostaining showing co-localization events between OSNs expressing Olfr912 and pS6 signal induction following exposure of a juvenile mouse to 1% (v/v) SBT diluted in water. Bottom: summary data showing the mean and SEM of pS6 induction in OSNs expressing Olfr912 following exposure of a juvenile mouse to increasing concentrations of SBT and 1% (v/v) acetophenone (**p < 0.01, ****p < 0.0001). (G) Top: representative in situ mRNA hybridization and pS6 immunostaining showing co-localization events between OSNs expressing Olfr1295 and pS6 signal induction following exposure of a juvenile mouse to 10 mM MTMT diluted in ethanol. Bottom: summary data showing the mean and SEM of pS6 induction in OSNs expressing Olfr1295 following exposure of a juvenile mouse to increasing concentrations of MTMT and 1% (v/v) acetophenone (****p < 0.0001).
Figure 4—figure supplement 1.
Figure 4—figure supplement 1.. Sexually dimorphic ORs are not activated by sex-specific or sex-enriched odorants that are not SBT or MTMT.
(A) Volcano plot showing the results of pS6-IP-Seq using 1% (v/v) β-caryophyllene dissolved in water as stimulus. Olfr910, Olfr912, and Olfr1295 are highlighted in red and not enriched. The red dashed line indicates an FDR = 0.05. Data are from n = 3 control (diluent-exposed) mice and n = 3 experimental (odor-exposed) mice. (B) Volcano plot showing the results of pS6-IP-Seq using 1% (v/v) 2-heptanone dissolved in water as stimulus. (C) Volcano plot showing the results of pS6-IP-Seq using 100% (E)-β-farnesene dissolved in water as stimulus. (D) Volcano plot showing the results of pS6-IP-Seq using 77% (v/v) DHB dissolved in water as stimulus. (E) Volcano plot showing the results of pS6-IP-Seq using 1% (v/v) 2,5-DMP dissolved in water as stimulus. (F) Volcano plot showing the results of pS6-IP-Seq using 1% (v/v) SBT dissolved in water as stimulus. (G) Volcano plot showing the results of pS6-IP-Seq using 100% SBT as stimulus. (H) Volcano plot showing the results of pS6-IP-Seq using 10 mM MTMT dissolved in ethanol as stimulus.
Figure 4—figure supplement 2.
Figure 4—figure supplement 2.. Cognate ORs for other sex-specific and sex-enriched volatiles are not sexually dimorphic.
(A) Left: the top five candidate ORs activated by 1% (v/v) 2-heptanone exposure, based on lowest FDR values, are highlighted in red. Right: none of the top five candidate ORs activated by 1% (v/v) 2-heptanone exposure exhibit sexual dimorphism in 43-week-old sex-separated mice. Data are from n = 3 control (diluent-exposed) mice and n = 3 experimental (odor-exposed) mice. (B) Left: the top five candidate ORs activated by 100% (E)-β-farnesene exposure, based on lowest FDR values, are highlighted in red. Right: none of the top five candidate ORs activated by 100% (E)-β-farnesene exposure exhibit sexual dimorphism in 43-week-old sex-separated mice. (C) Left: the top five candidate ORs activated by 77% (v/v) DHB exposure, based on lowest FDR values, are highlighted in red. Right: none of the top five candidate ORs activated by 77% (v/v) DHB exposure exhibit sexual dimorphism in 43-week-old sex-separated mice. (D) Left: the top five candidate ORs activated by 1% (v/v) 2,5-DMP exposure, based on lowest FDR values, are highlighted in red. Right: none of the top five candidate ORs activated by 1% (v/v) 2,5-DMP exposure exhibit sexual dimorphism in 43-week-old sex-separated mice.
Figure 4—figure supplement 3.
Figure 4—figure supplement 3.. Example in situ stainings showing sexually dimorphic ORs are activated by SBT and MTMT.
(A) Representative images showing in situ mRNA hybridizations probing for Olfr910 expression and pS6 immunostainings. Co-localization events are only seen following SBT exposure as indicated by arrowheads. Scale bars indicate 20 μm. (B) Representative images showing in situ mRNA hybridizations probing for Olfr912 expression and pS6 immunostainings. (C) Representative images showing in situ mRNA hybridizations probing for Olfr1295 expression and pS6 immunostainings.
Figure 5.
Figure 5.. OSN responses to semiochemicals are not sexually dimorphic between mature male and female mice.
(A) Comparison of responses of OSNs from 26-week-old male and female mice to various stimuli. One-way ANOVA with Tukey’s multiple comparisons test correction reveals only exposure to 0.1% (v/v) SBT leads to significant pS6 induction in OSNs expressing Olfr910 (***p < 0.001) with no significant differences between males and females (ns; p > 0.05). Data are from n = 3 male and n = 3 female mice. (B) One-way ANOVA with Tukey’s multiple comparisons test correction reveals only exposure to 0.1% (v/v) SBT leads to significant pS6 induction in OSNs expressing Olfr912 (**p < 0.01, ****p < 0.0001) with no significant differences between males and females (ns; p > 0.05). (C) One-way ANOVA with Tukey’s multiple comparisons test correction reveals only exposure to 10 mM MTMT leads to significant pS6 induction in OSNs expressing Olfr1295 (****p < 0.0001) with no significant differences between males and females (ns; p > 0.05).
Figure 5—figure supplement 1.
Figure 5—figure supplement 1.. Example in situ stainings showing responses to semiochemicals are not sexually dimorphic between mature male and female mice.
(A) Representative images from mature male and female mice showing in situ mRNA hybridizations probing for Olfr910 expression and pS6 immunostainings. Co-localization events are only seen following SBT exposure as indicated by arrowheads. Scale bars indicate 20 μm. (B) Representative images from mature male and female mice showing in situ mRNA hybridizations probing for Olfr912 expression and pS6 immunostainings. Co-localization events are only seen following SBT exposure. (C) Representative images from mature male and female mice showing in situ mRNA hybridizations probing for Olfr1295 expression and pS6 immunostainings. Co-localization events are only seen following MTMT exposure.
Figure 6.
Figure 6.. Sex-combined housing leads to the attenuation of the dimorphic OR representations.
(A) Schematic of the housing setup. For sex-combined housing, one male mouse was co-housed with one female mouse. (B) Volcano plot comparing expression of Olfrs between 43-week-old sex-combined male and female mice. Olfr910, Olfr912, and Olfr1295 are highlighted in red. The red dashed line indicates an FDR = 0.05. Data are from n = 3 male and n = 3 female mice. (C) Longitudinal plotting of the mean and SEM of proportions of reads aligned to Olfr910, Olfr912, and Olfr1295 in sex-separated and sex-combined male and female mice. (D) Left: representative in situ mRNA hybridization pictures probing for the expression of Olfr910 in 43-week-old sex-combined male (top) and female (bottom) mice. Scale bars indicate 50 μm. Right: summary data showing the mean and SEM of the density of OSNs expressing Olfr910 in 43-week-old male and female mice. One-way ANOVA with Tukey’s multiple comparisons test correction reveals only sex-separated female mice to differ in the density of OSNs expressing Olfr910 (****p < 0.0001). Data are from n = 3 male and n = 3 female mice from each housing condition. (E) Left: representative in situ mRNA hybridization pictures probing for the expression of Olfr912 in 43-week-old sex-combined male (top) and female (bottom) mice. Right: summary data showing the mean and SEM of the density of OSNs expressing Olfr912 in 43-week-old male and female mice. One-way ANOVA with Tukey’s multiple comparisons test correction reveals only sex-separated female mice to differ in the density of OSNs expressing Olfr912 (****p < 0.0001). (F) Left: representative in situ mRNA hybridization pictures probing for the expression of Olfr1295 in 43-week-old sex-combined male (top) and female (bottom) mice. Right: summary data showing the mean and SEM of the density of OSNs expressing Olfr1295 in 43-week-old male and female mice. One-way ANOVA with Tukey’s multiple comparisons test correction reveals only sex-separated female mice to differ in the density of OSNs expressing Olfr1295 (****p < 0.0001).
Figure 7.
Figure 7.. Olfr1437 and Olfr235 are male-enriched and respond to the macrocyclic musk molecule CPD.
(A) Volcano plot comparing expression of Olfrs between 43-week-old sex-separated male and female mice. Olfr1437 and Olfr235 and are highlighted in red. The red dashed line indicates an FDR = 0.05. Data are from n = 3 male and n = 3 female mice. (B) Volcano plot comparing expression of Olfrs between 43-week-old sex-combined male and female mice. (C) Longitudinal plotting of the mean and SEM of proportions of reads aligned to Olfr1437 and Olfr235 in sex-separated and sex-combined male and female mice. (D) Structure of macrocyclic musk odorant cyclopentadecanone (CPD). (E) Volcano plot showing the results of pS6-IP-Seq using 100 mM CPD diluted in ethanol as stimulus. Olfr1437 and Olfr235 are highlighted in red and enriched. The red dashed line indicates an FDR = 0.05. Data are from n = 3 control (diluent-exposed) mice and n = 3 experimental (odor-exposed) mice.
Figure 7—figure supplement 1.
Figure 7—figure supplement 1.. Male over-expression is also consistent with a difference in the number of cells expressing Olfr1437 between male and female mice.
(A) Left: representative in situ mRNA hybridization pictures probing for the expression of Olfr1437 in 43-week-old sex-separated male (top) and female (bottom) mice. Scale bars indicate 50 μm. Right: summary data showing mean and SEM of the density of OSNs expressing Olfr1437 in 43-week-old sex-separated male (top) and female (bottom) mice. An unpaired two-tailed t-test revealed statistical difference (****p < 0.0001) between males and females. Data are from n = 3 male and n = 3 female mice.
Figure 8.
Figure 8.. Single-cell RNA-Seq analysis reveals an enrichment of activity-associated gene expression in male OSNs expressing Olfr910, Olfr912, and Olfr1295.
(A) Chemosensory receptor-independent UMAP embedding of 17,666 singly sequenced mature OSNs. OSNs expressing Olfr910, Olfr912, Olfr1295, Olfr1437, and Olfr235 are highlighted. (B) Gene expression analysis identified activity-associated genes S100a5, Ptprn, Pcp4l1, and Nrp1 to be enriched amongst OSNs expressing Olfr910, Olfr912, and Olfr1295. (C) UMAP representations of S100a5, Ptprn, Pcp4l1, and Nrp1 show a tendency toward higher expression where OSNs expressing Olfr910, Olfr912, and Olfr1295 are localized.
Figure 9.
Figure 9.. Sex-separated Bax-/- mice fail to generate sexually dimorphic representations of Olfr910Olfr912, and Olfr1295.
(A) Volcano plot comparing expression of Olfrs between 26-week-old Bax-/- sex separated male and female mice. Olfr910, Olfr912, and Olfr1295 are highlighted in red. The red dashed line indicates an FDR = 0.05. Data are from n = 3 male and n = 3 female mice. (B) Left: representative in situ mRNA hybridization pictures probing for the expression of Olfr910 in Bax-/- 43-week-old sex-separated male (top) and female (bottom) mice. Scale bars indicate 50 μm. Right: summary data showing mean and SEM of the density of OSNs expressing Olfr910 in Bax-/- 43 week-old sex-separated male and female mice. An unpaired two-tailed t-test reveals no statistical difference (ns; p > 0.05) between males and females. Data are from n = 3 male and n = 3 female mice. (C) Left: representative in situ mRNA hybridization pictures probing for the expression of Olfr912 in Bax-/- 43-week-old sex-separated male (top) and female (bottom) mice. Right: summary data showing mean and SEM of the density of OSNs expressing Olfr912 in Bax-/- 43-week-old male and female mice. An unpaired two-tailed t-test reveals no statistical difference between males and females (ns; p > 0.05). (D) Left: representative in situ mRNA hybridization pictures probing for the expression of Olfr1295 in Bax-/- 43-week-old sex-separated male (top) and female (bottom) mice. Right: summary data showing mean and SEM of the density of OSNs expressing Olfr1295 in Bax-/- 43-week-old male and female mice. An unpaired two-tailed t-test reveals no statistical difference between males and females (ns; p > 0.05).
Figure 9—figure supplement 1.
Figure 9—figure supplement 1.. Sex-separated Bax-/- mice fail to generate sexually dimorphic representations of Olfr1437 and Olfr235. .
(A) Volcano plot comparing expression of Olfrs between 26-week-old Bax-/- sex-separated male and female mice. Olfr1437 and Olfr235 are highlighted in red. The red dashed line indicates an FDR = 0.05. Data are from n = 3 male and n = 3 female mice.
Figure 9—figure supplement 2.
Figure 9—figure supplement 2.. Bax-/- mice exhibit significant changes in their OR repertoire.
(A) Volcano plot comparing expression of Olfrs between 26-week-old wild-type and Bax-/- sex-separated male mice. Olfr910, Olfr912, Olfr1295, Olfr1437, and Olfr235 are highlighted in red. The red dashed line indicates an FDR = 0.05. Data are from n = 3 wild-type and n = 3 mutant mice. (B) Volcano plot comparing expression of Olfrs between 26-week-old wild-type and Bax-/- sex-separated female mice.
Author response image 1.
Author response image 2.
Author response image 3.

References

    1. 1000 Genome Project Data Processing Subgroup. Li H, Handsaker B, Wysoker A, Fennell T, Ruan J, Homer N, Marth G, Abecasis G, Durbin R. The sequence alignment/Map format and SAMtools. Bioinformatics. 2009;25:2078–2079. doi: 10.1093/bioinformatics/btp352. - DOI - PMC - PubMed
    1. Abraham NM, Vincis R, Lagier S, Rodriguez I, Carleton A. Long term functional plasticity of sensory inputs mediated by olfactory learning. eLife. 2014;3:e02109. doi: 10.7554/eLife.02109. - DOI - PMC - PubMed
    1. Abrunhosa I, Gulea M, Levillain J, Masson S. Synthesis of new chiral thiazoline-containing ligands. Tetrahedron: Asymmetry. 2001;12:2851–2859. doi: 10.1016/S0957-4166(01)00481-5. - DOI
    1. Brann DH, Tsukahara T, Weinreb C, Lipovsek M, Van den Berge K, Gong B, Chance R, Macaulay IC, Chou HJ, Fletcher RB, Das D, Street K, de Bezieux HR, Choi YG, Risso D, Dudoit S, Purdom E, Mill J, Hachem RA, Matsunami H, Logan DW, Goldstein BJ, Grubb MS, Ngai J, Datta SR. Non-neuronal expression of SARS-CoV-2 entry genes in the olfactory system suggests mechanisms underlying COVID-19-associated anosmia. Science Advances. 2020;6:eabc5801. doi: 10.1126/sciadv.abc5801. - DOI - PMC - PubMed
    1. Brann JH, Firestein SJ. A lifetime of neurogenesis in the olfactory system. Frontiers in Neuroscience. 2014;8:182. doi: 10.3389/fnins.2014.00182. - DOI - PMC - PubMed

Publication types

MeSH terms

Associated data