

Weak genetic signal for phenotypic integration implicates developmental processes as major regulators of trait covariation
- PMID: 33231336
- PMCID: PMC8811731
- DOI: 10.1111/mec.15748
Weak genetic signal for phenotypic integration implicates developmental processes as major regulators of trait covariation
Abstract
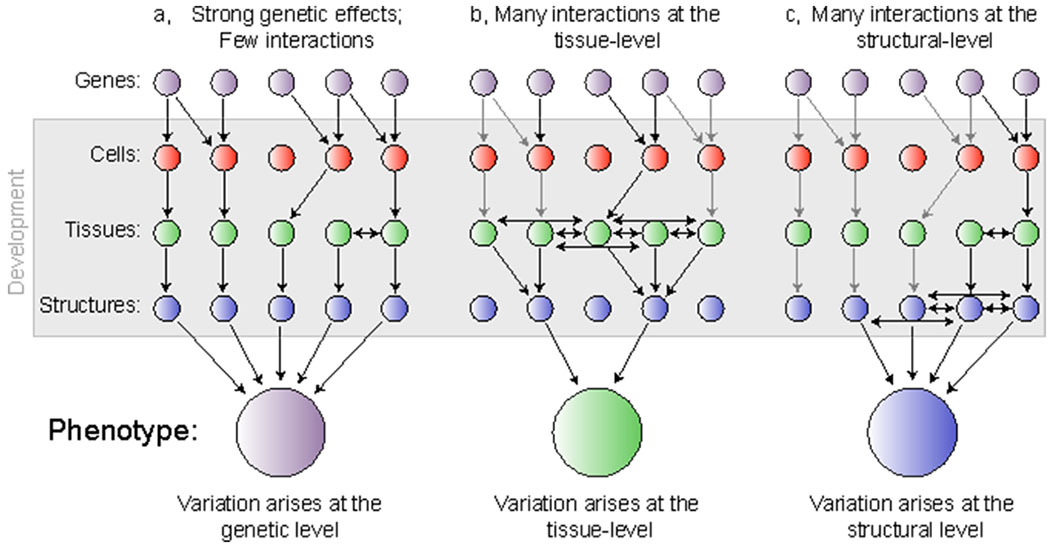
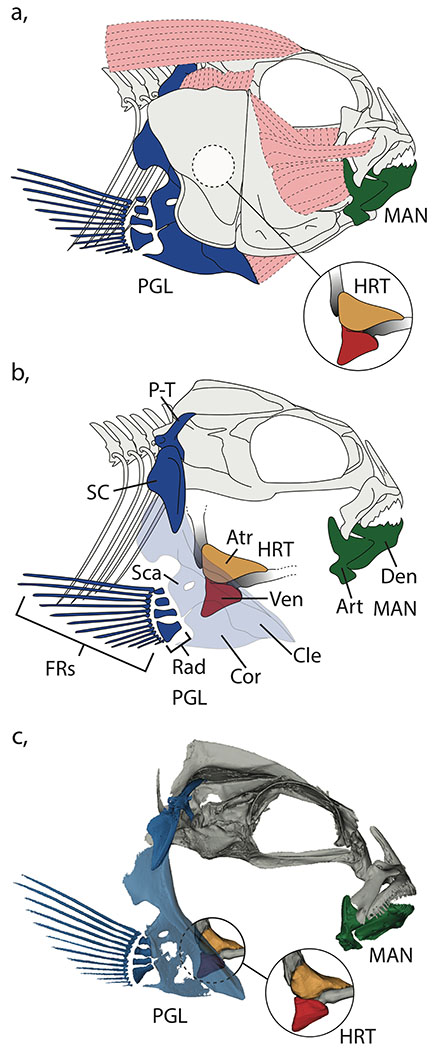
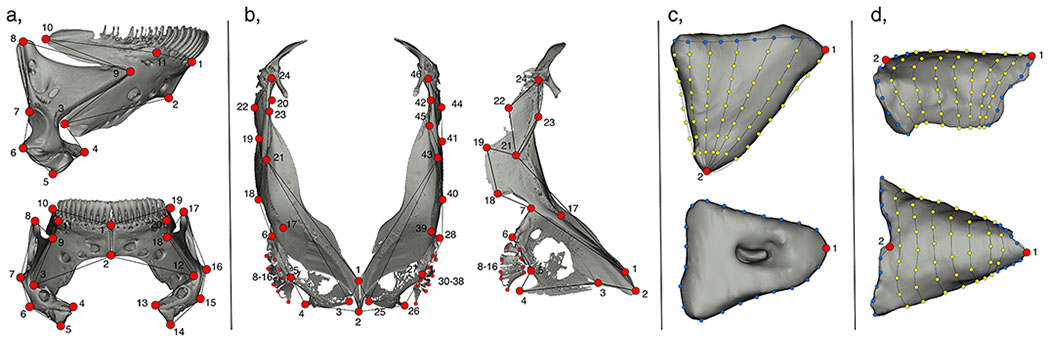
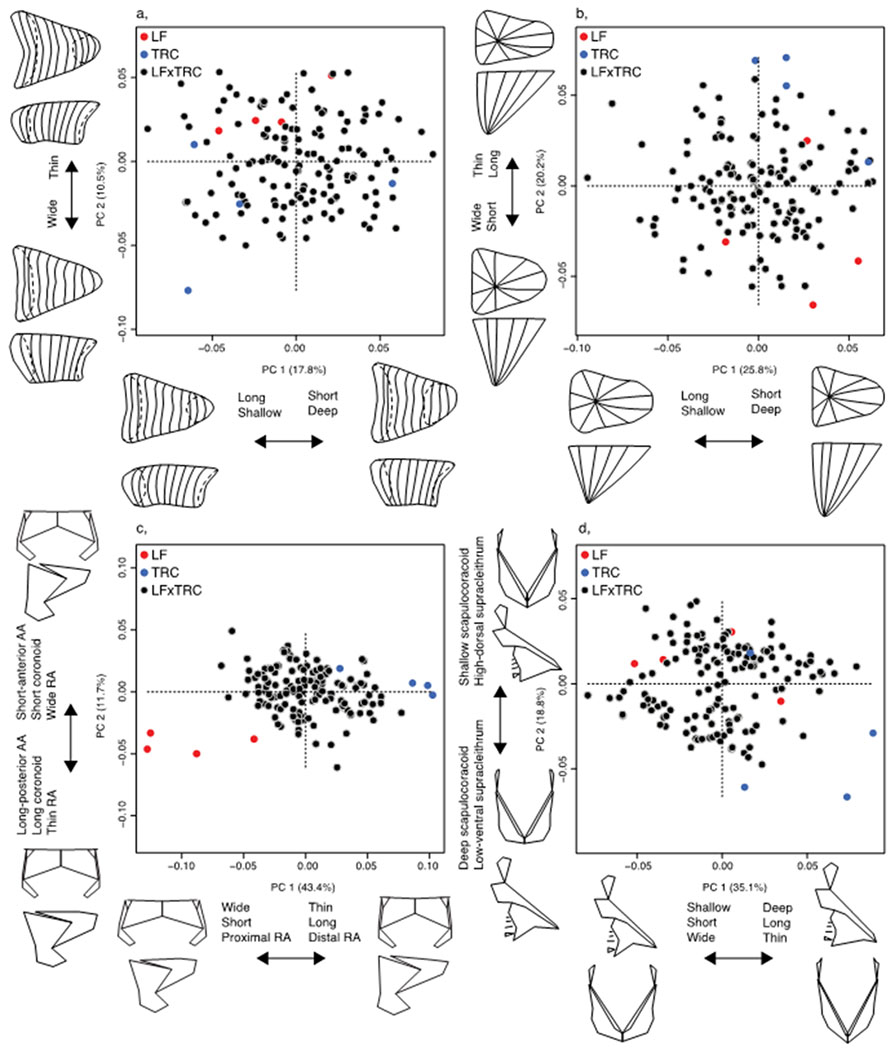
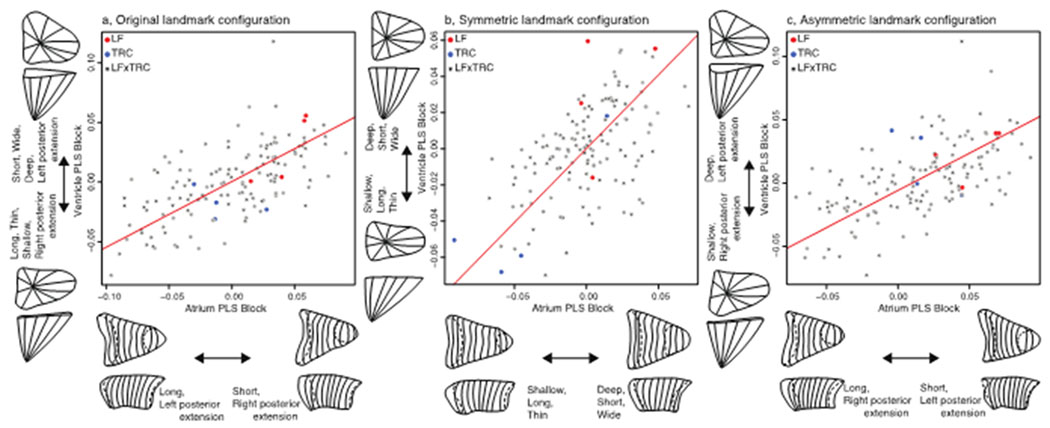
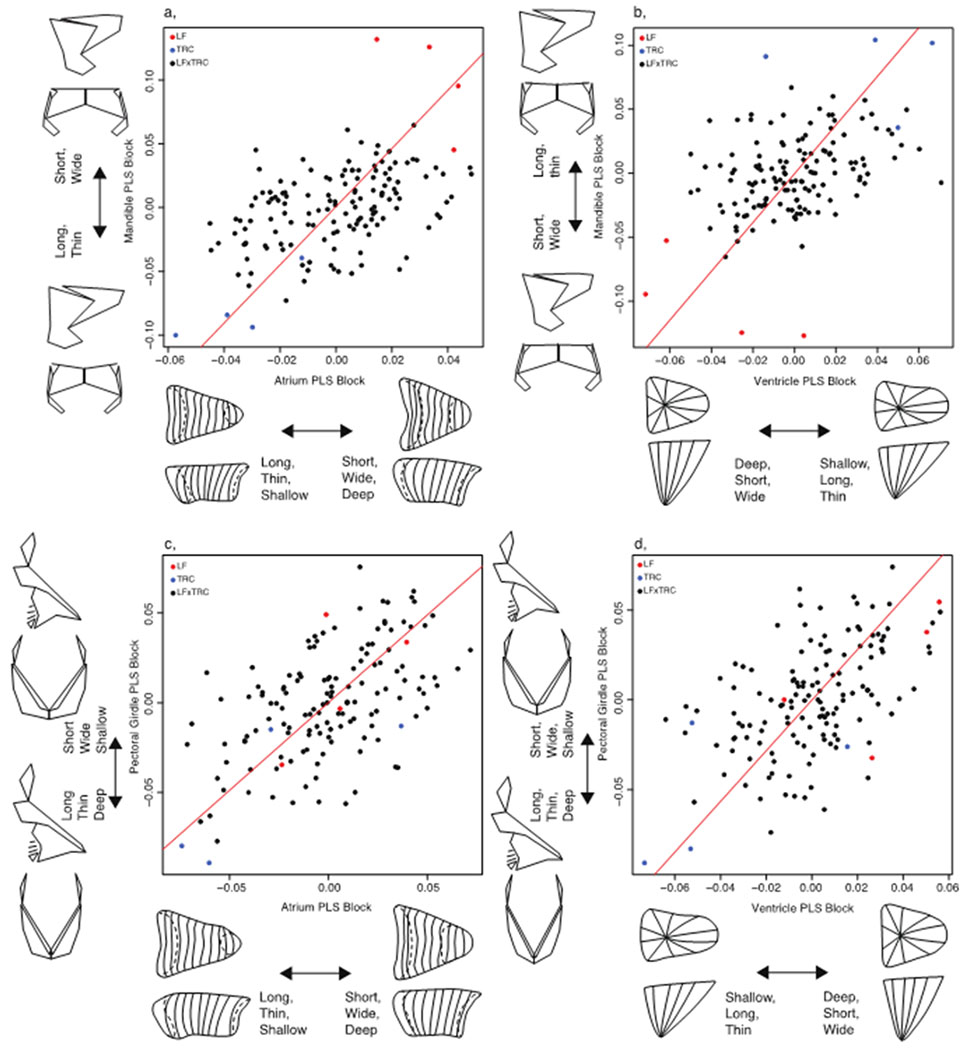
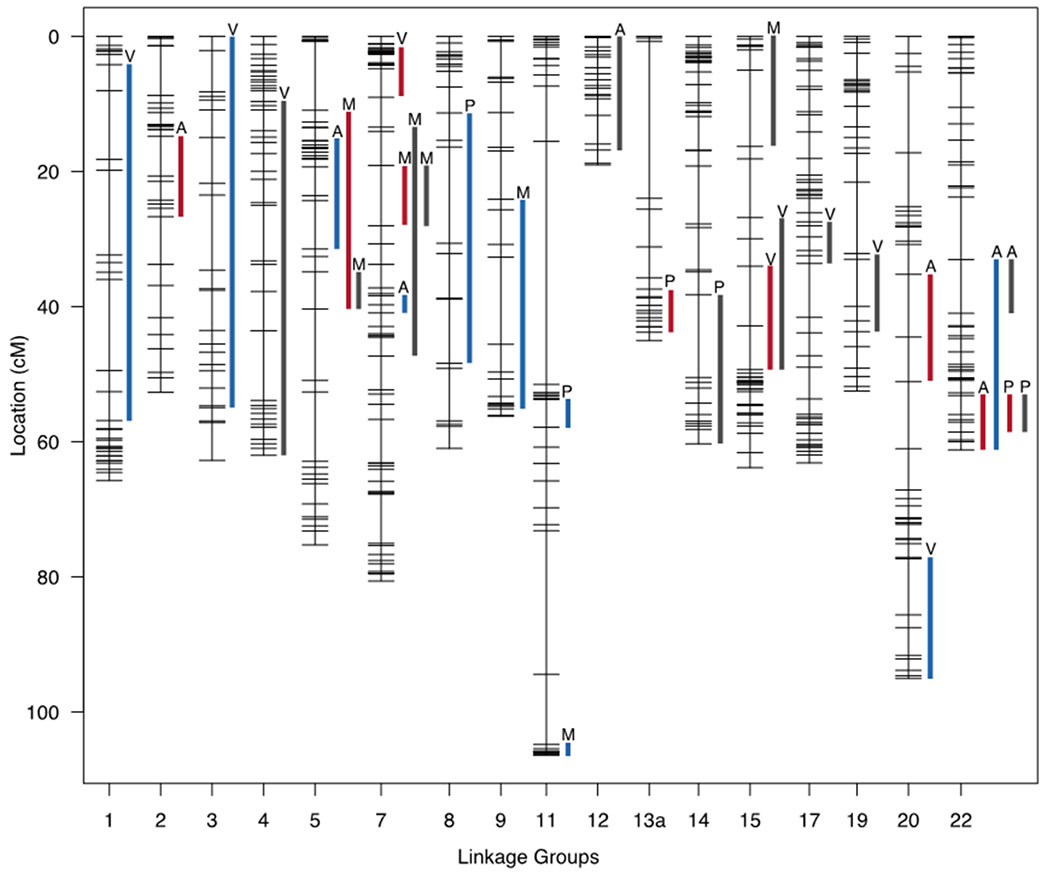
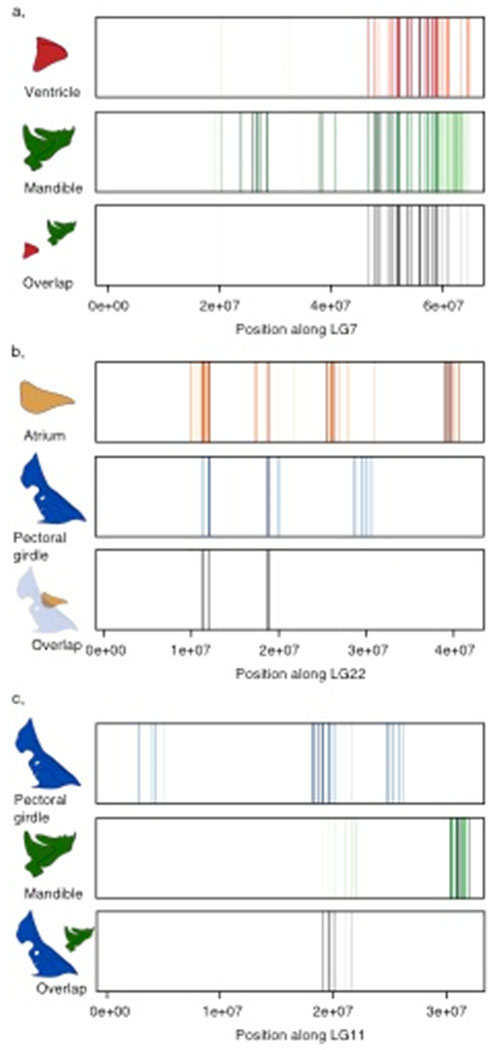
Phenotypic integration is an important metric that describes the degree of covariation among traits in a population, and is hypothesized to arise due to selection for shared functional processes. Our ability to identify the genetic and/or developmental underpinnings of integration is marred by temporally overlapping cell-, tissue- and structure-level processes that serve to continually 'overwrite' the structure of covariation among traits through ontogeny. Here, we examine whether traits that are integrated at the phenotypic level also exhibit a shared genetic basis (e.g. pleiotropy). We micro-CT scanned two hard tissue traits, and two soft tissue traits (mandible, pectoral girdle, atrium and ventricle, respectively) from an F5 hybrid population of Lake Malawi cichlids, and used geometric morphometrics to extract 3D shape information from each trait. Given the large degree of asymmetric variation that may reflect developmental instability, we separated symmetric from asymmetric components of shape variation. We then performed quantitative trait loci (QTL) analysis to determine the degree of genetic overlap between shapes. While we found ubiquitous associations among traits at the phenotypic level, except for a handful of notable exceptions, our QTL analysis revealed few overlapping genetic regions. Taken together, this indicates developmental interactions can play a large role in determining the degree of phenotypic integration among traits, and likely obfuscate the genotype to phenotype map, limiting our ability to gain a comprehensive picture of the genetic contributors responsible for phenotypic divergence.
Keywords: bone; development; geometric morphometrics; heart; phenotypic integration.
© 2020 John Wiley & Sons Ltd.
Figures
Similar articles
-
Covariation of brain and skull shapes as a model to understand the role of crosstalk in development and evolution.Evol Dev. 2023 Jan;25(1):85-102. doi: 10.1111/ede.12421. Epub 2022 Nov 14. Evol Dev. 2023. PMID: 36377237 Free PMC article.
-
Genetic and developmental basis for fin shape variation in African cichlid fishes.Mol Ecol. 2017 Jan;26(1):291-303. doi: 10.1111/mec.13905. Epub 2016 Nov 30. Mol Ecol. 2017. PMID: 27900808
-
Nested Levels of Adaptive Divergence: The Genetic Basis of Craniofacial Divergence and Ecological Sexual Dimorphism.G3 (Bethesda). 2015 Jun 1;5(8):1613-24. doi: 10.1534/g3.115.018226. G3 (Bethesda). 2015. PMID: 26038365 Free PMC article.
-
Pleiotropy and the evolution of floral integration.New Phytol. 2016 Jan;209(1):80-5. doi: 10.1111/nph.13583. Epub 2015 Jul 30. New Phytol. 2016. PMID: 26224529 Review.
-
Crop management impacts the efficiency of quantitative trait loci (QTL) detection and use: case study of fruit load×QTL interactions.J Exp Bot. 2014 Jan;65(1):11-22. doi: 10.1093/jxb/ert365. Epub 2013 Nov 13. J Exp Bot. 2014. PMID: 24227339 Review.
Cited by
-
Covariation of brain and skull shapes as a model to understand the role of crosstalk in development and evolution.Evol Dev. 2023 Jan;25(1):85-102. doi: 10.1111/ede.12421. Epub 2022 Nov 14. Evol Dev. 2023. PMID: 36377237 Free PMC article.
-
Comparative Genomics and Evolution of Avian Specialized Traits.Curr Genomics. 2021 Dec 31;22(7):496-511. doi: 10.2174/1389202923666211227143952. Curr Genomics. 2021. PMID: 35386431 Free PMC article. Review.
-
The cichlid oral and pharyngeal jaws are evolutionarily and genetically coupled.Nat Commun. 2021 Sep 16;12(1):5477. doi: 10.1038/s41467-021-25755-5. Nat Commun. 2021. PMID: 34531386 Free PMC article.
-
Diversity in rest-activity patterns among Lake Malawi cichlid fishes suggests a novel axis of habitat partitioning.J Exp Biol. 2021 Apr 1;224(7):jeb242186. doi: 10.1242/jeb.242186. Epub 2021 Apr 15. J Exp Biol. 2021. PMID: 33658242 Free PMC article.
-
Integration drives rapid phenotypic evolution in flatfishes.Proc Natl Acad Sci U S A. 2021 May 4;118(18):e2101330118. doi: 10.1073/pnas.2101330118. Proc Natl Acad Sci U S A. 2021. PMID: 33931506 Free PMC article.
References
-
- Adams DC, and Collyer ML. 2016. On the comparison of the strength of morphological integration across morphometric datasets. Evolution (N. Y). 70:2623–2631. John Wiley & Sons, Ltd (10.1111). - PubMed
-
- Adams DC, Collyer ML, Otarola-Castillo E, and Sherratt E. 2017. Geomorph: Software for geometric morphometric analyses. CRAN.
-
- Adhikari K, Fuentes-Guajardo M, Quinto-Sánchez M, Mendoza-Revilla J, Camilo Chacón-Duque J, Acuña-Alonzo V, Jaramillo C, Arias W, Lozano RB, Pérez GM, Gómez-Valdés J, Villamil-Ramírez H, Hunemeier T, Ramallo V, Silva de Cerqueira CC, Hurtado M, Villegas V, Granja V, Gallo C, Poletti G, Schuler-Faccini L, Salzano FM, Bortolini M-C, Canizales-Quinteros S, Cheeseman M, Rosique J, Bedoya G, Rothhammer F, Headon D, González-José R, Balding D, and Ruiz-Linares A. 2016. A genome-wide association scan implicates DCHS2, RUNX2, GLI3, PAX1 and EDAR in human facial variation. Nat. Commun. 7:11616. - PMC - PubMed
-
- Albertson RC, and Kocher TD. 2006. Genetic and developmental basis of cichlid trophic diversity. Heredity (Edinb). 97:211–221. - PubMed
Publication types
MeSH terms
Associated data
Grants and funding
LinkOut - more resources
Full Text Sources
Other Literature Sources
Miscellaneous
