

KIAA0101 as a new diagnostic and prognostic marker, and its correlation with gene regulatory networks and immune infiltrates in lung adenocarcinoma
- PMID: 33231570
- PMCID: PMC7835026
- DOI: 10.18632/aging.104144
KIAA0101 as a new diagnostic and prognostic marker, and its correlation with gene regulatory networks and immune infiltrates in lung adenocarcinoma
Abstract
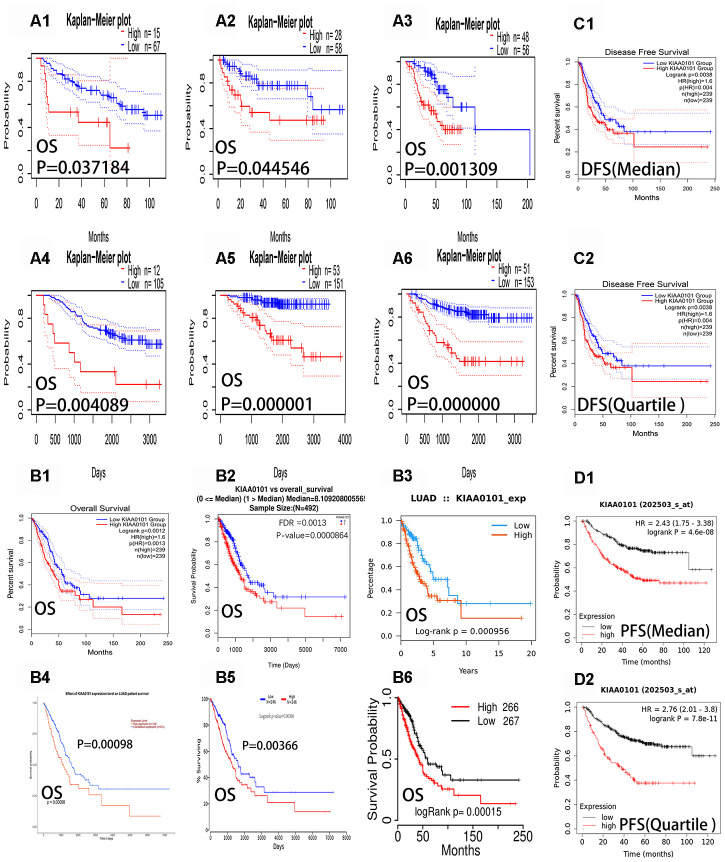
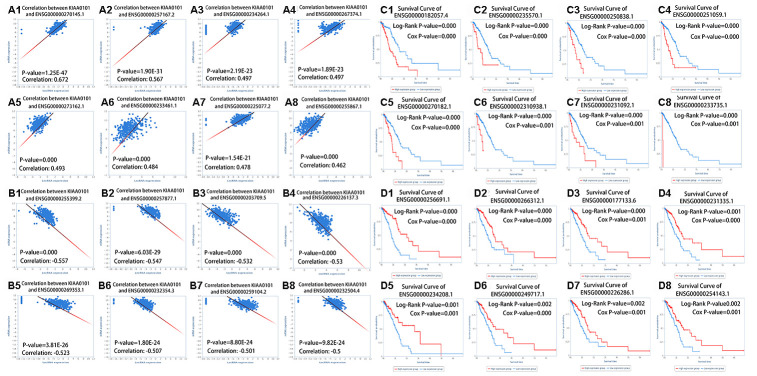
Proliferating cell nuclear antigen binding factor (encoded by KIAA0101/PCLAF) regulates DNA synthesis and cell cycle progression; however, whether the level of KIAA0101 mRNA in lung adenocarcinoma is related to prognosis and tumor immune infiltration is unknown. In patients with lung adenocarcinoma, the differential expression of KIAA0101 was analyzed using the Oncomine, GEPIA, and Ualcan databases. The prognosis of patients with different KIAA0101 expression levels was evaluated using databases such as Prognostan and GEPIA. Tumor immune infiltration associated with KIAA0101 was analyzed using TISIDB. Linkedmics was used to perform gene set enrichment analysis of KIAA0101. KIAA0101 expression in lung adenocarcinoma tissues was higher than that in normal lung tissues. Patients with lung adenocarcinoma with low KIAA0101 expression had a better prognosis than those with high KIAA0101 expression. We constructed the gene regulatory network of KIAA0101 in lung adenocarcinoma. KIAA0101 appeared to play an important role in the regulation of tumor immune infiltration and targeted therapy in lung adenocarcinoma. Thus, KIAA0101 mRNA levels correlated with the diagnosis, prognosis, immune infiltration, and targeted therapy in lung adenocarcinoma. These results provide new directions to develop diagnostic criteria, prognostic evaluation, immunotherapy, and targeted therapy for lung adenocarcinoma.
Keywords: KIAA0101/PCLAF; LUAD; biomarker; lung adenocarcinoma; survival analysis.
Conflict of interest statement
Figures


Similar articles
-
[Public Database-based Study to Explore the Expression and Role of DDB1 in Lung Adenocarcinoma].Zhongguo Fei Ai Za Zhi. 2025 Apr 20;28(4):256-266. doi: 10.3779/j.issn.1009-3419.2025.102.12. Zhongguo Fei Ai Za Zhi. 2025. PMID: 40404474 Free PMC article. Chinese.
-
Increased expression of TTC21A in lung adenocarcinoma infers favorable prognosis and high immune infiltrating level.Int Immunopharmacol. 2020 Jan;78:106077. doi: 10.1016/j.intimp.2019.106077. Epub 2019 Dec 5. Int Immunopharmacol. 2020. PMID: 31812070
-
NPM1 Is a Prognostic Biomarker Involved in Immune Infiltration of Lung Adenocarcinoma and Associated With m6A Modification and Glycolysis.Front Immunol. 2021 Jul 16;12:724741. doi: 10.3389/fimmu.2021.724741. eCollection 2021. Front Immunol. 2021. PMID: 34335635 Free PMC article.
-
Correlation between prognostic indicator AHNAK2 and immune infiltrates in lung adenocarcinoma.Int Immunopharmacol. 2021 Jan;90:107134. doi: 10.1016/j.intimp.2020.107134. Epub 2020 Nov 7. Int Immunopharmacol. 2021. PMID: 33168407
-
Systematic expression analysis of the CELSR family reveals the importance of CELSR3 in human lung adenocarcinoma.J Cell Mol Med. 2021 May;25(9):4349-4362. doi: 10.1111/jcmm.16497. Epub 2021 Apr 3. J Cell Mol Med. 2021. PMID: 33811453 Free PMC article.
Cited by
-
Overexpression of 15-Hydroxyprostaglandin Dehydrogenase Inhibits A549 Lung Adenocarcinoma Cell Growth via Inducing Cell Cycle Arrest and Inhibiting Epithelial-Mesenchymal Transition.Cancer Manag Res. 2021 Nov 30;13:8887-8900. doi: 10.2147/CMAR.S331222. eCollection 2021. Cancer Manag Res. 2021. PMID: 34876851 Free PMC article.
-
DNA methylation of ARHGAP30 is negatively associated with ARHGAP30 expression in lung adenocarcinoma, which reduces tumor immunity and is detrimental to patient survival.Aging (Albany NY). 2021 Dec 15;13(24):25799-25845. doi: 10.18632/aging.203762. Epub 2021 Dec 15. Aging (Albany NY). 2021. PMID: 34910688 Free PMC article.
-
Omics Integration Uncovers Mechanisms Associated with HIV Viral Load and Potential Therapeutic Insights.medRxiv [Preprint]. 2025 Jul 30:2025.07.29.25332397. doi: 10.1101/2025.07.29.25332397. medRxiv. 2025. PMID: 40766151 Free PMC article. Preprint.
-
KIAA0101 and IL2RA Were Identified as Core Genes in Hormone-Resistant Nephropathy.Dis Markers. 2022 Sep 17;2022:6545266. doi: 10.1155/2022/6545266. eCollection 2022. Dis Markers. 2022. PMID: 36164371 Free PMC article.
-
Comprehensive Analysis Identifies Hyaluronan Mediated Motility Receptor and Cell Division Cycle 25C as Potential Prognostic Biomarkers in Head and Neck Squamous Cell Carcinoma.Cancer Control. 2024 Jan-Dec;31:10732748241287904. doi: 10.1177/10732748241287904. Cancer Control. 2024. PMID: 39323031 Free PMC article.
References
-
- Govindan R, Page N, Morgensztern D, Read W, Tierney R, Vlahiotis A, Spitznagel EL, Piccirillo J. Changing epidemiology of small-cell lung cancer in the United States over the last 30 years: analysis of the surveillance, epidemiologic, and end results database. J Clin Oncol. 2006; 24:4539–44. 10.1200/JCO.2005.04.4859 - DOI - PubMed
-
- Pabla S, Conroy JM, Nesline MK, Glenn ST, Papanicolau-Sengos A, Burgher B, Hagen J, Giamo V, Andreas J, Lenzo FL, Yirong W, Dy GK, Yau E, et al.. Proliferative potential and resistance to immune checkpoint blockade in lung cancer patients. J Immunother Cancer. 2019; 7:27. 10.1186/s40425-019-0506-3 - DOI - PMC - PubMed
Publication types
MeSH terms
Substances
LinkOut - more resources
Full Text Sources
Medical
