. 2020 Dec 7;152(12):e202012660.
doi: 10.1085/jgp.202012660.

FXYD protein isoforms differentially modulate human Na/K pump function

Affiliations

FXYD protein isoforms differentially modulate human Na/K pump function

Dylan J Meyer et al. J Gen Physiol. .

Abstract

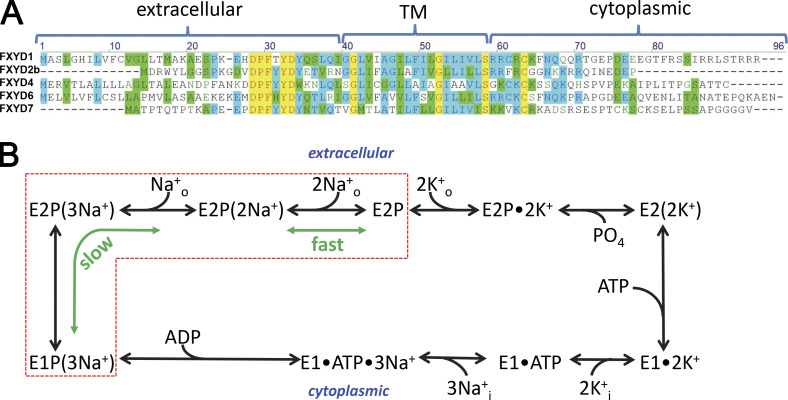
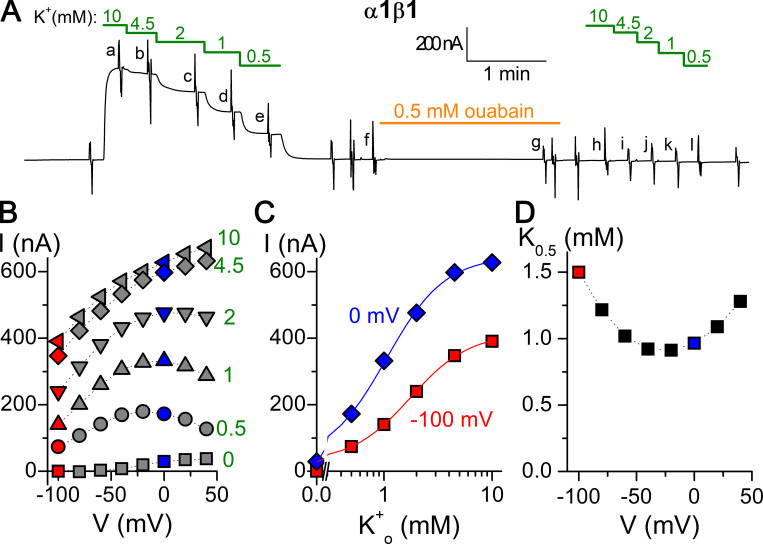
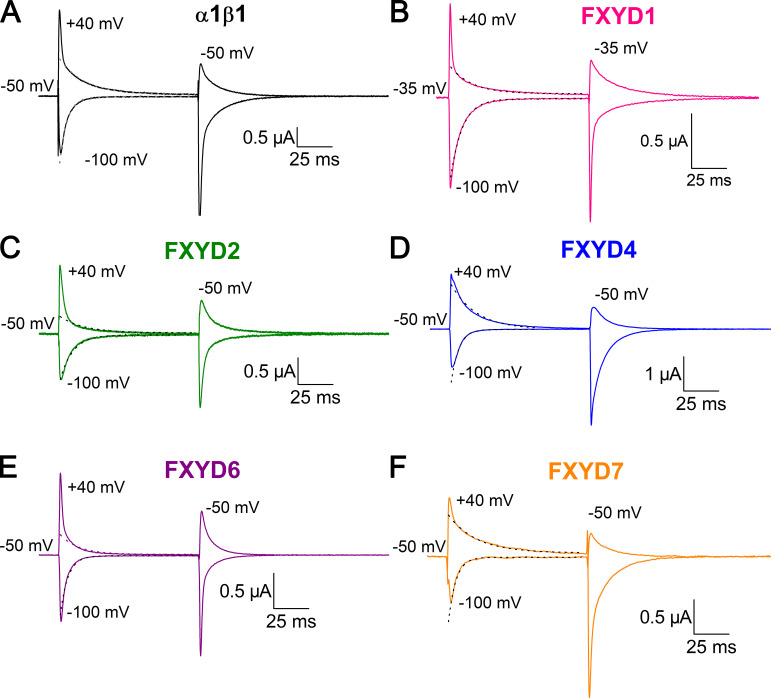
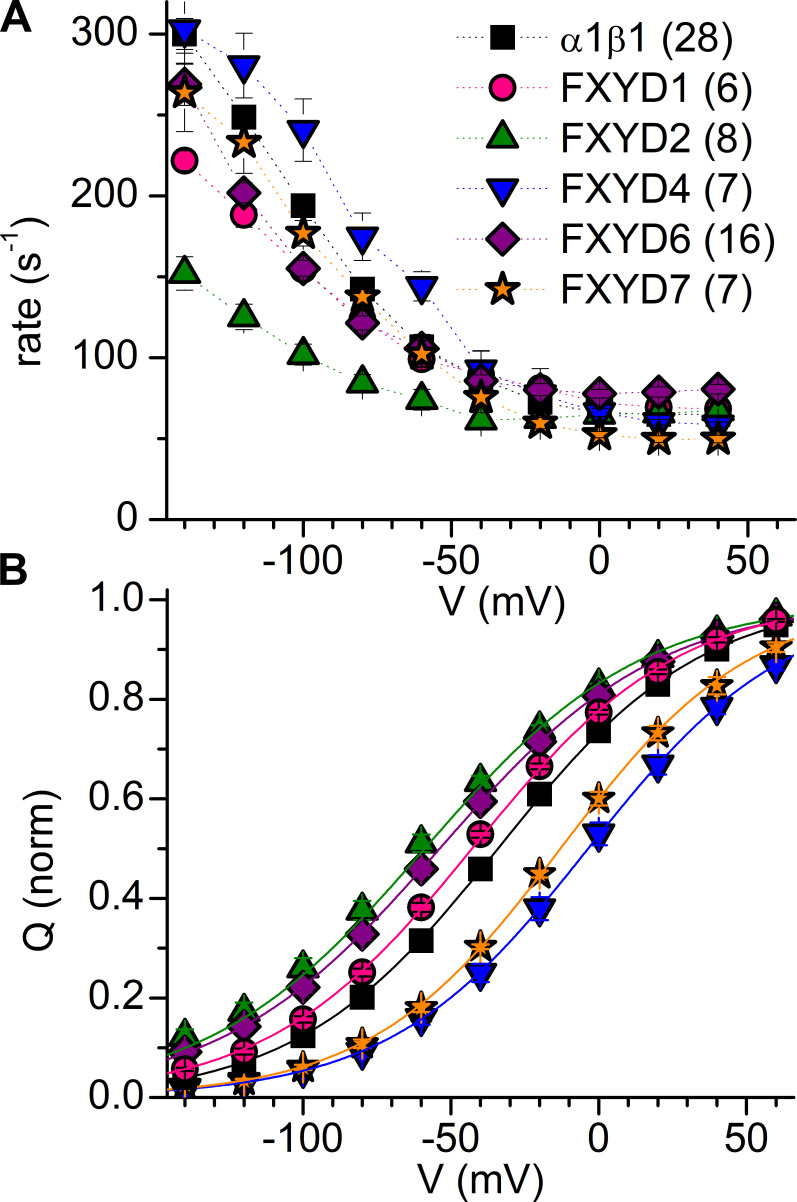
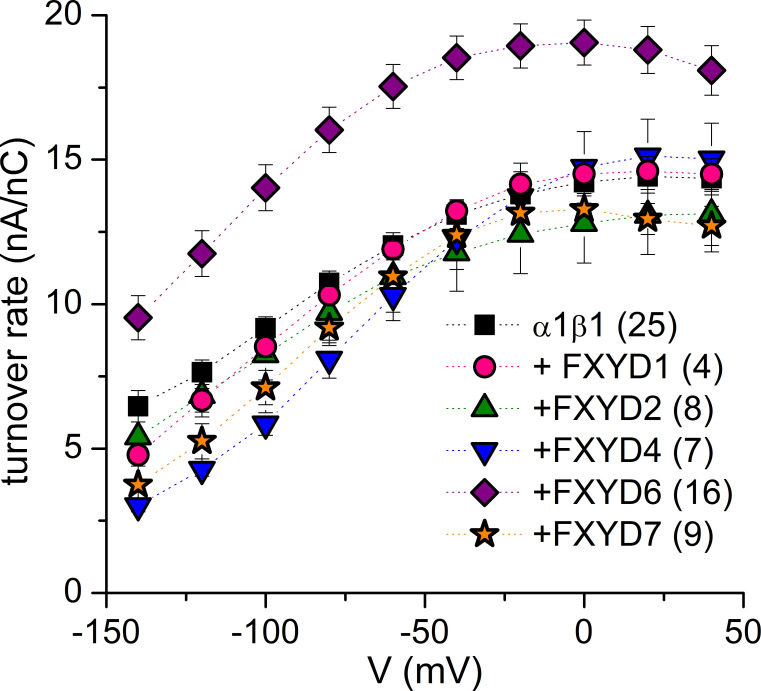
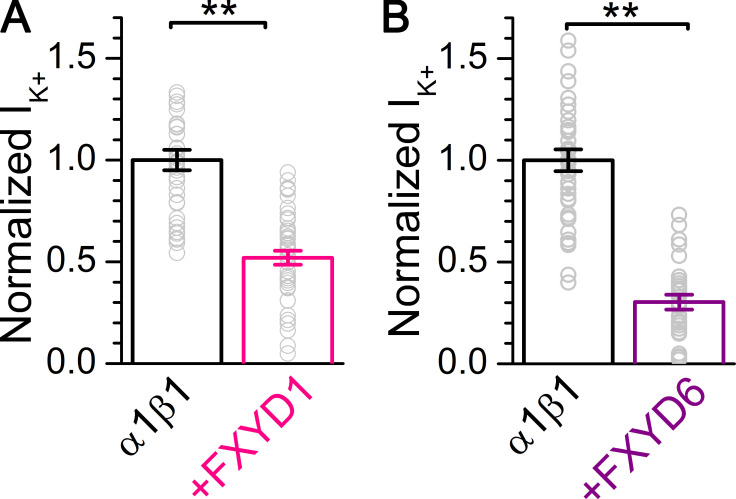
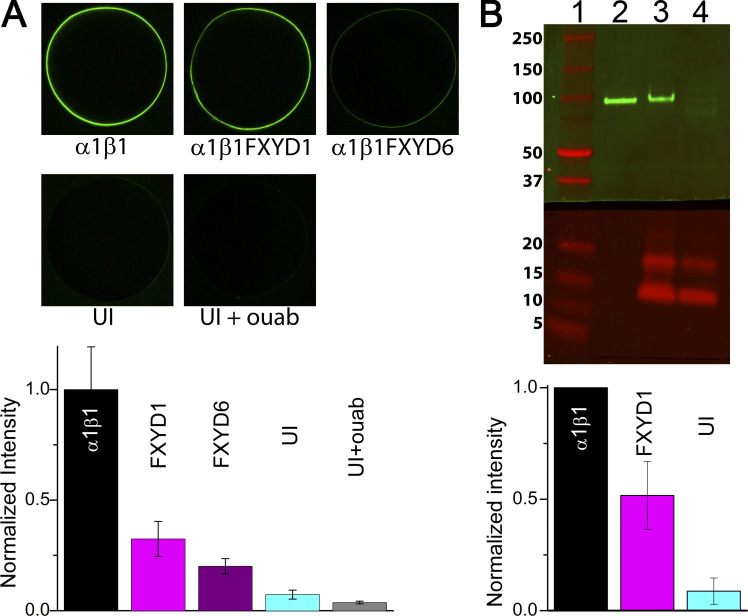
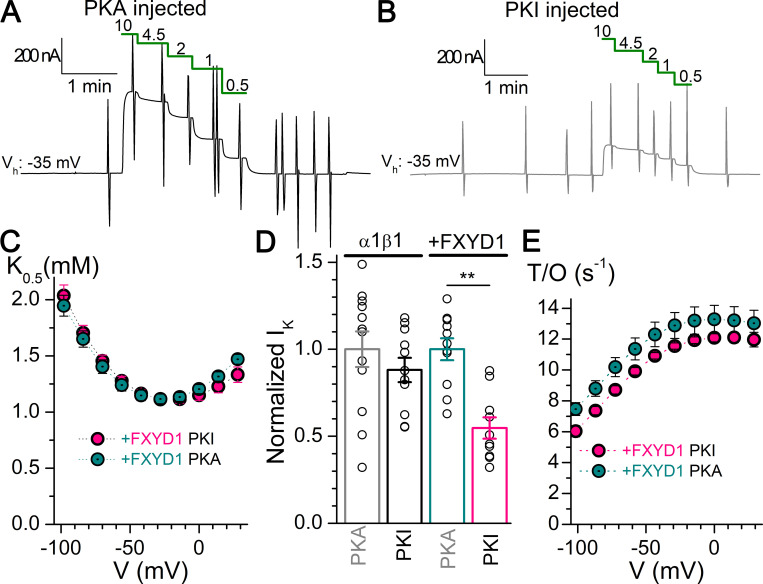
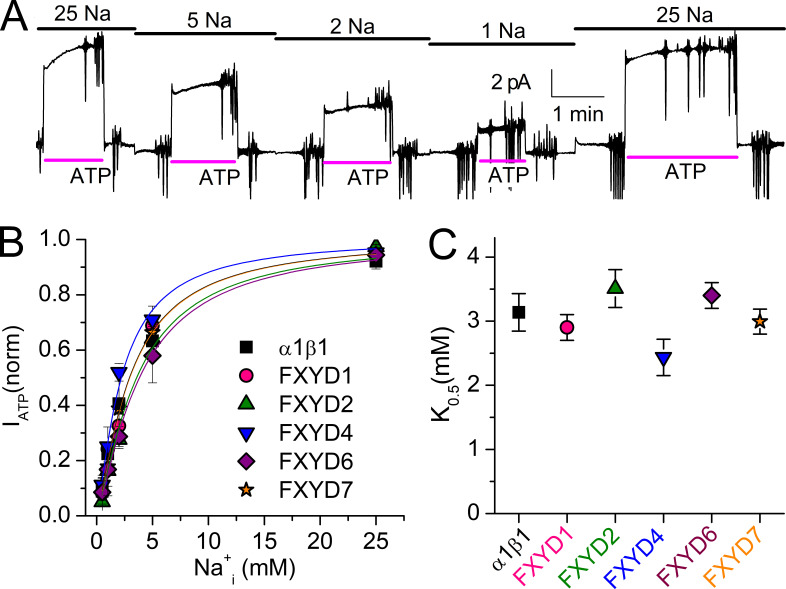
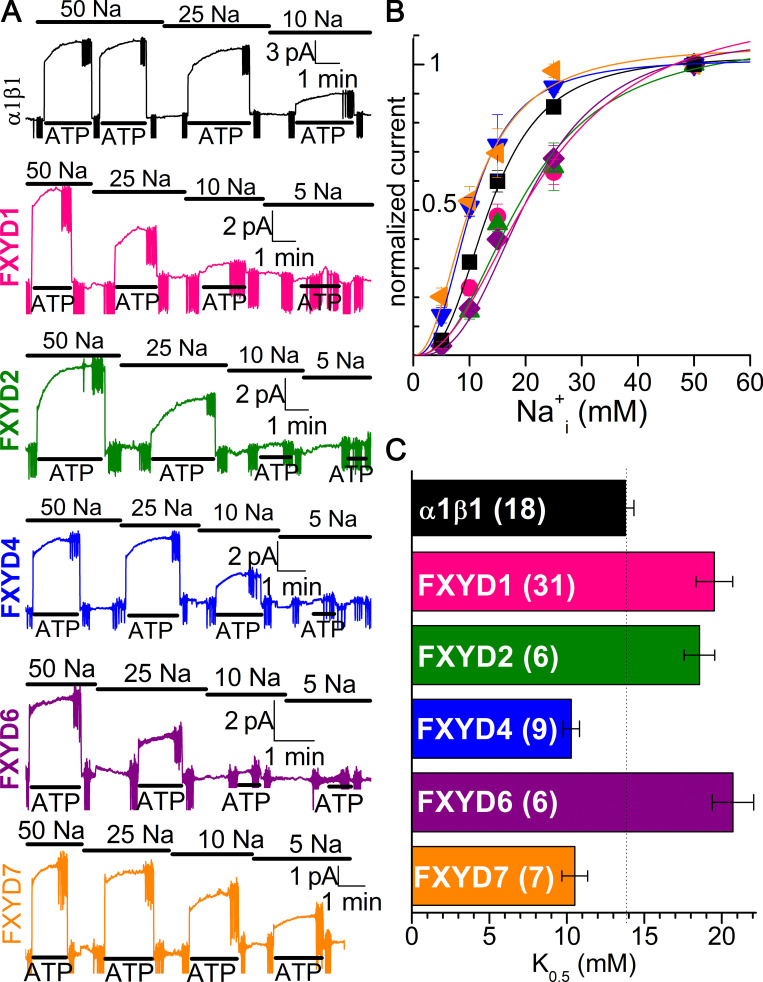
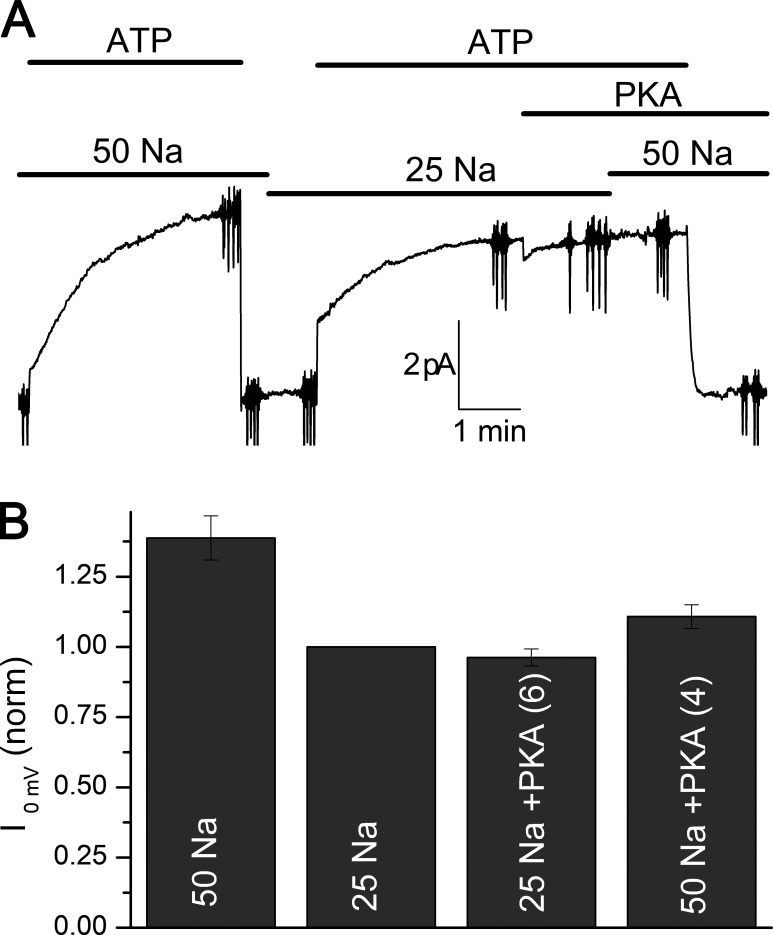
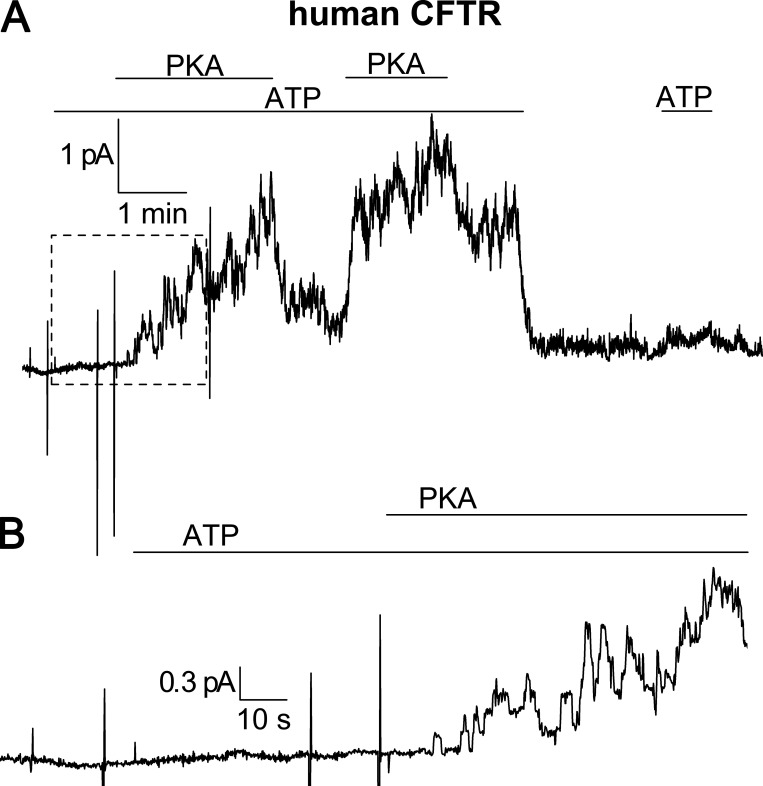
Tight regulation of the Na/K pump is essential for cellular function because this heteromeric protein builds and maintains the electrochemical gradients for Na+ and K+ that energize electrical signaling and secondary active transport. We studied the regulation of the ubiquitous human α1β1 pump isoform by five human FXYD proteins normally located in muscle, kidney, and neurons. The function of Na/K pump α1β1 expressed in Xenopus oocytes with or without FXYD isoforms was evaluated using two-electrode voltage clamp and patch clamp. Through evaluation of the partial reactions in the absence of K+ but presence of Na+ in the external milieu, we demonstrate that each FXYD subunit alters the equilibrium between E1P(3Na) and E2P, the phosphorylated conformations with Na+ occluded and free from Na+, respectively, thereby altering the apparent affinity for Na+. This modification of Na+ interaction shapes the small effects of FXYD proteins on the apparent affinity for external K+ at physiological Na+. FXYD6 distinctively accelerated both the Na+-deocclusion and the pump-turnover rates. All FXYD isoforms altered the apparent affinity for intracellular Na+ in patches, an effect that was observed only in the presence of intracellular K+. Therefore, FXYD proteins alter the selectivity of the pump for intracellular ions, an effect that could be due to the altered equilibrium between E1 and E2, the two major pump conformations, and/or to small changes in ion affinities that are exacerbated when both ions are present. Lastly, we observed a drastic reduction of Na/K pump surface expression when it was coexpressed with FXYD1 or FXYD6, with the former being relieved by injection of PKA's catalytic subunit into the oocyte. Our results indicate that a prominent effect of FXYD1 and FXYD6, and plausibly other FXYDs, is the regulation of Na/K pump trafficking.


Figures

Figure 1.
Figure 1.
FXYD amino acid sequence alignment and Na/K pump enzymatic cycle. (A) Alignment of the five human FXYD isoforms studied in this work. Residues in the transmembrane (TM), cytoplasmic, and extracellular regions of the isoforms are indicated. (B) Post-Albers kinetic scheme of the Na/K pump cycle (clockwise forward direction). The pump alternates between two major conformations, E1 and E2, which can exist in dephosphorylated or phosphorylated (P) forms. Parentheses indicate ions occluded within the protein. Transitions within the red box produce transient charge movement: the release of the first Na+ (forward cycle) or rebinding of the last Na+ (backward cycle) during E1P(3Na+) ↔ E2P(2Na+) + Na+o produces the slow transient charge movement, while the release of the last two Na+ ions (forward cycle) or rebinding of the first two Na+ ions (backward cycle) during E2P(2Na+) ↔ E2P + 2Na+o produces fast charge movement.
Figure 2.
Figure 2.
Recording and analysis of an experiment to determine the K0.5 for K+o. (A) Current at −50 mV of a Na+-loaded oocyte overexpressing the α1β1 pump, bathed in Na+o solution. Substituting Na+o with K+o stimulated outward current in a [K+]-dependent manner. Application of 0.5 mM ouabain for 2 min blocked currents in subsequent K+ applications. Vertical deflections along the recording indicate pulses to voltages between −100 and +40 mV. Lowercase letters indicate currents used to obtain ouabain-sensitive currents in B. (B) I-V plot of ouabain-sensitive current (current before ouabain application − current after ouabain application in the same condition) measured during the last 5 ms of 100-ms-long voltage pulses. (C) [K+o] dependence of ouabain-sensitive current at −100 and 0 mV fitted with Hill equations (line plots). (D) Voltage dependence of K0.5 for K+o.
Figure 3.
Figure 3.
Effect of FXYD subunits on transient currents. (A–F) Ouabain-sensitive currents elicited by voltage steps from the holding potential to −100 and +40 mV recorded from oocytes bathed in external Na+ solution 3–6 d after injection with α1β1 (A), α1β1FXYD1 (B), α1β1FXYD2 (C), α1β1FXYD4 (D), α1β1FXYD6 (E), or α1β1FXYD7 (F). The oocyte in B was held at −35 mV, and the rest were held at −50 mV. Depolarizing voltage pulses from the holding potential produce transient outward currents, whereas hyperpolarizing voltage pulses produce transient inward currents. The dashed lines are monoexponential fits to the current, beginning 3 ms after the voltage step.
Figure 4.
Figure 4.
Effect of FXYDs on charge movement. (A) Mean transient charge-movement rate for α1β1 alone or coexpressed with FXYD proteins. The rates were calculated from monoexponential fits to the integral of transient currents. (B) Mean normalized Q-V curves for α1β1 alone or when coexpressed with FXYD isoforms. Error bars are SEM in both panels. See also Table 2 (note that the α1β1 and α1β1FXYD1 shown here are those that started at a holding potential of −50 mV).
Figure 5.
Figure 5.
Effect of FXYD isoforms on turnover rate. Mean turnover rate at 4.5 mM K+o as a function of voltage. Error bars are SEM. Data from Warner amplifier are shown. Values at 0 mV are (± SD in s−1): 14.9 ± 3.0 (n = 47, data from Warner and Dagan amplifiers) for α1β1, 12.9 ± 3.0* for α1β1FXYD1 (n = 20, data from Warner and Dagan amplifiers), 12.8 ± 3.9 for α1β1FXYD2, 14.7 ± 3.3 for α1β1FXYD4, 19.1 ± 3.1 for α1β1FXYD6**, and 13.3 ± 1.7 for α1β1FXYD7. Note that there are more oocytes where we measured pump current at 4.5 mM K+o and charge movement than full dose–response curves and charge movement. Significantly different with respect to α1β1 alone by t test: *, P < 0.05; **, P < 0.001.
Figure 6.
Figure 6.
FXYD1 and FXYD6 reduce pump current. (A and B) Mean normalized K+o-induced currents from oocytes expressing α1β1 (n = 40) or α1β1FXYD1 (n = 45; A) and for α1β1 (n = 38) or α1β1FXYD6 (n = 29; B). Each group was normalized to the mean outward current from α1β1 oocytes measured the same day or on subsequent days in seven batches of oocytes in each condition. Error bars are SEM. Normalized data points from individual oocytes are shown as open circles. Asterisks indicate significantly different with respect to α1β1 alone by t test, **, P < 0.001.
Figure 7.
Figure 7.
Reduced plasma membrane expression of Na/K pumps with FXYD1 and FXYD6. (A) Confocal image of representative oocytes following incubation in BODIPY FL-ouabain (1 µM). Note that preincubation of uninjected oocytes with unlabeled ouabain (UI+ouab) eliminates the signal observed in uninjected oocytes (UI). Fluorescence intensity was measured in two concentric circles (one including the plasma membrane signal) to subtract background fluorescence. The bar graph at the bottom summarizes results from two batches of oocytes (one batch for FXYD6) normalized to the fluorescence intensity measured in oocytes injected with α1β1 alone. (B) Representative Western blot of plasma membrane preparations from oocytes expressing α1β1 (lane 2), α1β1FXYD1 (lane 3), and FXYD1 alone (lane 4), 3 d after injection (14 oocytes in each condition). The top half was probed with the pan-α-antibody (a5, Developmental Studies Hybridoma Bank) and an anti-mouse secondary antibody (IRDye 800 CW goat anti-mouse; LI-COR). The bottom half was incubated with a polyclonal FXYD1 antibody (ab76597; Abcam) and an anti-rabbit secondary antibody (IRDye 680RD goat anti-rabbit; LI-COR). The bar graphs at the bottom summarize results from five membrane preparations from four oocyte batches, normalized to the intensity of α1β1 alone. Pump current activated by 4.5 mM K+, 145 mM Na+ in 28 α1β1 and 34 α1β1FXYD1 oocytes included in these membrane preparations were 219 ± 19 nA and 100 ± 10 nA (mean ± SEM), respectively.
Figure 8.
Figure 8.
Effect of PKA on α1β1FXYD1 expression and kinetics. (A and B) Representative recordings of dose–response for K+o on oocytes expressing α1β1FXYD after injection with PKA (A) or PKI (B). (C) Mean K0.5-V from oocytes expressing α1β1FXYD1 injected with PKA (n = 20) or PKI (n = 19). (D) Mean normalized current induced by 10 mM K+o in two batches of oocytes expressing α1β1 or α1β1FXYD1 after injection with PKA or PKI, measured on the same day. Error bars are SEM. Asterisks indicate significantly different at P < 0.001. (E) Turnover rate in 4.5 mM K+o for oocytes expressing α1β1FXYD1 injected with PKA (n = 10) or PKI (n = 10). Error bars are SEM.
Figure 9.
Figure 9.
FXYD effects on Na/K pump interaction with Na+i in the presence of NMDG+i (without K+i). (A) Representative patch from an oocyte expressing α1β1 alone held at 0 mV with extracellular solution containing 5 mM K+o in NMDG+o. The bars on top indicate [Na+]i (in mM), and the bars under the traces indicate application of MgATP (4 mM) to activate outward Na/K pump current. Note the biphasic activation, more obvious in first ATP application. Vertical deflections correspond to application of 25-ms-long voltage pulses. (B) Mean ATP-induced current as a function of [Na+]i. Line plots are Hill equations with the parameters in Table 3. (C) K0.5,Na+ for each FXYD. Error bars are SEM.
Figure 10.
Figure 10.
FXYD effects on Na/K pump interaction with Na+i in the presence of K+i. (A) Patches from oocytes expressing each FXYD protein were held at 0 mV with extracellular solution containing 5 mM K+o in NMDG. The bars on top indicate [Na+]i (in mM), and the bars under the traces indicate application of MgATP (4 mM) to activate outward Na/K pump current. Vertical deflections correspond to application of 25-ms-long voltage pulses. Note biphasic activation by ATP. (B) Mean ATP-induced current as a function of [Na+]i, normalized to the value at 50 mM Na+i. Line plots are Hill equations with the parameters in Table 3. (C) K0.5,Na+ for each FXYD, from the number of experiments in parentheses. Error bars are SEM.
Figure 11.
Figure 11.
PKA failed to increase Na/K pump current at 25 mM Na+i. (A) Na/K pump current was activated by application of ATP in 50 mM and then 25 mM Na+i. After the current reached steady state, PKA was applied at 25 mM Na+i without effect during 2 min. Subsequent application of 50 mM Na+i minimally increased the current. (B) Bar graph summarizing results from six patches (four at 50 mM Na+i) in which similar maneuvers were performed.
Figure S1.
Figure S1.
CFTR recording in a giant patch demonstrating PKA activity. As a positive control for the patch-clamp experiments on α1β1FXYD1, we tested the ability of the same preparation of PKA to activate CFTR, typically a few days after the α1β1FXYD1 recordings. (A) Current recording at 0 mV from a large, inside-out patch excised from an oocyte 1 d after injection with human CFTR cRNA. Endogenous Na/K pumps were inhibited by incubating the oocyte in 10 µM ouabain before the experiment. The pipette contained the same external NMDG+ solution with 5 mM K+ as other patch clamp experiments, and the inside of the patch was perfused with 25 mM Na+ internal solution ([Na+] + [K+] = 140 mM). Under these experimental conditions (∼150 mM external Cl and ∼30 mM internal Cl, 0 mV), CFTR currents are outward. Application of 4 mM ATP alone to the inside of the patch produced no change in the baseline current, but simultaneous application of ATP with 10 µM PKA catalytic subunit induced an outward current that returned to baseline upon their removal. The large, vertical current deflections before the initial PKA application are 25-ms I-V pulses. (B) Enlargement of the current trace enclosed by the dashed box in A. Single-channel openings are visible ∼10 s after application of ATP and PKA.

Comment in

  • What FXYDs fix.
    Habeck M, Poulsen H. Habeck M, et al. J Gen Physiol. 2021 Jun 7;153(6):e202012845. doi: 10.1085/jgp.202012845. J Gen Physiol. 2021. PMID: 33871566 Free PMC article.

Similar articles

Cited by

References

    1. Artigas P., Al’aref S.J., Hobart E.A., Díaz L.F., Sakaguchi M., Straw S., and Andersen O.S.. 2006. 2,3-butanedione monoxime affects cystic fibrosis transmembrane conductance regulator channel function through phosphorylation-dependent and phosphorylation-independent mechanisms: the role of bilayer material properties. Mol. Pharmacol. 70:2015–2026. 10.1124/mol.106.026070 - DOI - PubMed
    1. Arystarkhova E., Wetzel R.K., and Sweadner K.J.. 2002. Distribution and oligomeric association of splice forms of Na+-K+-ATPase regulatory gamma-subunit in rat kidney. Am. J. Physiol. Renal Physiol. 282:F393–F407. 10.1152/ajprenal.00146.2001 - DOI - PubMed
    1. Arystarkhova E., Bouley R., Liu Y.B., and Sweadner K.J.. 2017. Impaired AQP2 trafficking in Fxyd1 knockout mice: A role for FXYD1 in regulated vesicular transport. PLoS One. 12:e0188006. - PMC - PubMed
    1. Attali B., Latter H., Rachamim N., and Garty H.. 1995. A corticosteroid-induced gene expressing an “IsK-like” K+ channel activity in Xenopus oocytes. Proc. Natl. Acad. Sci. USA. 92:6092–6096. 10.1073/pnas.92.13.6092 - DOI - PMC - PubMed
    1. Béguin P., Crambert G., Guennoun S., Garty H., Horisberger J.D., and Geering K.. 2001. CHIF, a member of the FXYD protein family, is a regulator of Na,K-ATPase distinct from the gamma-subunit. EMBO J. 20:3993–4002. 10.1093/emboj/20.15.3993 - DOI - PMC - PubMed

Publication types