. 2021 Mar 1;218(3):e20201707.
doi: 10.1084/jem.20201707.

Inflammasomes are activated in response to SARS-CoV-2 infection and are associated with COVID-19 severity in patients

Affiliations

Inflammasomes are activated in response to SARS-CoV-2 infection and are associated with COVID-19 severity in patients

Tamara S Rodrigues et al. J Exp Med. .

Abstract

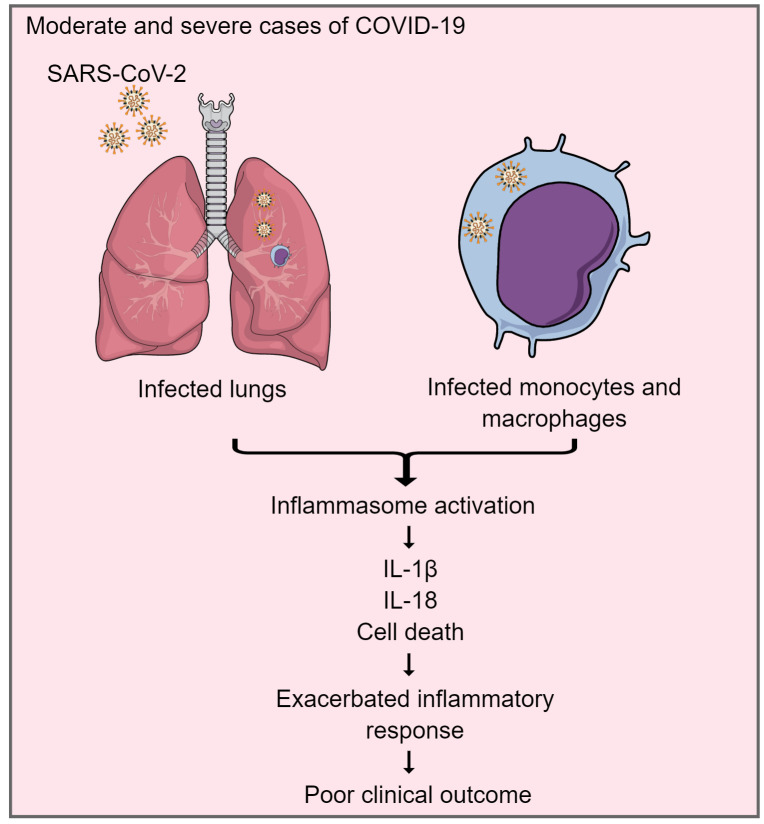
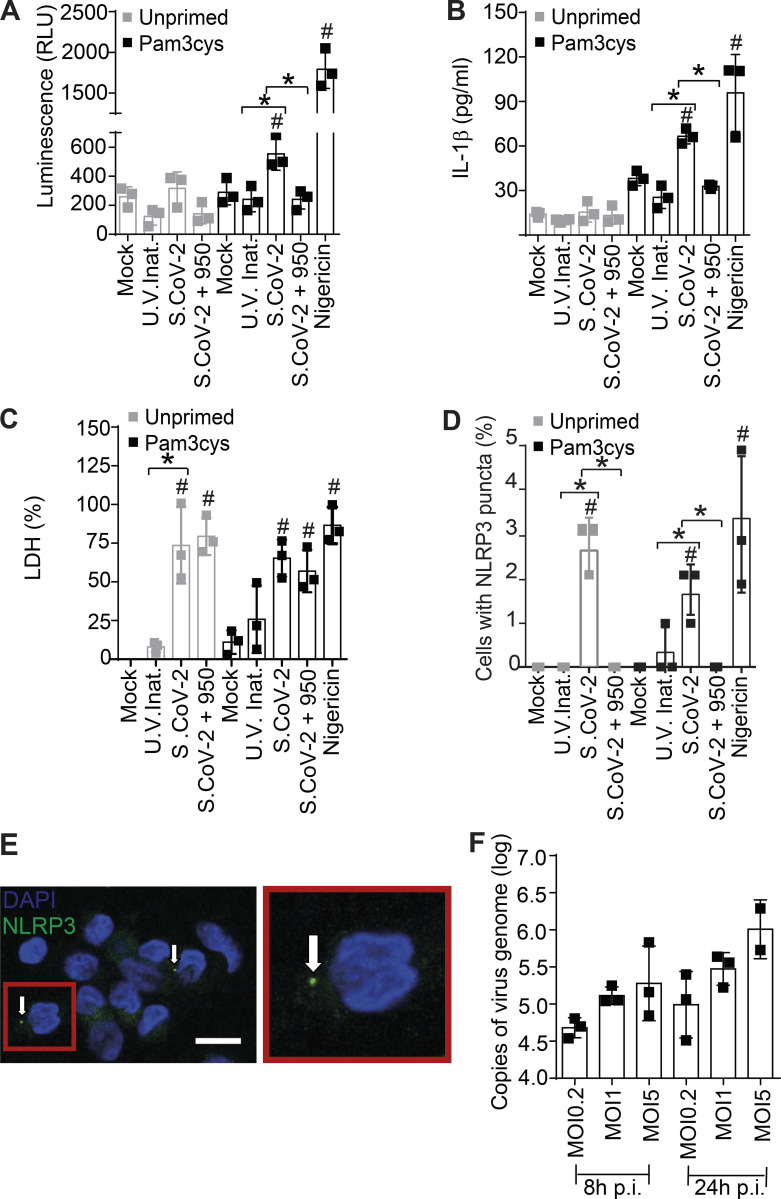
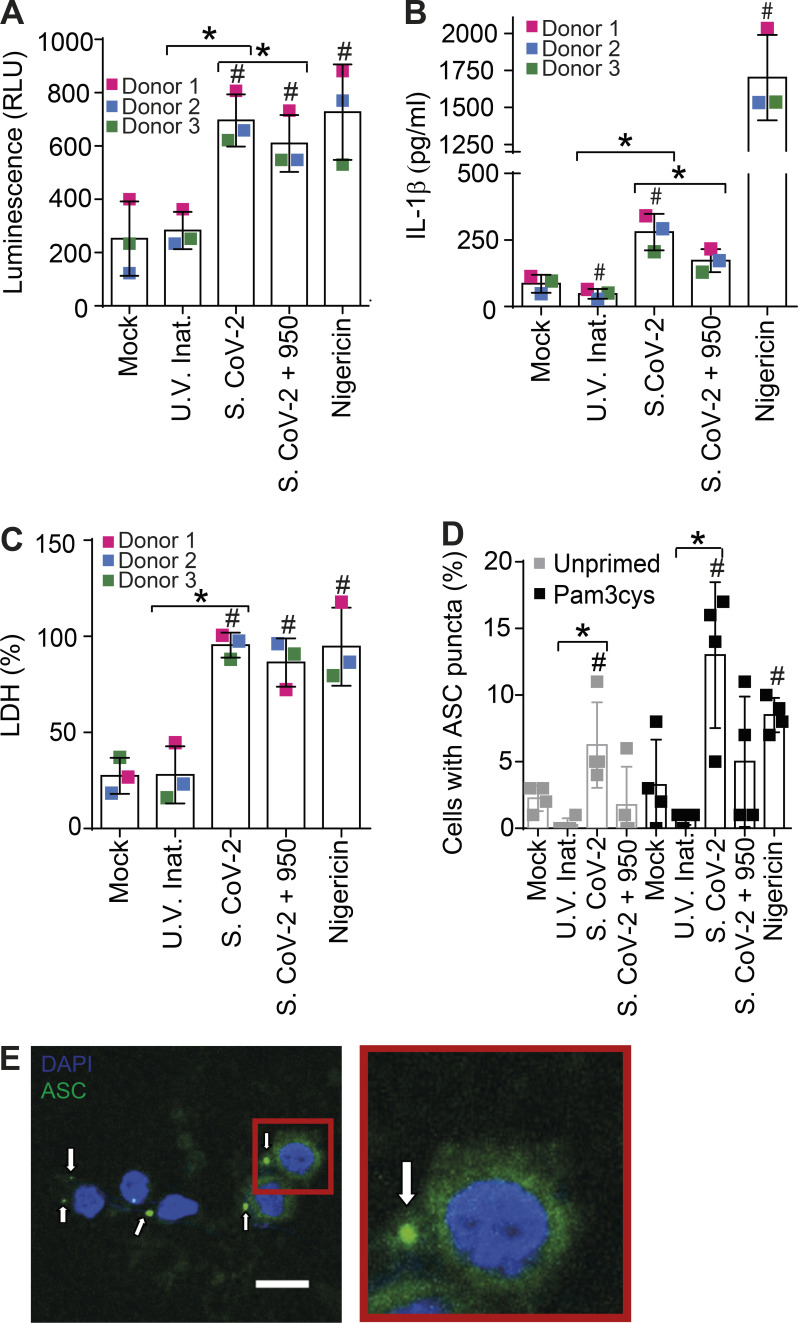
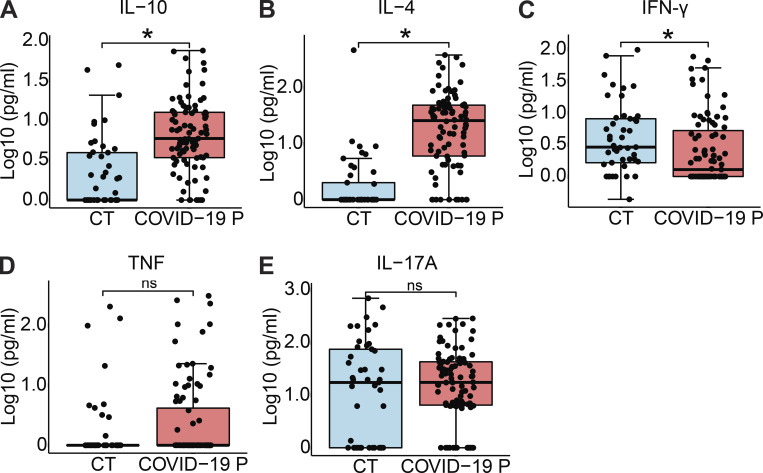
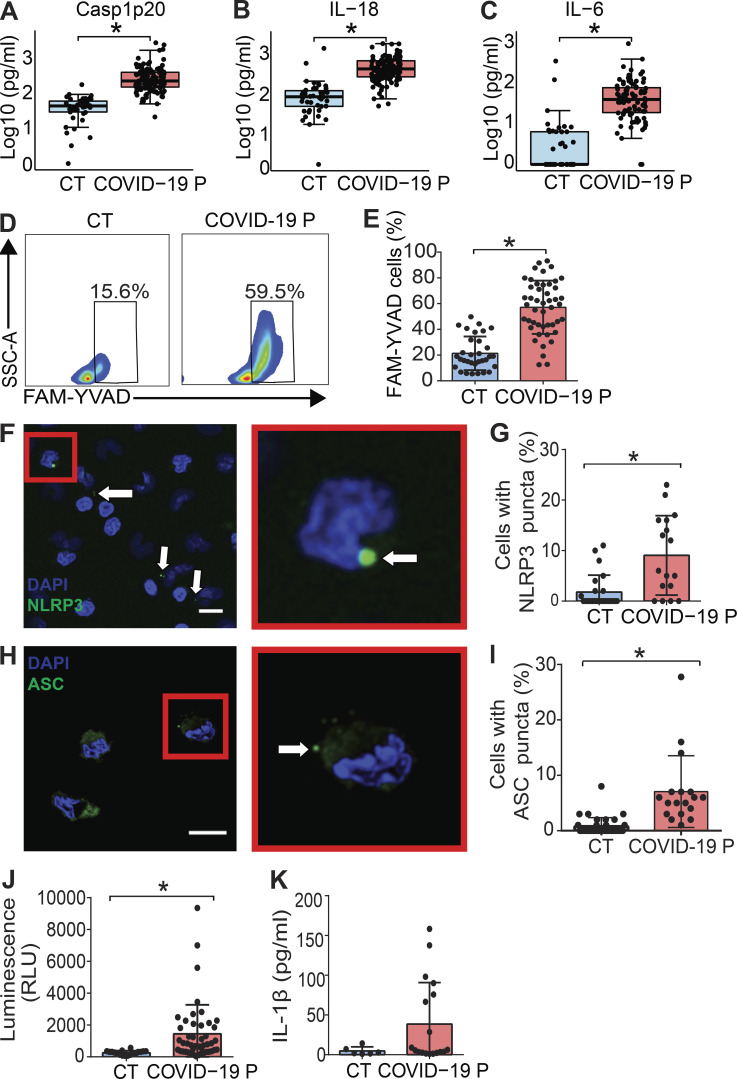
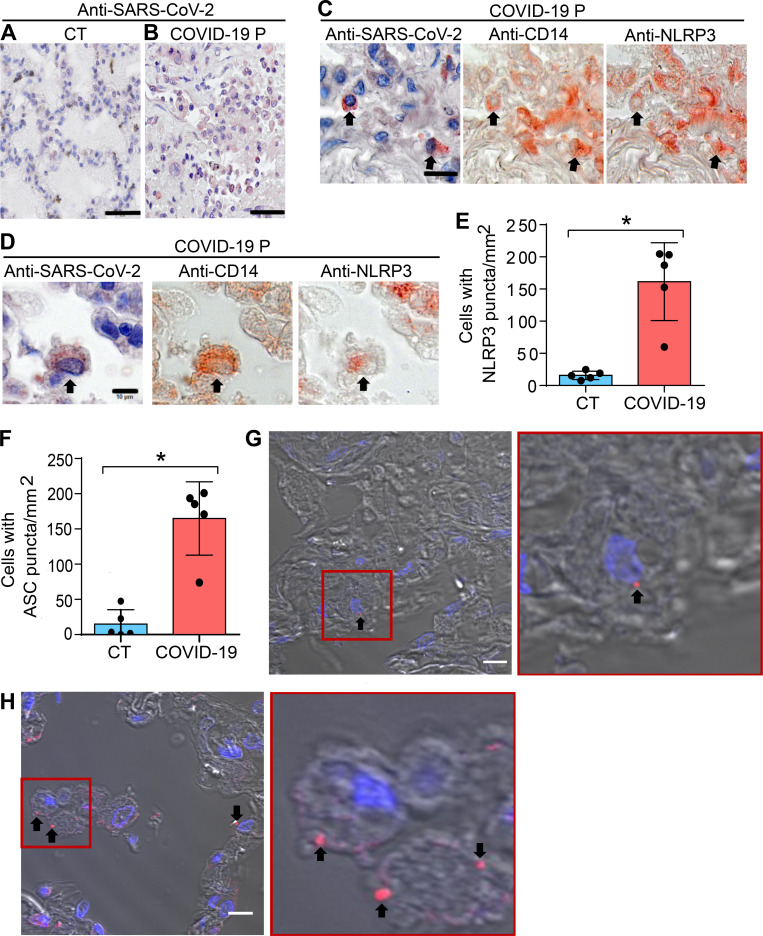
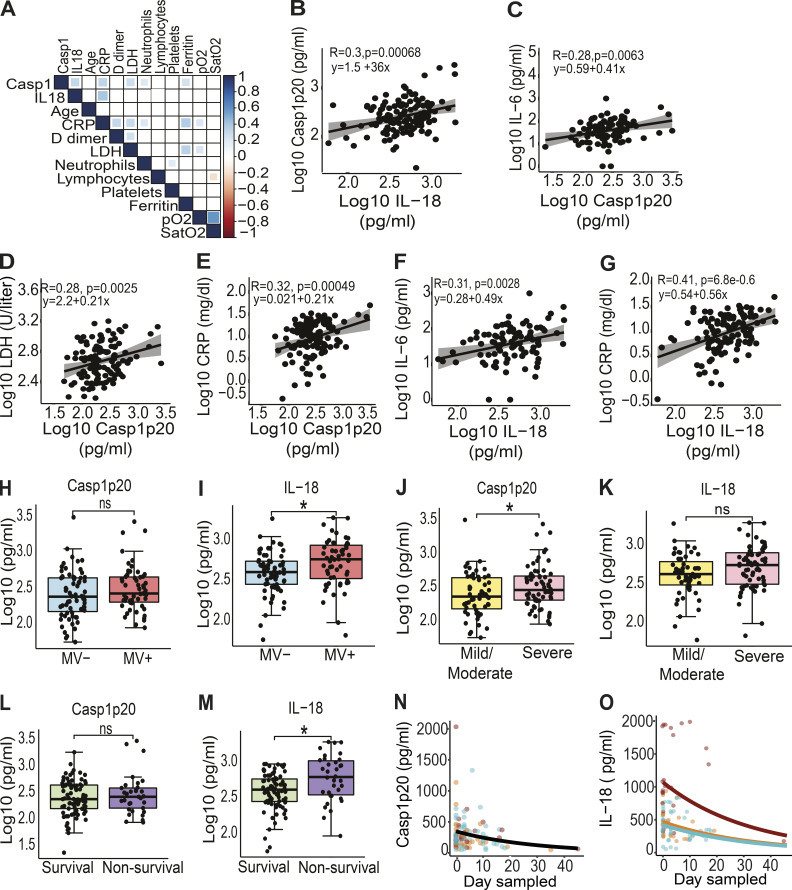
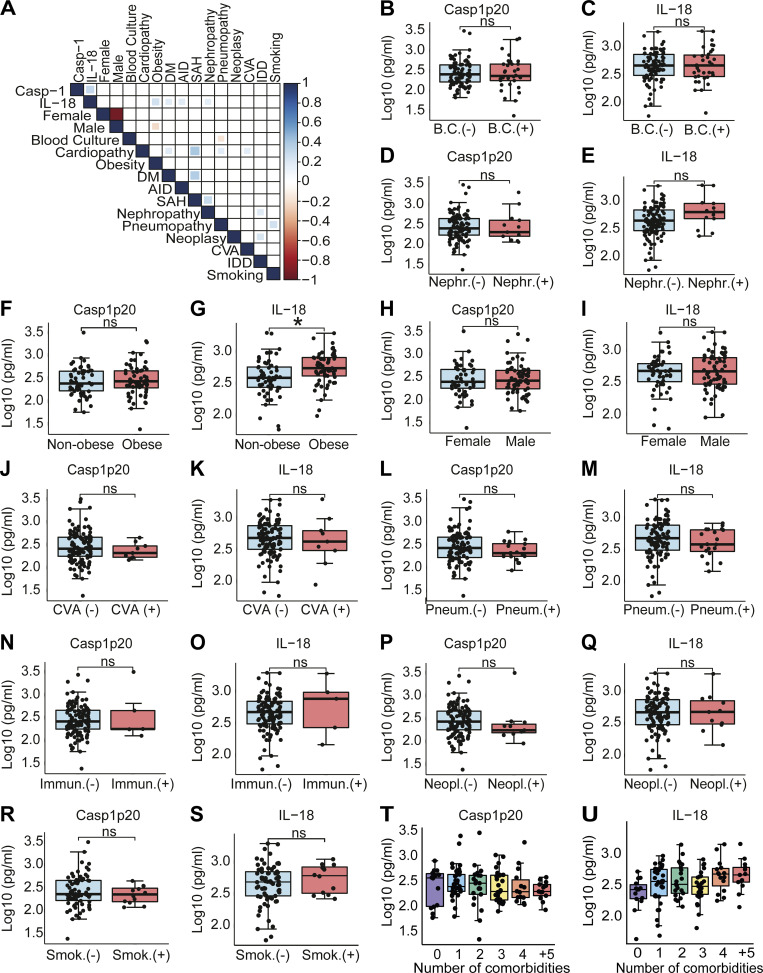
Severe cases of COVID-19 are characterized by a strong inflammatory process that may ultimately lead to organ failure and patient death. The NLRP3 inflammasome is a molecular platform that promotes inflammation via cleavage and activation of key inflammatory molecules including active caspase-1 (Casp1p20), IL-1β, and IL-18. Although participation of the inflammasome in COVID-19 has been highly speculated, the inflammasome activation and participation in the outcome of the disease are unknown. Here we demonstrate that the NLRP3 inflammasome is activated in response to SARS-CoV-2 infection and is active in COVID-19 patients. Studying moderate and severe COVID-19 patients, we found active NLRP3 inflammasome in PBMCs and tissues of postmortem patients upon autopsy. Inflammasome-derived products such as Casp1p20 and IL-18 in the sera correlated with the markers of COVID-19 severity, including IL-6 and LDH. Moreover, higher levels of IL-18 and Casp1p20 are associated with disease severity and poor clinical outcome. Our results suggest that inflammasomes participate in the pathophysiology of the disease, indicating that these platforms might be a marker of disease severity and a potential therapeutic target for COVID-19.


Conflict of interest statement

Disclosures: The authors declare no competing interests exist.

Figures

None
Graphical abstract
Figure 1.
Figure 1.
Infection of primary human monocytes with SARS-CoV-2 triggers NLRP3 inflammasome activation and cell death. Human CD14+ monocytes were primed or not with Pam3Cys (300 ng/ml) for 4 h and infected with SARS-CoV-2 at an MOI of 5 (or as indicated) for 24 h. Mock was used as a negative infection control and nigericin as a positive control for NLRP3 activation. The NLRP3 inhibitor MCC950 (10 µM) was added 1 h after viral infection and maintained (S.CoV-2 + 950). When indicated, the SARS-CoV-2 was inactivated by UV irradiation (U.V. Inat.). (A) Caspase-1 activity was measured in the tissue culture supernatants using the Caspase-Glo 1 assay. (B) IL-1β production in the tissue culture supernatants. (C) LDH release in the tissue culture supernatants. Triton X-100 (9%) was used to induce cell death and estimate 100% death. (D) Percentage of cells containing NLRP3 puncta was estimated by microscopy scoring. (E) A representative image of a monocyte containing NLRP3 puncta (green, indicated by arrows) is shown. Inset (red) shows a higher magnification of a cell containing NLRP3 puncta. DAPI stains cell nuclei (blue). Scale bar, 10 µm. (F) Viral loads in the cell culture supernatants were estimated by RT-PCR in monocytes infected for 8 and 24 h at the indicated MOI. #, P < 0.05 compared with mock treated cells; *, P < 0.05 comparing the indicated groups, as determined by Student’s t test. A, Pam3cys: Mock × S.CoV-2, P = 0.032; U.V. Inat. × S.Cov-2, P = 0.018; S.CoV-2 × S.Cov-2 + 950, P = 0.014; Mock × Nigericin, P = 0.0005. B, Pam3cys: Mock × S.CoV-2, P = 0.0022; U.V. Inat. × S.Cov-2, P = 0.0014; S.CoV-2 × S.Cov-2 + 950, P = 0.0004; Mock × Nigericin, P = 0.0194. C, unprimed: Mock × S.CoV-2, P = 0.0049; U.V. Inat. × S.Cov-2, P = 0.0104. C, Pam3cys: Mock × S.CoV-2, P = 0.0027; Mock × Nigericin, P = 0.0007. D, unprimed: Mock × S.CoV-2, P = 0.0013; U.V. Inat. × S.Cov-2, P = 0.0013; S.CoV-2 × S.Cov-2 + 950, P = 0.0075. D, Pam3cys: Mock × S.CoV-2, P = 0.0075; U.V. Inat. × S.Cov-2, P = 0.0474; S.CoV-2 × S.Cov-2 + 950, P = 0.0075; Mock × Nigericin, P = 0.0194. Box shows the average of triplicates ± SD of the values. Each technical triplicate is indicated as a square in the figure. Shown is one representative experiment out of three (A–F) experiments performed with similar results. p.i., postirradiation; RLU, relative light unit; S.CoV-2, SARS-CoV-2.
Figure S1.
Figure S1.
Infection of primary human monocytes with SARS-CoV-2 triggers NLRP3 inflammasome activation and cell death. (A–C) Human CD14+ monocytes obtained from three independent healthy donors (each labeled with a different color) were primed with Pam3Cys (300 ng/ml) for 4 h and infected with SARS-CoV-2 at an MOI of 5 for 24 h. Mock was used as a negative infection control and nigericin as a positive control for NLRP3 activation. The NLRP3 inhibitor MCC950 (10 µM) was added 1 h after viral infection and maintained (S.CoV-2 + 950). SARS-CoV-2 was inactivated by UV irradiation (U.V. Inat.). (A) Caspase-1 activity was measured in the tissue culture supernatants using the Caspase-Glo 1 assay. (B) IL-1β production in the tissue culture supernatants of monocytes. (C) LDH release measured in the tissue culture supernatants. Triton X-100 (9%) was used to induce cell death and estimate 100% death. (D) Human CD14+ monocytes obtained from one single donor were primed or not with Pam3Cys (300 ng/ml) for 4 h and infected with SARS-CoV-2 at a MOI of 5 for 24 h. The percentage of cell containing ASC puncta was estimated by microscopy scoring. (E) A representative image of monocytes containing ASC puncta (green, indicated by white arrows) is shown. Inset (red) shows a higher magnification of a cell containing ASC puncta. DAPI stains cell nuclei (blue). Scale bar 10 µm. #, P < 0.05 as compared with Mock treated cells; *, P < 0.05 comparing the two indicated groups, as determined by Student’s t test. Box shows the average ± SD of the values. (AC) Each square represents data from a single donor (A–C) or data from four technical replicates performed using cells from a single donor (D). We show one representative experiment out of three independent experiments performed with similar results.
Figure S2.
Figure S2.
Cytokine production in COVID-19 patients. Cytokine concentration in the serum controls individuals (CT, n = 45) and COVID-19 patients (COVID-19 P, n = 92; all tested positive using RT-PCR). (A–E) IL-10 (A), IL-4 (B), IFN-γ (C), TNF-α (D), and IL-17A (E) were measured by CBA. Data are shown as Log10-transformed concentrations in picograms per milliliter. *, P < 0.05 as determined by Student’s t test (A, P = 0.001550; B, P = 0.000000394; C, P = 0.029000; D, P = 0.3; E, P = 0.49). Each dot represents the value from a single individual. Box shows average ± SD of the values. ns, not significant.
Figure 2.
Figure 2.
Inflammasome activation in COVID-19 patients. (A–C) Cytokine concentration in the serum control individuals (CT, n = 42 to ELISA and 45 to CBA) and COVID-19 patients (COVID-19 P, n = 124 to ELISA and 92 to CBA; all tested positive using RT-PCR). Active caspase-1 (Casp1p20; A) and IL-18 (B) were measured by ELISA, and IL-6 (C) was measured by CBA. Data shown as Log10-transformed concentrations in picograms per milliliter. (D–I) PBMCs were isolated from fresh blood of CT or COVID-19 P. (D and E) FAM-YVAD+ PBMCs were estimated by FACS using the FLICA Caspase-1 Assay Kit. (D) Representative histograms of one representative CT and one COVID-19 P indicate the gate for determination of the percentage of FAM-YVAD+ cells. (E) The percentage of FAM-YVAD+ cells for the 32 CT and 47 COVID-19 P. (F) PBMCs from COVID-19 P were stained with anti-NLRP3 (green) for determination of NLRP3 puncta (white arrows) and DAPI to stain the cell nuclei (blue). Inset (red) shows a higher magnification of a cell containing NLRP3 puncta. Scale bar, 10 µm. (G) The percentages of cells with NLRP3 puncta are shown for 24 CT and 17 COVID-19 P. (H) PBMCs from COVID-19 P were stained with anti-ASC (green) for determination of ASC puncta (white arrow). DAPI stains the cell nuclei (blue). Inset (red) shows a higher magnification of a cell containing ASC puncta. Scale bar, 10 µm. (I) The percentages of cells with ASC puncta are shown for 35 CT and 18 COVID-19 P. (J) PBMCs from 18 CT and 46 COVID-19 P were maintained in culture for 16 h, and the supernatants were assayed for caspase-1 activity using the Caspase-Glo 1 Assay. (K) PBMCs from 6 CT or 18 COVID-19 P were maintained in culture for 16 h and IL-1β production were estimated by ELISA. *, P < 0.05 as determined by Student’s t test (A, P = 0.00000025; B, P = 0.0000063; C, P = 0.00000025) or Mann–Whitney test (E, P = 0.00018; G, P = 0.00076; I, P = 0.0011; J, P = 0.0076; K, P = 0.1293). Each dot represents the value from a single individual. Box corresponds to average ± SD of the values. Data shown in E, G, and I–K result from multiple experiments that have been pooled to generate the figures. SSC-A, side scatter–A; RLU, relative light unit.
Figure 3.
Figure 3.
Lung histopathological analysis and NLRP3 activation in fatal cases of COVID-19. Representative pulmonary histological findings in COVID-19 patient (COVID-19 P), autopsied by ultrasound-guided minimally invasive autopsy. (A and B) Representative immunohistochemical image of tissues from control (CT; A) or COVID-19 P (B) stained with anti–SARS-CoV-2. Scale bar, 50 µm. (C and D) Multiplex staining by sequential immunohistochemistry staining with anti–SARS-CoV-2, anti-CD14, and anti-NLRP3. Arrows indicate infected CD14+ cells expressing NLRP3. Scale bar, 20 µm (C) and 10 µm (D). (E and F) Quantification of NLRP3 (E) or ASC puncta (F) in pulmonary tissues of five CT and five COVID-19 P. Each dot in the figure represents the value obtained from each individual. Box corresponds to average ± SD of the values. *, P < 0.05, as determined by Student’s t test (E, P = 0.0079; F, P = 0.0079). (G and H) Multiphoton microscopy of pulmonary tissues stained with anti-NLRP3 (G) or anti-ASC (H) antibody showing inflammasome puncta (red, indicated by a black arrow). Insets (red) show a higher magnification of a cell containing NLRP3 (G) and ASC (H) puncta. DAPI stains cell nuclei (blue). Scale bar, 10 µm.
Figure 4.
Figure 4.
Inflammasome activation influences the clinical outcome of COVID-19. (A) Correlation matrix of Casp1p20 and IL-18 levels in the serum of COVID-19 patients on the hospitalization day with patient characteristics and clinical parameters. (B–J) Correlations of Casp1p20 with IL-18 (B), Casp1p20 with IL-6 (C), Casp1p20 with LDH (D), Casp1p20 with CRP (E), IL-18 with IL-6 (F), and IL-18 with CRP (G). (H and I) Levels of Casp1p20 (H) and IL-18 (I) in patients who required MV (MV+, blue box) or not (MV−, red box). (J and K) Levels of Casp1p20 (J) and IL-18 (K) in patients with mild/moderate (yellow box) or severe COVID-19 (pink box). (L and M) Levels of Casp1p20 (L) and IL-18 (M) in survivors (green box) or nonsurvivors (purple box). The levels of Casp1p20 and IL-18 were measured by ELISA and are shown as Log10-transformed concentrations in picograms per milliliter. *, P < 0.05 as determined by Student’s t test (H, P = 0.160; I, P = 0.014; J, P = 0.036; K, P = 0.068; L, P = 0.430; M, P = 0.0044). Each dot represents value from a single individual. Box corresponds to average ± SD of the values. (N and O) Derived predictions from the best-fit models retained in Casp1p20 (N) and IL-18 (O) longitudinal analyses; IL-18 model (O) comprises variation in the intercept among patient groups: death (red), critical/recovery (orange), and mild/recovery (blue). ns, not significant.
Figure S3.
Figure S3.
Association of inflammasome activation with clinical characteristics and comorbidities. (A) Matrix correlation of Casp1p20 and IL-18 levels in the serum of COVID-19 patients on the hospitalization day with clinical parameters and comorbidities. (B–S) Levels of Casp1p20 (B, D, F, H, J, L, N, P, and R) and IL-18 (C, E, G, I, K, M, O, Q, and S) in patients with such clinical parameters as cultivable bacteria in the blood (B and C), nephropathy (Nephr.; D and E), obesity (F and G), gender (H and I), cerebrovascular accident (CVA; J and K), pneumopathy (Pneum.; L and M), immunodeficiency (Immun.; N and O), neoplasia (Neopl.; P and Q), and smoking (Smok.; R and S). (T and U) Casp1p20 (T) and IL-18 (U) levels in the sera of COVID-19 patients associated with the number of patient comorbidities, ranging from no comorbidities (0) to more than five comorbidities (+5). The levels of Casp1p20 and IL-18 were measured by ELISA and are shown as Log10-transformed concentrations in picograms per milliliter. *, P < 0.05 as determined by Student’s t test (G, P = 0.0054). Each dot represents a value from a single individual. Box shows average ± SD of the values. B.C., blood culture; DM, diabetes mellitus; AID, autoimmune diseases; SAH, systemic arterial hypertension; CVA, cerebrovascular accident; IDD, immunodeficiency; ns, not significant.

References

    1. Alfaidi, M., Wilson H., Daigneault M., Burnett A., Ridger V., Chamberlain J., and Francis S.. 2015. Neutrophil elastase promotes interleukin-1β secretion from human coronary endothelium. J. Biol. Chem. 290:24067–24078. 10.1074/jbc.M115.659029 - DOI - PMC - PubMed
    1. Avrahami, R., Watemberg S., Hiss Y., and Deutsch A.A.. 1995. Laparoscopic vs conventional autopsy. A promising perspective. Arch. Surg. 130:407–409. 10.1001/archsurg.1995.01430040069014 - DOI - PubMed
    1. Barton, K. 2020. MuMIn: Multi-Model Inference. R package version 1.43.17. https://CRAN.R-project.org/package=MuMIn (accessed April 14, 2020)
    1. Bolker, B., and Robinson D.. 2020. broom.mixed: Tidying Methods for Mixed Models. R package version 0.2.6. https://CRAN.R-project.org/package=broom.mixed (accessed May 17, 2020)
    1. Brooks, M.E., Kristensen K., van Benthem K.J., Magnusson A., Berg C.W., Nielsen A., Skaug H.J., Maechler M., and Bolker B.M.. 2017. glmmTMB Balances Speed and Flexibility Among Packages for Zero-inflated Generalized Linear Mixed Modeling. R J. 9:378–400. 10.32614/RJ-2017-066 - DOI

Publication types