. 2021 Mar 1;218(3):e20192283.
doi: 10.1084/jem.20192283.

Limited rejuvenation of aged hematopoietic stem cells in young bone marrow niche

Affiliations

Limited rejuvenation of aged hematopoietic stem cells in young bone marrow niche

Wakako Kuribayashi et al. J Exp Med. .

Abstract

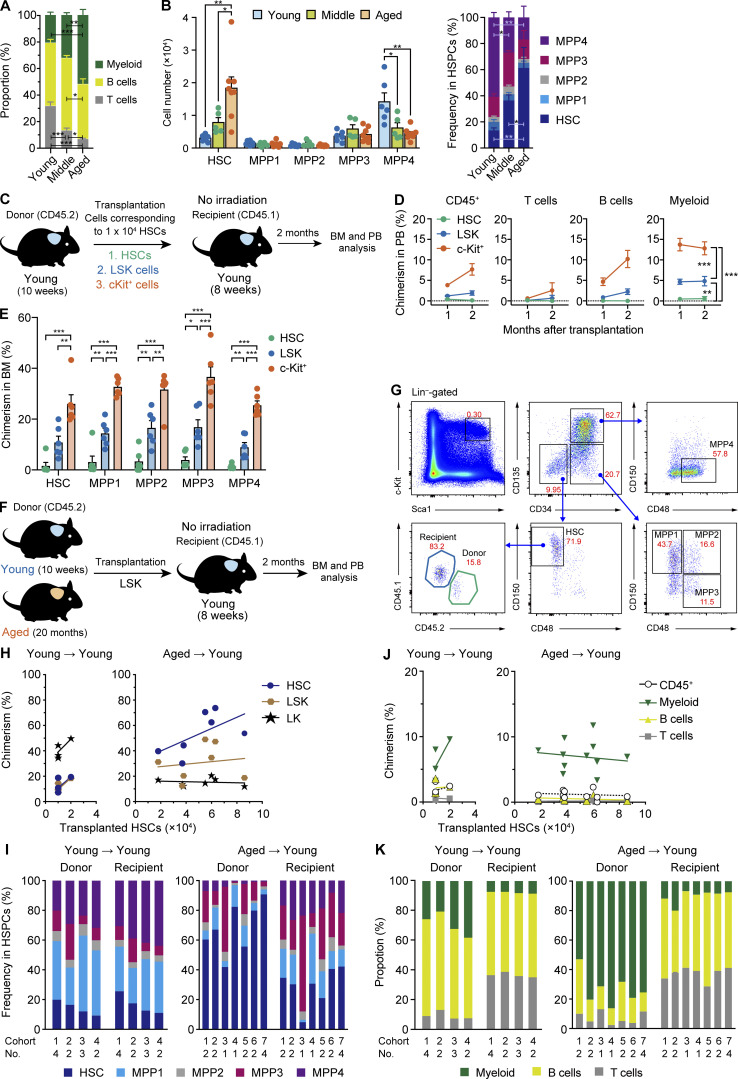
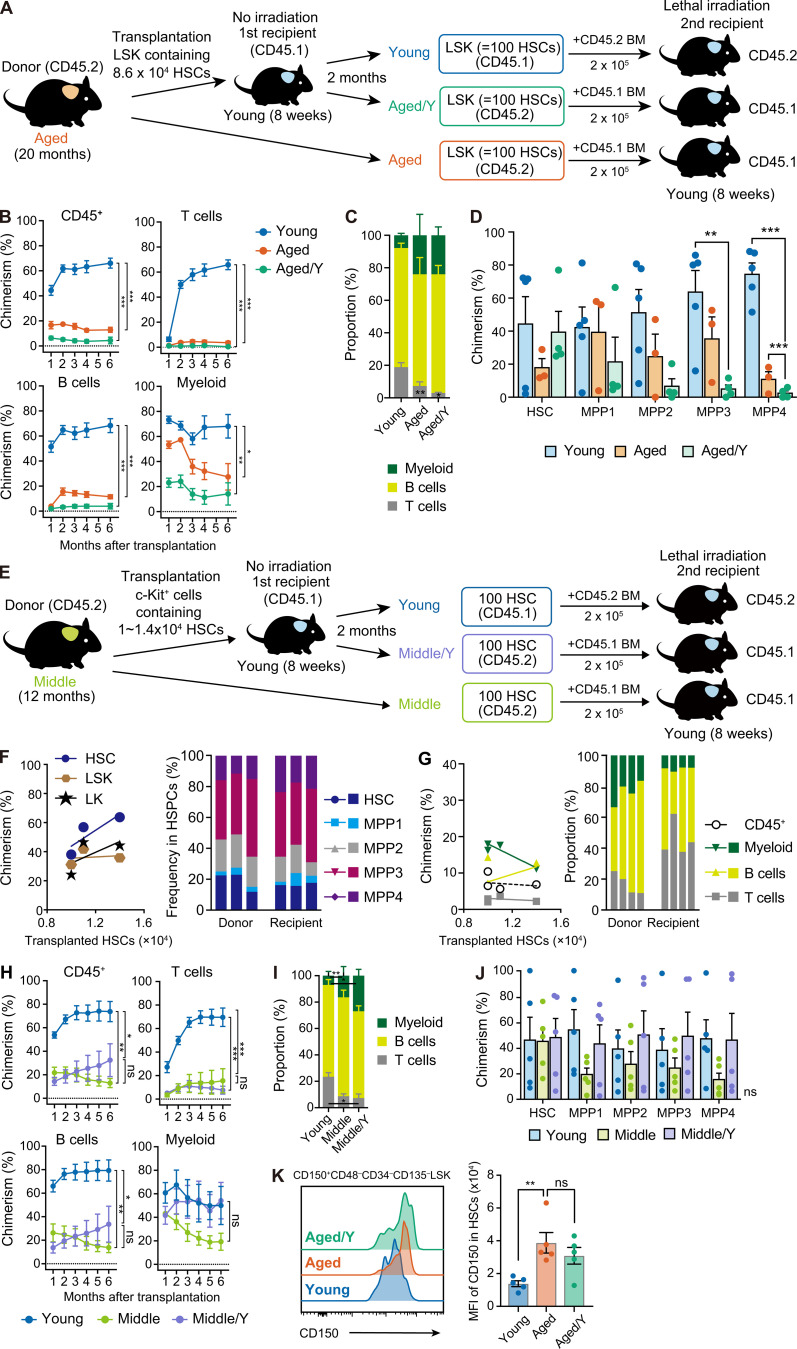
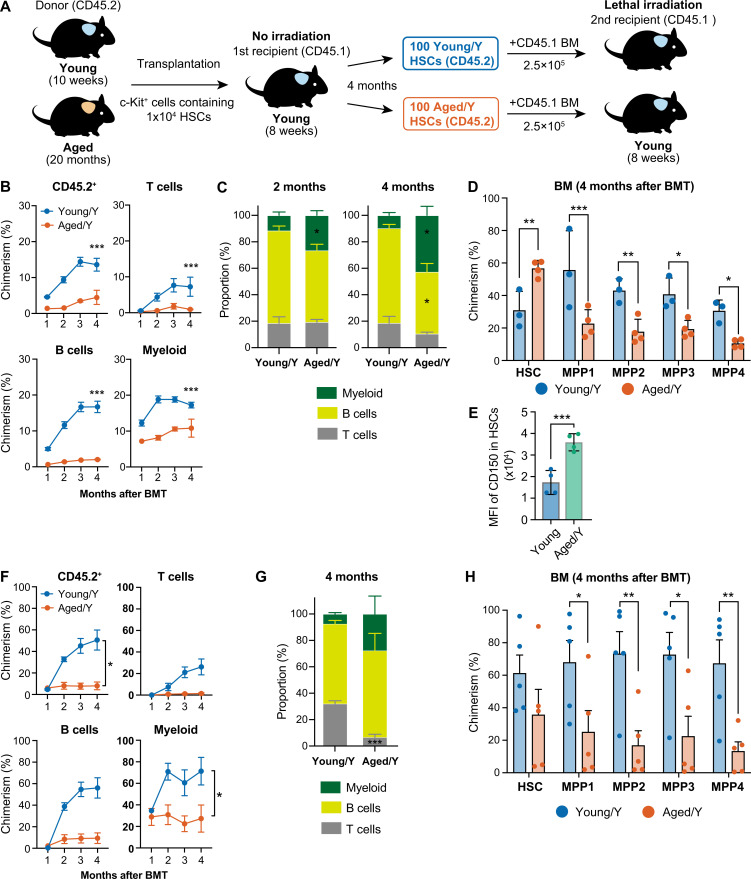
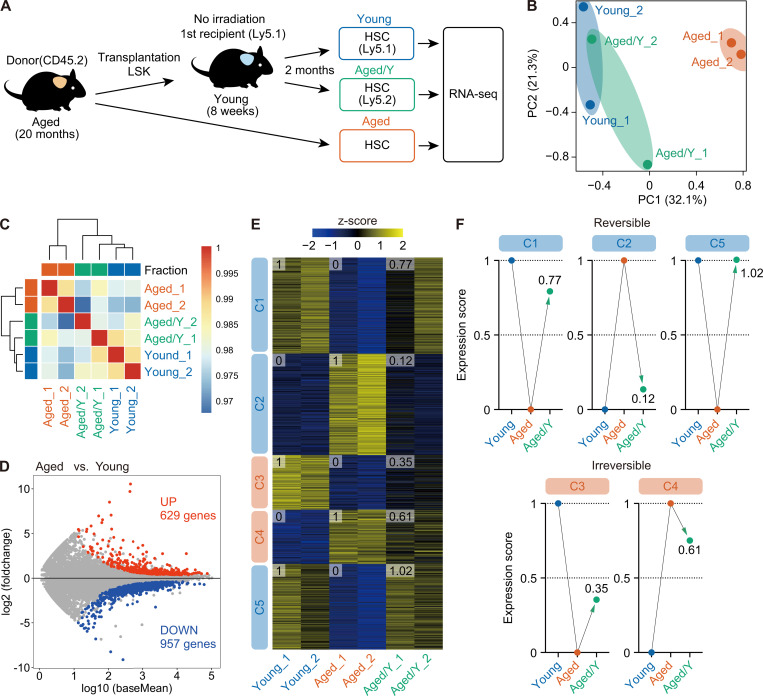
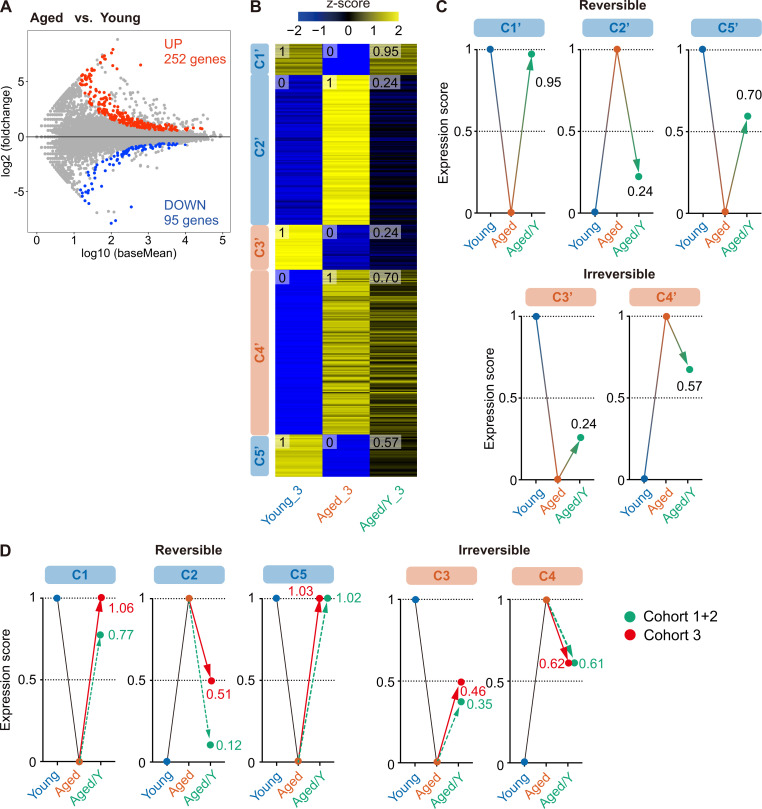
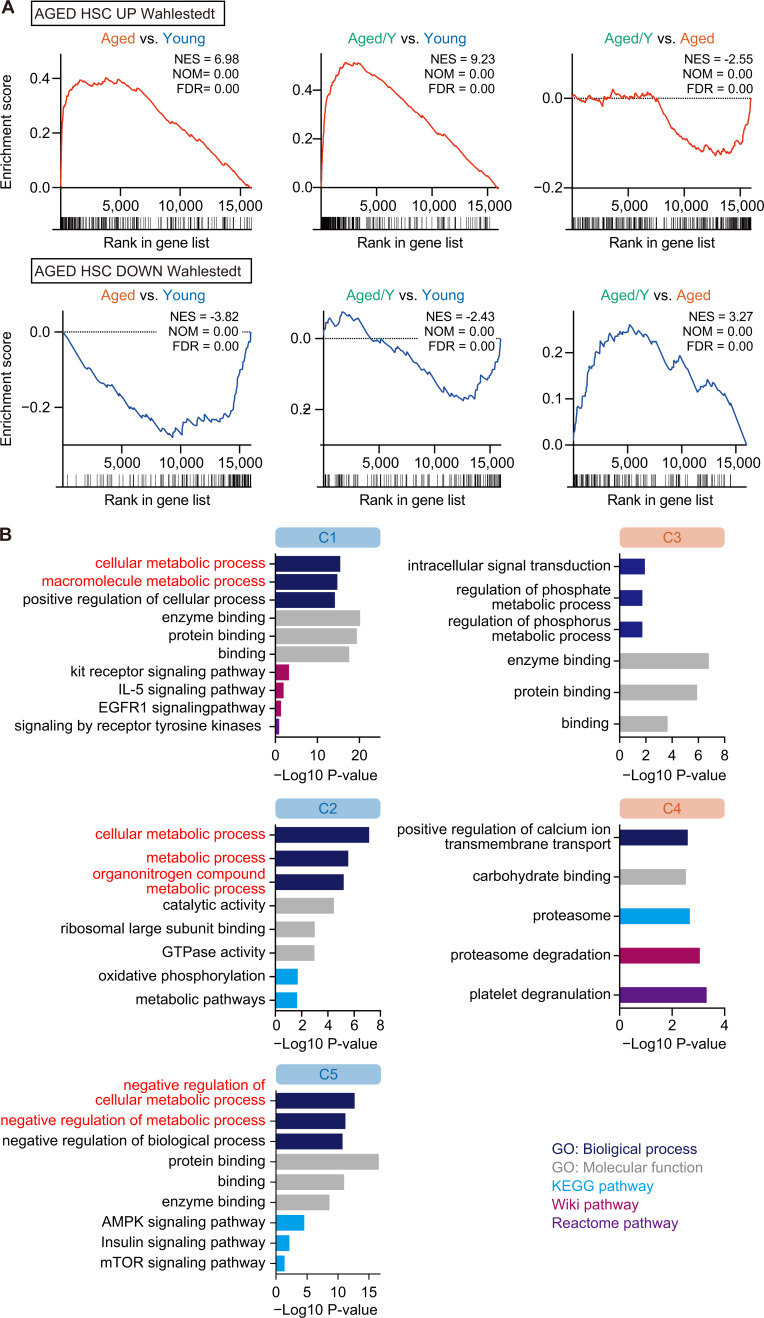
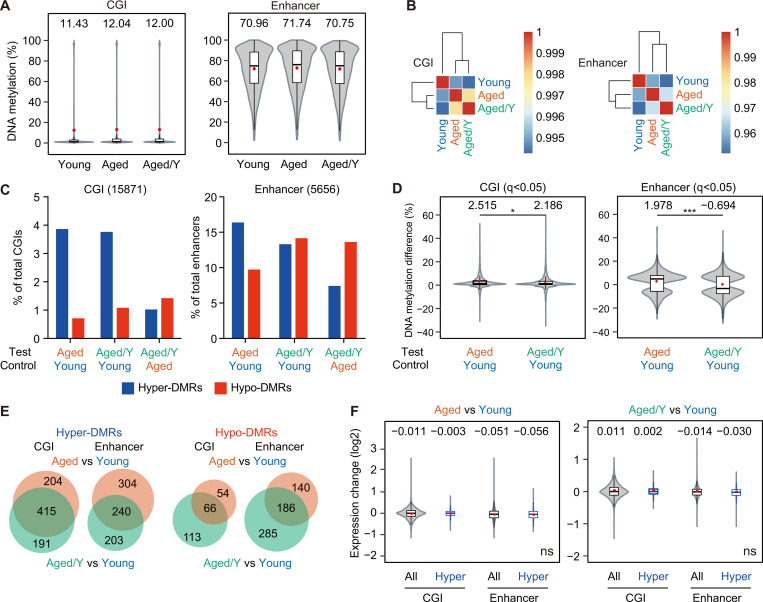
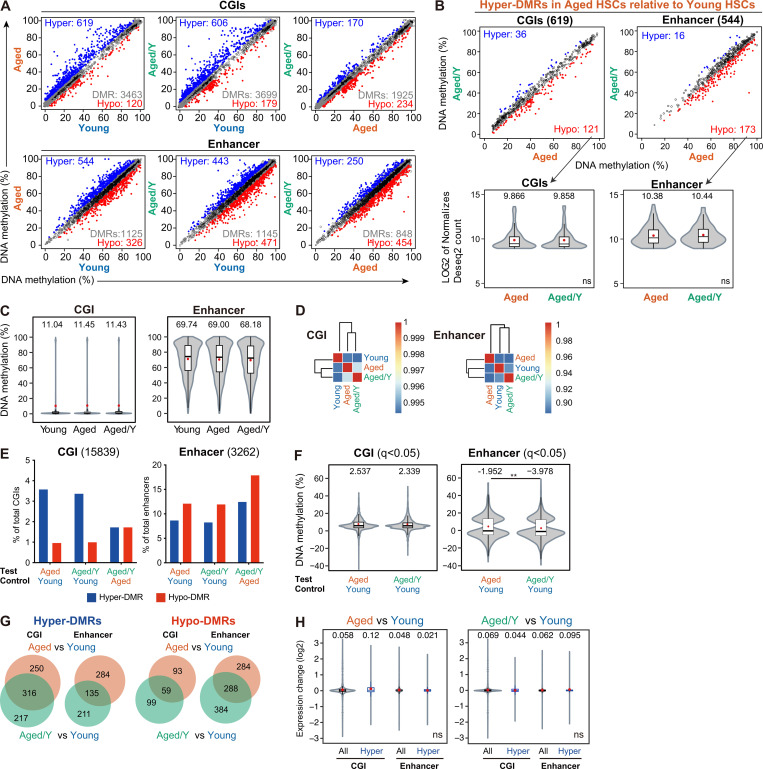
Hematopoietic stem cells (HSCs) exhibit functional alterations, such as reduced regenerative capacity and myeloid-biased differentiation, with age. The HSC niche, which is essential for the maintenance of HSCs, also undergoes marked changes with aging. However, it has been technically challenging to directly evaluate the contribution of niche aging to age-associated HSC alterations without niche-damaging myeloablation in HSC transplantation assays. We herein transplanted an excess of aged HSCs into young mice without preconditioning. Although aged HSCs successfully engrafted in the intact young bone marrow niche, they poorly regenerated downstream progenitors and exhibited persistent myeloid-biased differentiation, resulting in no significant functional rejuvenation. Transcriptome and methylome analyses revealed that the young niche largely restored the transcriptional profile of aged HSCs, but not their DNA methylation profiles. Therefore, the restoration of the young niche is insufficient for rejuvenating HSC functions, highlighting a key role for age-associated cell-intrinsic defects in HSC aging.


Conflict of interest statement

Disclosures: The authors declare no competing interests exist.

Figures

None
Graphical abstract
Figure 1.
Figure 1.
Hematopoiesis by aged HSCs engrafted in an unconditioned young niche. (A) The frequencies of myeloid (Mac-1+ and/or Gr-1+), B (B220+), and T (CD4+ or CD8+) cells in PB of Young, Middle, and Aged mice. (B) Cell numbers (left) and frequencies (right) of BM HSPCs. Data are shown as the mean ± SEM (n = 5–7, representative of two independent experiments). (C) Experimental strategy for the evaluation of engraftment efficiencies of HSPC fractions in the young niche. Purified 1 × 10⁴ HSCs and LSK and c-Kit+ cells that contained 1 × 10⁴ HSCs from 10-wk-old mice were transplanted into 8-wk-old mice without irradiation. (D) Chimerism of donor-derived hematopoietic cells in CD45+ (CD45.1+CD45.2) hematopoietic cells, myeloid, B, and T cells in PB of recipient mice (n = 6). (E) Chimerism of donor-derived cells in the BM HSCs and MPPs of recipient mice at 2 mo after transplantation (n = 6, pooled from three independent experiments). (F) Experimental strategy for the functional evaluation of aged HSCs in the young niche. Different numbers of LSK cells that contained 1–2 × 10⁴ HSCs from Young mice (Young HSCs) or LSK cells that contained 1.8–8.6 × 10⁴ HSCs from Aged HSCs were transplanted into 8-wk-old mice without irradiation. We used pooled donor HSCs collected from several mice. (G) Gating strategies to identify Young and Aged/Y HSCs and MPP1-4. The frequencies in total BM cells are indicated. (H) Chimerism of donor-derived cells in BM HSCs, LSK cells, and LK cells at 2 mo after transplantation. Each dot represents the average value of a single cohort consisting of one to four mice. The x axes indicate the numbers of HSCs that were contained in transplanted LSK cells. (I) Frequencies of donor- and recipient-derived HSCs and MPPs in BM cells, respectively. Data on the average value of each cohort consisting of one to four mice are shown in individual bars. (J) Chimerism of donor-derived hematopoietic cells in CD45+ (CD45.1+CD45.2) hematopoietic, myeloid, B, and T cells in PB of recipient mice. Each dot represents the average value of a single cohort consisting of one to four mice. The x axes indicate the numbers of HSCs that were contained in transplanted LSK cells. (K) Frequencies of donor- and recipient-derived myeloid, B, and T cells in PB cells, respectively. Data on the average value of each cohort consisting of one to four mice are shown in individual bars. Error bars represent SEM. *, P < 0.05; **, P < 0.01; ***, P < 0.001 by one-way ANOVA.
Figure 2.
Figure 2.
Persistent functional defects in Aged HSCs in the young niche. (A) Experimental strategy for the functional evaluation of Aged HSCs in the young niche. Aged LSK cells containing 8.6 × 10⁴ HSCs were transplanted into Young recipient mice without irradiation. Donor-derived (Aged/Y) and host (Young) LSK cells containing 100 HSCs were purified from primary recipients at 2 mo after transplantation and then transplanted into lethally irradiated 8-wk-old secondary recipient mice along with 2 × 10⁵ BM competitor cells. Freshly isolated Aged LSK cells containing 100 HSCs were also transplanted as controls. (B) Chimerism of donor-derived hematopoietic cells in CD45+ (CD45.1+CD45.2) hematopoietic, myeloid, B, and T cells in PB of recipient mice receiving Young, Aged, or Aged/Y LSK cells (n = 3–5). (C) Frequencies of myeloid, B, and T cells in donor-derived PB cells 6 mo after transplantation (n = 3–5). (D) Chimerism of donor-derived HSPCs in BM HSCs and MPPs in recipient mice 6 mo after transplantation (n = 3–5, representative of three independent experiments). (E) Experimental strategy for the functional evaluation of Middle HSCs in the young niche. c-Kit+ cells that contained ∼1.0–1.4 × 10⁴ HSCs from 12-mo-old mice were transplanted into 8-wk-old mice without irradiation. 2 mo after transplantation, hematopoietic cells derived from engrafted Middle HSCs (Middle/Y HSCs) and host HSCs (Young HSCs) were analyzed (F and G; data were pooled from four independent experiments). At the same time, 100 Middle/Y and host (Young) HSCs purified from primary recipients were transplanted into lethally irradiated 8-wk-old secondary recipient mice along with 2 × 10⁵ BM competitor cells. Freshly isolated HSCs from 12-mo-old mice (Middle HSCs) were also transplanted as controls (H–J; representative data from two independent experiments are shown). (F) Chimerism of Middle HSC-derived cells in BM HSCs, LSK cells, and LK cells at 2 mo after transplantation (n = 4). The x axes indicate the numbers of HSCs that were contained in transplanted c-Kit+ cells (left panel). Frequencies of Middle HSCs-derived and recipient HSCs and MPPs in the HSCs/MPPs fraction are shown (right panel). Data from each recipient mouse are shown in individual bars. (G) Chimerism of Middle HSC–derived hematopoietic cells in CD45+ (CD45.1+CD45.2) hematopoietic cells, myeloid, B, and T cells in PB of recipient mice (n = 4). The x axes indicate the numbers of HSCs that were contained in transplanted c-Kit+ cells (left panel). Frequencies of donor- (Middle HSCs) and recipient-derived myeloid, B, and T cells in PB (right panel). Data from each recipient mouse are shown in individual bars. (H) Chimerism of donor-derived hematopoietic cells in CD45+ (CD45.1+CD45.2) hematopoietic, myeloid, B, and T cells in PB of recipient mice receiving Young, Middle/Y, and Middle HSCs (n = 5). (I) Frequencies of myeloid, B, and T cells in donor-derived PB cells 6 mo after transplantation in H (n = 5). (J) Chimerism of donor-derived cells in BM HSCs and MPPs in recipient mice 6 mo after transplantation in H (n = 5). (K) CD150 expression in Aged/Y HSCs in recipient mice 2 mo after transplantation in D. Representative histograms showing CD150 expression in the HSC gate (left panel) and mean fluorescence intensity (MFI) of CD150 shown as mean ± SEM (n = 5) are depicted. *, P < 0.05; **, P < 0.01; ***, P < 0.001 by one-way ANOVA. Data are shown as the mean ± SEM. *, P < 0.05; **, P < 0.01; ***, P < 0.001; ns, not significant by a one-way ANOVA.
Figure S1.
Figure S1.
Long-term hematopoiesis by Aged HSCs engrafted in the unconditioned young niche. (A) Experimental strategy. c-Kit+ cells that contained 1.0 × 10⁴ HSCs from 10-wk-old mice and 20-mo-old mice were transplanted into 8-wk-old CD45.1 Young mice without irradiation (B–D). 4 mo after transplantation, 100 Young and Aged HSCs engrafted in Young recipient mice were purified and then transplanted into lethally irradiated 8-wk-old secondary recipient mice along with 2.5 × 10⁵ CD45.1+ BM competitor cells (F–H). (B) Chimerism of donor-derived hematopoietic cells in CD45+ (CD45.1+CD45.2) hematopoietic, myeloid, B, and T cells in PB of primary recipient mice receiving Young or Aged HSCs (n = 3–4). (C) Frequencies of myeloid, B, and T cells in donor-derived PB cells 2 and 4 mo after primary transplantation (n = 5). (D) Chimerism of donor-derived cells in BM HSCs and MPPs (CD45.1+CD45.2) in primary recipient mice 4 mo after transplantation (n = 3–4). (E) CD150 expression in Aged/Y HSCs and Young recipient HSCs in recipient mice 4 mo after primary transplantation (n = 4). (F) Chimerism of donor-derived hematopoietic cells in CD45+ (CD45.1+CD45.2) hematopoietic, myeloid, B, and T cells in PB of secondary recipient mice receiving Young/Y or Aged/Y HSCs (n = 3–4). (G) Frequencies of myeloid, B, and T cells in donor-derived PB cells 4 mo after secondary transplantation (n = 5). (H) Chimerism of donor-derived cells in BM HSCs and MPPs (CD45.1+CD45.2) in secondary recipient mice 4 mo after transplantation (n = 5). Data are shown as mean ± SEM. *, P < 0.05; **, P < 0.01; ***, P < 0.001; ns, not significant by one-way ANOVA.
Figure 3.
Figure 3.
The young niche largely rejuvenates the transcriptome profile of Aged HSCs. (A) Experimental strategy. 3,000 donor-derived Aged/Y and host Young HSCs purified from primary recipients at 2 mo after transplantation of Aged HSCs without irradiation, together with 3,000 HSCs from 20-mo-old mice, were subjected to RNA-sequencing analysis. (B) PC analysis based on the row Z scores of the expression value (DESeq2 normalized counts) in Young, Aged, and Aged/Y HSCs (n = 2 each, pooled from two independent experiments). (C) Hierarchical clustering based on the Pearson’s correlation coefficient of DESeq2 normalized counts in Young, Aged, and Aged/Y HSCs (n = 2). (D) MA plot showing log10 normalized read counts and log2 fold changes in Aged versus Young HSCs. The red and blue dots represent 629 up-regulated (UP) and 957 down-regulated (DOWN) DEGs during aging. The cutoff q < 0.05 was used to define DEGs. (E) K-means clustering of DEGs defined in D. Heatmap represents the Z scores of normalized read counts in Young, Aged, and Aged/Y HSCs. The cluster numbers (C1–C5) and average gene expression scores of each HSC group are indicated. (F) Reversible and irreversible changes in average gene expression in Aged/Y HSCs. The average expression scores of DEGs in Young or Aged HSCs were scaled from 0 to 1, and the scores of DEGs in Aged/Y HSCs were normalized.
Figure S2.
Figure S2.
The young niche largely rejuvenates the transcriptome profile of Aged HSCs (cohort 3). (A) MA plot showing log10 normalized read counts and log2 fold changes in Aged versus Young HSCs. The red and blue dots represent 252 up-regulated and 95 down-regulated DEGs during aging. The cutoff value q < 0.05 was used to define DEGs. (B) K-means clustering of DEGs defined in A. The heatmap represents the Z scores of normalized read counts in Young, Aged, and Aged/Y HSCs. The cluster numbers (C1′–C5′) and average gene expression scores of each HSC group are indicated. (C) Reversible and irreversible changes in average gene expression in Aged/Y HSCs. The average expression scores of DEGs in Young or Aged HSCs were scaled from 0 to 1, and the scores of DEGs in Aged/Y HSCs were normalized. (D) Expression changes of DEGs identified in cohorts 1 and 2 (C1 to C5 in Fig. 3) and cohort 3 (as in Fig. 3). Expression changes of DEGs in cohorts 1 and 2 are shown as controls.
Figure 4.
Figure 4.
Niche-dependent partial transcriptional rejuvenation of Aged HSCs. (A) GSEA plots with gene sets that are up-regulated (UP) or down-regulated (DOWN) in Aged HSCs (Wahlestedt et al., 2013). Normalized enrichment score (NES), nominal P value (NOM), and false discovery rate (FDR) are indicated. (B) GO analyses of biological processes and other indicated pathway analyses using DEGs in each cluster. The cutoff value P < 0.05 was used to indicate significant enrichment.
Figure 5.
Figure 5.
Age-related aberrant DNA methylation is resistant to niche rejuvenation. (A) Violin plots showing the global DNA methylation levels in Young, Aged, and Aged/Y HSCs at CGIs and enhancers. Mean and median values are indicated as red dots and horizontal bars, respectively. (B) Hierarchical clustering databased on the Pearson’s correlation coefficient of DNA methylation at CGIs and enhancers in Young, Aged, and Aged/Y HSCs. (C) Percentages of hyper- and hypo-DMRs at CGIs and enhancers in Aged and Aged/Y HSCs relative to the indicated HSCs. Among DMRs with significant differences in methylation levels from those in control HSCs (q< 0.05), those showing methylation difference ≥5.0% were defined as hyper- and hypo-DMRs. (D) Violin plots showing the DNA methylation difference (percentage) in DMRs between the test (Aged or Aged/Y HSCs) and control (Young HSCs). Mean and median values are indicated as red dots and horizontal bars, respectively. (E) Venn diagrams showing the overlap of hyper- and hypo-DMRs at CGIs and enhancers between Aged and Aged/Y HSCs. Hyper- and hypo-DMRs were defined in Aged and Aged/Y HSCs using Young HSCs as a control. (F) Violin plots showing expression changes in all genes (All) and genes with hyper-DMRs at CGIs and enhancers (Hyper) between the test (Aged and Aged/Y HSCs) and control (Young HSCs). Mean and median values are indicated as red dots and horizontal bars, respectively. Data are shown as mean ± SD. Data of second cohort are shown in Fig. S3. *, P < 0.05; ***, P < 0.001; ns, not significant by Student’s t test.
Figure S3.
Figure S3.
Comparison of DNA methylation among Young, Aged, and Aged/Y HSCs. (A) DNA methylation values in Young, Aged, and Aged/Y HSCs at CGIs and enhancers. The blue and red dots represent hyper-and hypo-DMRs as those showing significant differences in methylation levels (q < 0.05) and a methylation difference ≥5.0%. Gray dots and white circles represent DMRs with a methylation difference <5.0% and non-DMRs, respectively. (B) DNA methylation values of hyper-DMRs in Aged HSCs relative to Young HSCs in A (619 and 544 DMRs at CGIs and enhancers, respectively) in Aged and Aged/Y HSCs (upper panels). Violin plots showing expression levels of hyper-DMR genes in Aged HSCs that lost hyper-DMRs in Aged/Y HSCs (hypo-DMR genes in Aged/Y HSCs relative to Aged HSCs; lower panels). Mean and median values are indicated as red dots and horizontal bars, respectively. (C–H) GWBS analysis (second cohort). (C) Violin plots showing the global DNA methylation levels in Young, Aged, and Aged/Y HSCs at CGIs and enhancers. Mean and median values are indicated as red dots and horizontal bars, respectively. (D) Hierarchical clustering databased on the Pearson’s correlation coefficient of DNA methylation at CGIs and enhancers in Young, Aged, and Aged/Y HSCs. (E) Percentages of hyper- and hypo-DMRs at CGIs and enhancers in Aged and Aged/Y HSCs relative to indicated HSCs. Among DMRs with significant differences in methylation levels compared with control HSCs (q < 0.05), those showing a methylation difference ≥5.0% were defined as hyper- and hypo-DMRs. (F) Violin plots showing the DNA methylation difference (percentage) in DMRs between the test (Aged or Aged/Y HSCs) and control (Young HSCs). Mean and median values are indicated as red dots and horizontal bars, respectively. (G) Venn diagrams showing the overlap of hyper- and hypo-DMRs at CGIs and enhancers between Aged and Aged/Y HSCs. Hyper- and hypo-DMRs were defined in Aged and Aged/Y HSCs using Young HSCs as a control. (H) Violin plots showing expression changes in all genes (All) and genes with hyper-DMRs at CGIs and enhancers (Hyper) between the test (Aged and Aged/Y HSCs) and control (Young HSCs). Mean and median values are indicated as red dots and horizontal bars, respectively. Data are shown as mean ± SD. **, P < 0.01; ns, not significant by Student’s t test.

Similar articles

Cited by

References

    1. Abbuehl, J.P., Tatarova Z., Held W., and Huelsken J.. 2017. Long-term engraftment of primary bone marrow stromal cells repairs niche damage and improves hematopoietic stem cell transplantation. Cell Stem Cell. 21:241–255.e6. 10.1016/j.stem.2017.07.004 - DOI - PubMed
    1. Akunuru, S., and Geiger H.. 2016. Rejuvenation of hematopoietic stem cells. Trends Mol. Med. 22:701–712. 10.1016/j.molmed.2016.06.003 - DOI - PMC - PubMed
    1. Beerman, I., Bhattacharya D., Zandi S., Sigvardsson M., Weissman I.L., Bryder D., and Rossi D.J.. 2010. Functionally distinct hematopoietic stem cells modulate hematopoietic lineage potential during aging by a mechanism of clonal expansion. Proc. Natl. Acad. Sci. USA. 107:5465–5470. 10.1073/pnas.1000834107 - DOI - PMC - PubMed
    1. Beerman, I., Bock C., Garrison B.S., Smith Z.D., Gu H., Meissner A., and Rossi D.J.. 2013. Proliferation-dependent alterations of the DNA methylation landscape underlie hematopoietic stem cell aging. Cell Stem Cell. 12:413–425. 10.1016/j.stem.2013.01.017 - DOI - PubMed
    1. Bhattacharya, D., Rossi D.J., Bryder D., and Weissman I.L.. 2006. Purified hematopoietic stem cell engraftment of rare niches corrects severe lymphoid deficiencies without host conditioning. J. Exp. Med. 203:73–85. 10.1084/jem.20051714 - DOI - PMC - PubMed

Publication types