Case Reports
. 2021 Mar 1;218(3):e20201062.
doi: 10.1084/jem.20201062.

Inherited SLP76 deficiency in humans causes severe combined immunodeficiency, neutrophil and platelet defects

Affiliations
Case Reports

Inherited SLP76 deficiency in humans causes severe combined immunodeficiency, neutrophil and platelet defects

Atar Lev et al. J Exp Med. .

Abstract

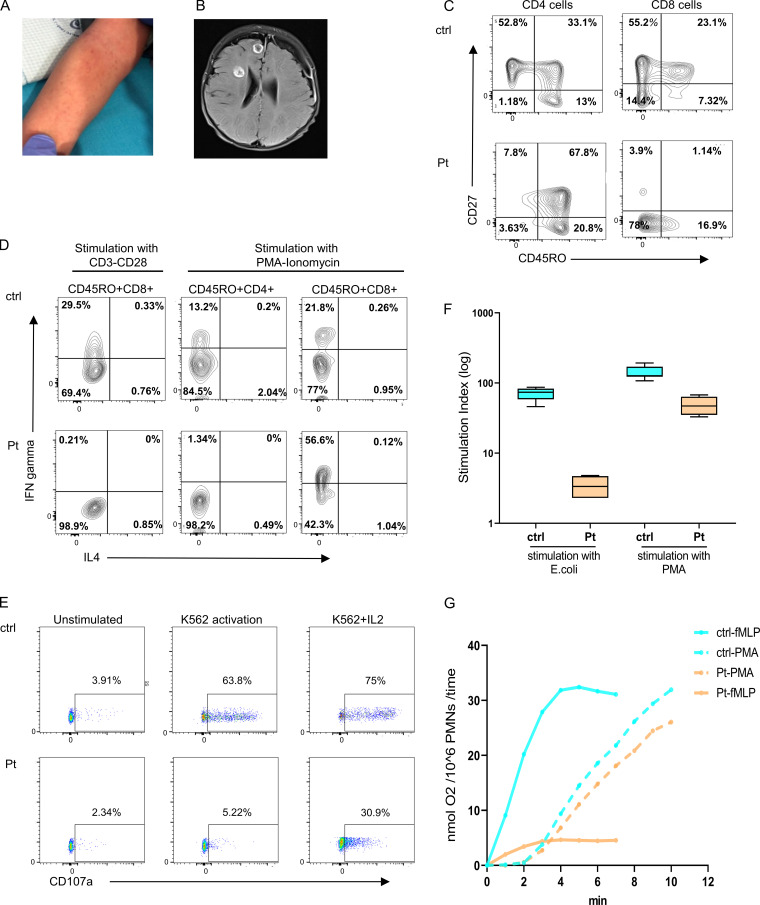
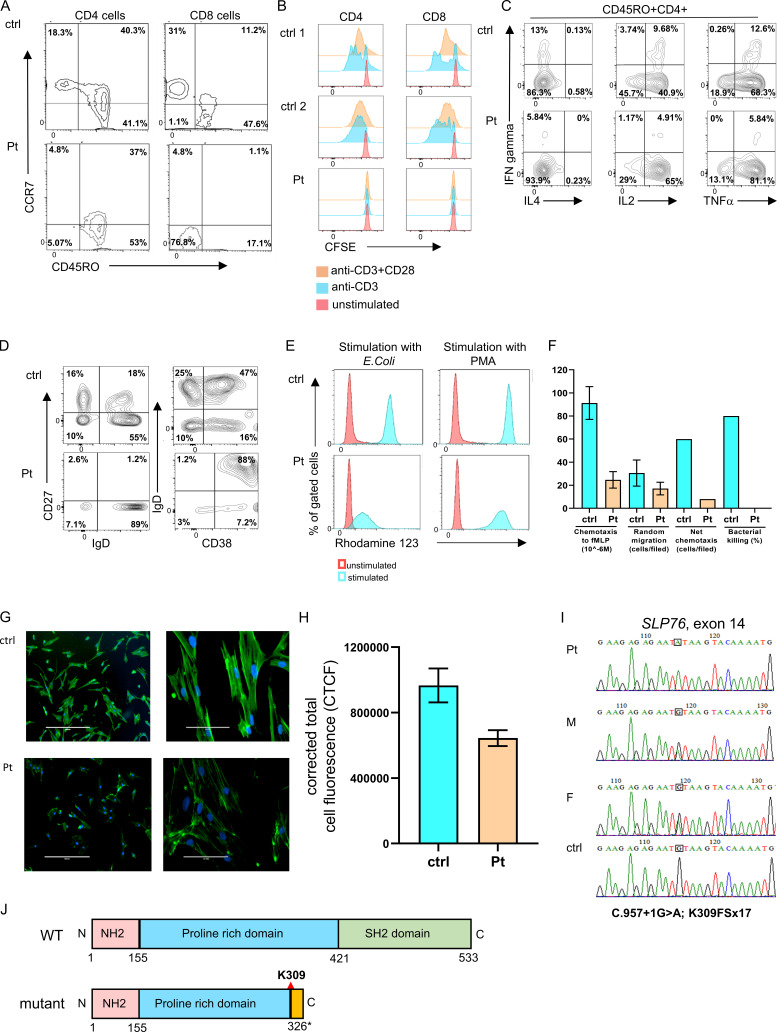
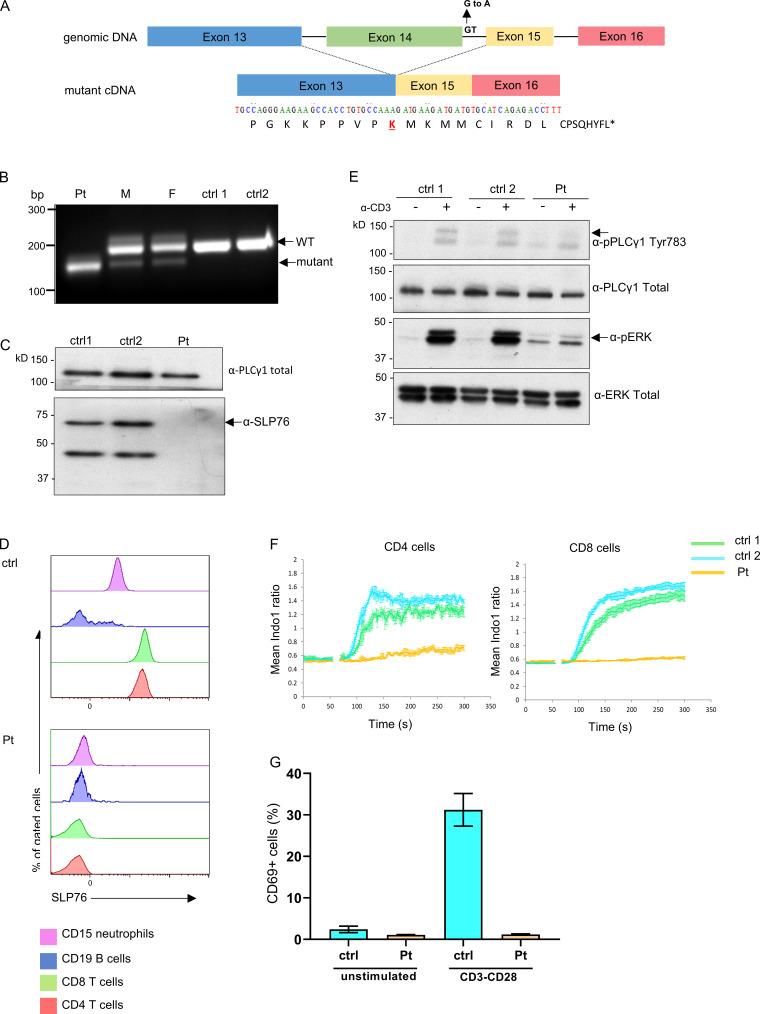
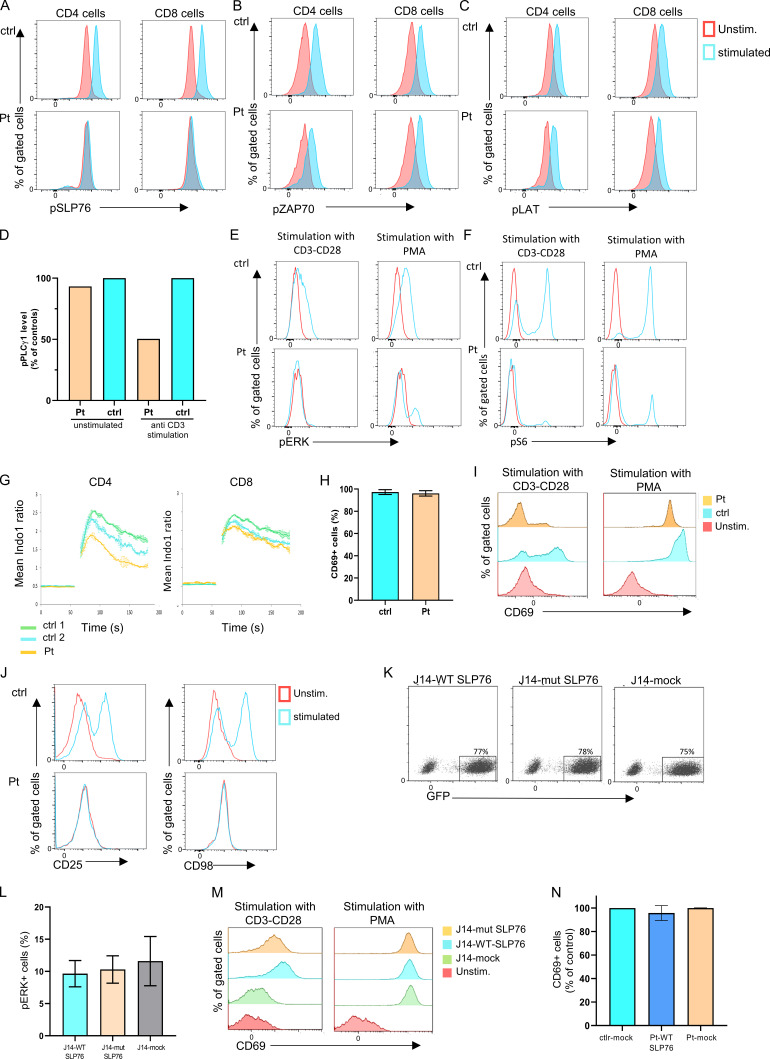
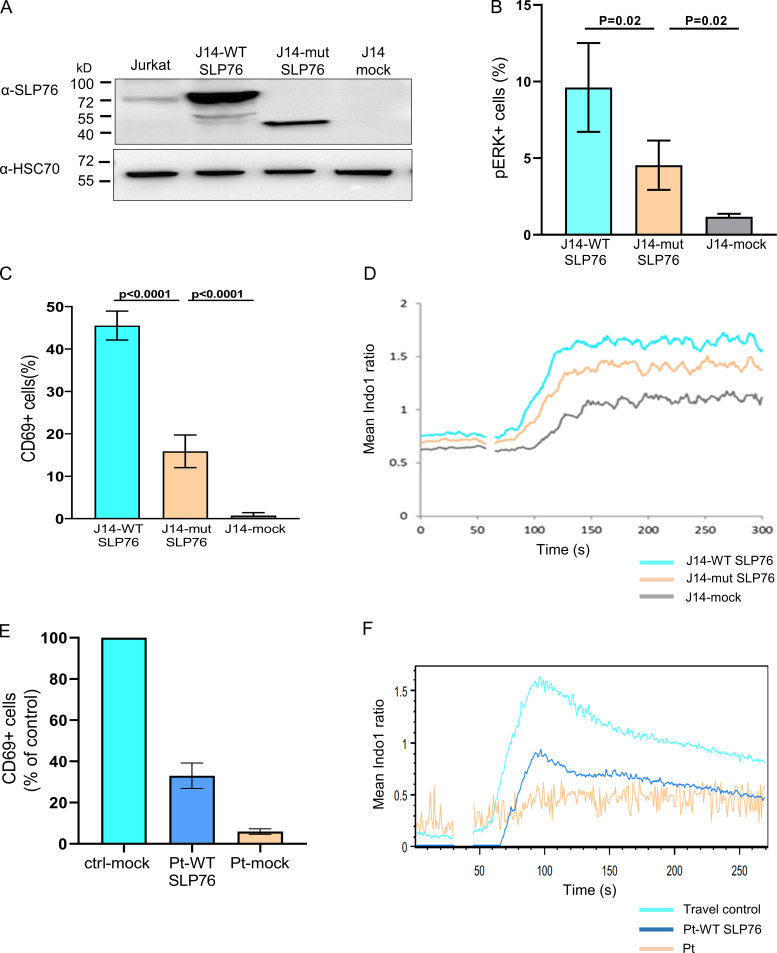
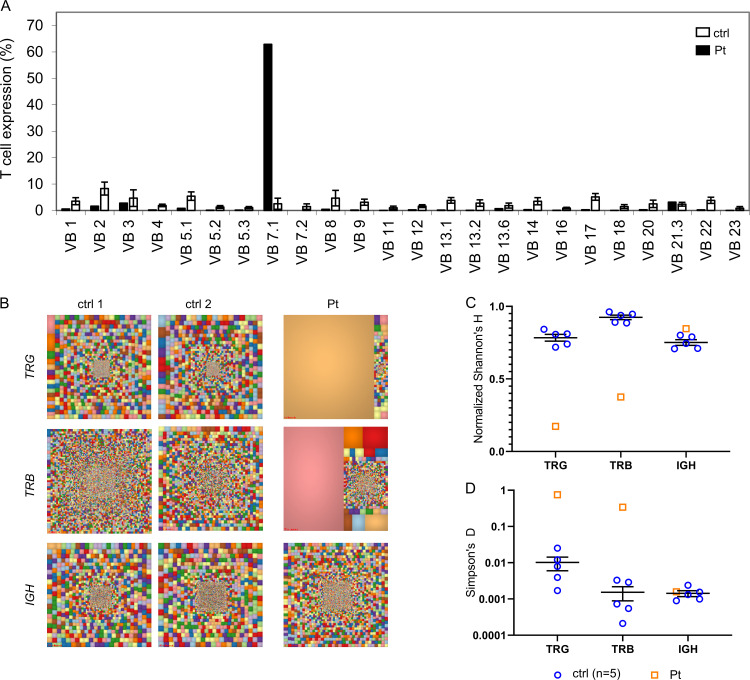
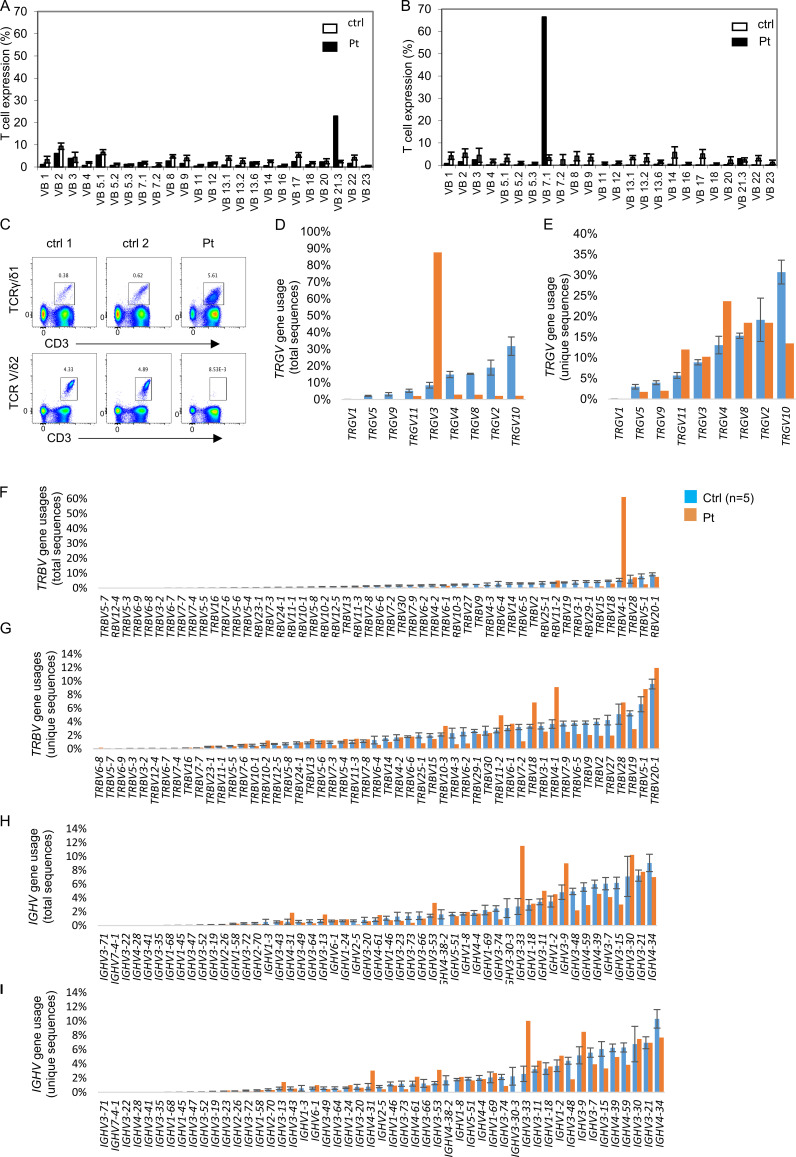
The T cell receptor (TCR) signaling pathway is an ensemble of numerous proteins that are crucial for an adequate immune response. Disruption of any protein involved in this pathway leads to severe immunodeficiency and unfavorable clinical outcomes. Here, we describe an infant with severe immunodeficiency who was found to have novel biallelic mutations in SLP76. SLP76 is a key protein involved in TCR signaling and in other hematopoietic pathways. Previous studies of this protein were performed using Jurkat-derived human leukemic T cell lines and SLP76-deficient mice. Our current study links this gene, for the first time, to a human immunodeficiency characterized by early-onset life-threatening infections, combined T and B cell immunodeficiency, severe neutrophil defects, and impaired platelet aggregation. Hereby, we characterized aspects of the patient's immune phenotype, modeled them with an SLP76-deficient Jurkat-derived T cell line, and rescued some consequences using ectopic expression of wild-type SLP76. Understanding human diseases due to SLP76 deficiency is helpful in explaining the mixed T cell and neutrophil defects, providing a guide for exploring human SLP76 biology.


Conflict of interest statement

Disclosures: The authors declare no competing interests exist.

Figures

Figure 1.
Figure 1.
Clinical and immunologic presentation of patient with SLP76 mutation. (A) Nonblanching, petechia-like, small lesions in the patient's forearm. (B) Brain magnetic resonance imaging revealed several round lesions with peripheral enhancement in temporal, frontal, and insular lobes with subdural collection in the peripheral part of the left frontal lobe. (C) Immunophenotyping of patient’s (Pt) CD4 and CD8 cells measured by flow cytometry. Left: The CD4 cells have a central memory phenotype (CD27+CD45RO+). Right: The CD8 cells have a TEMRA phenotype (CD27CD45RO) compared with age-matched healthy control (ctrl). The experiment was performed once. (D) PBMCs isolated from the patient and travel control were stimulated with either CD3 and CD28 overnight or with PMA and ionomycin for 5 h and stained for IFN-γ and IL-4. Shown are gated on CD45RO+CD4+ and CD45RO+CD8+ cells as measured via flow cytometry. This experiment was performed once. (E) NK cell degranulation in PBMCs from patients and age-matched healthy control was measured by the surface expression of CD107a without stimulation or after stimulation with K562 cells alone and with IL-2. One representative experiment out of two is shown. (F) Neutrophils oxidative burst, determined by flow cytometry analysis of dihydrorhodamine assay, in peripheral blood cells obtained from the patient and age-matched healthy control was measured after stimulation with E. coli bacteria or with PMA. Average data from four different experiments are shown. Statistical analysis was performed using unpaired one-tailed t tests. (G) Superoxide production in neutrophils from the patient and age-matched healthy control was measured as superoxide dismutase–inhibitable reduction of ferricytochrome c. (nmol O2/106PMNs/time) in response to stimulation with PMA or with fMLP. Dashed line indicates stimulation with PMA, and full line indicates stimulation with fMLP. One experiment with seven repeats.
Figure S1.
Figure S1.
Immune phenotype and genetic characterization of the SLP76-deficient patient. (A) Immunophenotyping of patient’s CD4 and CD8 cells measured by flow cytometry. The CD4 cells have a central memory phenotype (CCR7+CD45RO+; left), and the CD8 cells have a TEMRA phenotype (CCR7CD45RO; right) compared with age-matched healthy control (ctrl). The experiment was performed once. (B) T cell proliferation: T cell proliferation using CFSE fluorescence cell incorporation assay 4 d after stimulation with anti-CD3 or anti-CD3/CD28. These data show reduced proliferation in the patient CD4 and CD8 cells compared with the two healthy controls. The experiment was performed once. (C) Flow cytometric analysis of cytokine response: Expanded T cells lymphoblasts were stimulated with plate-bound OKT3 (10 μg/ml) and soluble CD28 (2 μg/ml) for 12 h., then 20 ng/ml PMA and 1 μmol/liter ionomycin in the presence of brefeldin A for 5 h. IFN-γ, IL-4, IL-2, and TNFα production among CD45RO+CD4+ cells was assessed via flow cytometry. One representative experiment out of two is shown. (D) Peripheral B cell immunophenotyping:B cell immunophenotyping measured by flow cytometry revealed decreased frequencies of naive (CD27IgD+) and class-switched (CD27+IgD) B cells, along with elevated immature B cells (CD38+IgD+) in the patient pheripheral blood lymphocytes compared with control. One representative experiment out of two is shown. (E) Neutrophils oxidative burst: Dihydrorhodamine assay was performed in peripheral blood from the patient and age-matched healthy controls after stimulation with E. coli bacteria or PMA using flow cytometry. One representative experiment out of four is presented. (F) Neutrophils function: Neutrophil chemotaxis, random migration, net chemotaxis, and bacterial killing were markedly reduced in the patient’s neutrophils compared with age-matched healthy controls. For the chemotaxis and random migration experiments, each bar represents the average of two experiments, and for the net chemotaxis and bacterial killing assays, the bars represent data from one experiment. Statistical analyses were performed using unpaired one-tailed t test. (G) Fluorescence studies of actin polymerization: The actin polymerization in fibroblasts from the patient and control was determined using phalloidin staining. Fluorescent microscopy images of FITC phalloidin staining demonstrate clear fluorescence attenuation in the patient’s cells compared with control. Phalloidin stains green and the nuclei (DAPI) stain blue. Images of ×10 magnification (left) and ×40 magnification (right) are shown. One representative experiment out of three is shown. (H) Quantification of the corrected total cell fluorescence (CTCF) in the patient and control fibroblasts using ImageJ software. Results are the average of three replicates, with error bars indicating the SD. (I) Genetic analysis of SLP76 mutation: Sanger sequencing confirmed the presence of a donor splice site mutation in the patient, which fully segregated with the parents (M, mother; F, father). The mutated nucleotide is boxed. A normal sequence of a healthy control is also presented. (J) SLP76 domains: Schematic representation of WT and mutant SLP76 protein domains. The splicing mutation causes a putative frame shift following lysine 309 (K309) in the central proline-rich domain (blue) and a premature stop codon 17 amino acids downstream of the mutation (yellow). This results in a deletion of the C-terminal SH2 domain (green).
Figure 2.
Figure 2.
Genetic, cellular, and functional characterization of SLP76 mutation. (A) Top: Schematic presentation of genomic DNA of SLP76 where the splice site mutation at the beginning of intron 14 is shown. Bottom: The mutated form of the cDNA is presented, where the skipping of exon 14 results in a putative frame shift after lysine (K) 309 of SLP76 (marked in red). The putative 17 amino acids and premature termination codon (asterisk) of the shifted sequence are shown. (B) PCR was performed on cDNA obtained from the patient, his parents, and two healthy controls (ctrl) using primers from exons 13 and 16 of SLP76. A single smaller fragment (190 bp), which suggests an exon skipping due to the splice mutation, is seen in the patient’s cells compared with a single higher band (221 bp) in the anticipated length in the healthy controls. The mother (M) and father (F) show both bands, as can be expected with the two being heterozygote carriers to the mutation. One representative gel out of three is shown. (C) Western blot analysis of SLP76 expression in expanded T cell lymphoblasts from the patient and two age-matched healthy controls. Total PLC-γ1 expression serves as a control for protein loading. One representative blot out of three is shown. (D) Flow-cytometric analysis determines the expression of SLP76 in T cells (CD4 and CD8), B cells (CD20), and neutrophils (CD15) from healthy control (top) and the patient (bottom). One representative experiment out of three is shown. (E) Western blot analysis of phosphorylated PLC-γ1 and phosphorylated ERK1/2 with (+) or without (−) stimulation with anti-CD3 in expanded T cell lymphoblasts from the patient and two age-matched healthy controls. Total PLC-γ1 and total ERK1/2 were used as a loading control for the patient and two age-matched healthy controls, respectively. One representative blot out of two is shown. (F) Expanded T cell lymphoblasts from the patient and two age-matched healthy controls were barcoded, mixed together, loaded with indo-1-AM, and stained for CD4 and CD8. Intracellular Ca2+ concentration was measured using flow cytometry at 37°C, with cross-linked anti-CD3 added at the 60-s time point. Mean ratiometric Ca2+ measurements are presented separately for the CD4+ (left) and CD8+ (right) populations. Results are the average of three replicates, with error bars indicating the SD. One representative experiment out of two is shown. (G) PBMCs from the patient and healthy age-matched controls were either stimulated with anti-CD3/CD28 or left unstimulated. CD69 expression was measured using flow cytometry and the results of three different analyses are summarized in the graph. Statistical analysis was performed using unpaired one-tailed t tests.
Figure S2.
Figure S2.
The biologic effect on the TCR signaling due to the SLP76 mutation. (A-C) TCR-induced signaling in SLP76 mutated cells: Flow cytometry analyses of intracellular levels of phosphorylated SLP76 (A), phosphorylated ZAP-70 (B), and phosphorylated LAT (C) in unstimulated and stimulated peripheral CD4 and CD8 T cells from the patient and control are shown. No phosphorylation of SLP76 was detected in the patient's cells, and the phosphorylation of ZAP-70 and LAT was normal compared with control. One representative experiment out of two is shown. (D) Quantification of the level of phospho-PLC-γ1. The level of phospho-PLC-γ1 in the patient and control cells as presented in the Western blot (Fig. 2 E) was quantified by densitometry analysis using ImageJ software. The level of phospho-PLC-γ1 in the patient cells with or without anti-CD3 stimulation was calculated as the percentage from control. The bars for the control are the average of two controls (ctrl 1 and ctrl 2), and it is set to 100%. Reduction in the patient’s phospho-PLC-γ1 level was detected. (E and F) TCR signaling in SLP76-mutated T cells: Phosphorylation of pERK1/2 (E) and pS6 (F) in patient and control T cells, either without stimulation or after stimulation with anti-CD3/CD28 or with PMA, was measured using flow cytometry. Stimulation with anti-CD3/CD28 did not lead to phosphorylation in pERK1/2 and pS6 in the patient’s cells, while PMA stimulation led to a modestly improved response comparable to control. One representative experiment out of two is shown. (G) Ca2+ mobilization: Expanded T cell lymphoblasts from the patient and age-matched healthy controls were loaded with indo-1-AM. Ca2+ concentration was measured following stimulation with ionomycin. Ca2+ mobilization was determined in CD4 and CD8 T cells. Results are the average of two replicates, with error bars indicating the SD. One representative experiment out of two is shown. (H-J) Expression of surface activation markers. (H) PBMCs from the patient and age-matched healthy controls were stimulated with PMA. CD69 expression was measured using flow cytometry and the results of three different analyses are summarized in the graph (P value = NS). Statistical analysis was performed using unpaired one-tailed t tests. (I) The actual flow cytometry results of CD69 expression in unstimulated and stimulated PBMCs from the patient and control are presented. One representative experiment out of four is presented. (J) Flow cytometric expression of CD25 and CD98 in unstimulated and stimulated T cells from the patient and age-matched control reveals lack of upregulation of these markers in the patient cells compared with control. One representative experiment out of two is shown. (K) Flow cytometric analysis showing equal amounts of GFP+ cells in J14-transduced experiments. J14 cells were transduced with an IRES-GFP-tagged retroviral vector encoding FLAG-tagged WT or mutant SLP76, or with the mock vector. All showed similar levels of transduction rate determined by GFP+ cells. (L and M) Correction of the SLP76 mutant phenotype in J14. (L) SLP76-deficient Jurkat-derived human leukemic T cell line (J14) retrovirally transduced with the WT or mutant form of SLP76, or with the empty mock vector. Phosphorylation of ERK1/2 was measured using flow cytometry after PMA stimulation. The stimulation with PMA, which bypasses SLP76 signaling, causes a normal response in all cells (P value = NS). The results of three different analyses are summarized in the graph. Statistical analysis was performed using unpaired one-tailed t tests. (M) Flow cytometry measurements of CD69 expression in unstimulated and stimulated J14 cells retrovirally transduced with empty vector, WT, or the mutant form of SLP76. One representative experiment out of four is presented. (N) Correction of the SLP76 mutant phenotype in expanded T cell lymphoblasts. Expanded T cell lymphoblasts from the patient were retrovirally transduced with either WT SLP76 or empty mock vector tagged with GFP. Expanded T cells from age-matched healthy controls were retrovirally transduced only with empty mock vector tagged with GFP. These cells were stimulated with PMA, and the CD69 expression was measured on GFP+ cells using flow cytometry. For the control, the bar represents the average of two experiments, and for the patient, the bars represent data from two experiments, which include four independent samples. Stimulation with PMA revealed normal CD69 expression in all the expanded cells.
Figure 3.
Figure 3.
Modeling and correction of the SLP76 mutant phenotype. SLP76-deficient Jurkat-derived human leukemic T cell line (J14) retrovirally transduced with the WT or mutant form of SLP76 or with the empty mock vector. (A) Western blot analysis to determine SLP76 expression. The truncated SLP76 is expected to be 37 kD. The expression of SLP76 in the common Jurkat cell line serves as a reference control, and HSC70 was used as a loading control. One representative blot out of three is shown. (B) Phosphorylated ERK1/2 was measured using flow cytometry in either anti-TCR (C305) stimulated cells or unstimulated cells. The analysis was done only on transduced cells by gating on GFP+ cells. The results of three different analyses are summarized in the graph. Statistical analysis was performed using unpaired one-tailed t tests. (C) CD69 expression was measured using flow cytometry in either anti-TCR (C305) stimulated cells or unstimulated cells. The analysis was done only on transduced cells by gating on GFP+ cells. The results of four different analyses are summarized in the graph. Statistical analysis was performed using unpaired one-tailed t tests. (D) Reconstituted J14 cells were barcoded, mixed together, and loaded with indo-1-AM. Shown is the mean ratiometric Ca2+ measurement, with anti-TCR (C305) added at the 60-s time point. Results are the average of three replicates. One representative experiment out of two is shown. (E) Expanded T cell lymphoblasts from the patient were retrovirally transduced with either WT SLP76 or empty mock vector tagged with GFP. Expanded T cell lymphoblasts from two-age matched healthy controls were retrovirally transduced with empty mock vector tagged with GFP. Both cells from the patient and controls were either stimulated with anti-CD3/CD28 or left unstimulated, and CD69 expression was measured on GFP+ cells using flow cytometry. The result of CD69 expression in the patient’s cells that were reconstituted with WT SLP76 is shown as a percentage from healthy control (ctrl-mock), where the healthy control is set for 100%. For the control, each bar represents the average of three experiments, and for the patient, the bars represent data from two experiments, which include four independent samples. Statistical analyses were performed using unpaired one-tailed t test. (F) WT SLP76–transfected patient T cells, patient T cells, and travel control T cells were loaded with indo-1-AM. Ca2+ influx in response to anti-CD3 stimulation was determined by the ratio of the fluorescent signals at 405 nm (Ca2+-bound dye) to 485 nm (Ca2+-free dye) over time via flow cytometry. The experiment was performed once.
Figure 4.
Figure 4.
Immune repertoire determined by next-generation sequencing for the SLP76-mutated patient. (A) Flow cytometry analysis of surface membrane expression of 24 different TRB variable gene families in the patient’s CD3 cells (black bars) compared with healthy controls (ctrl; white bars, n = 85, provided by the kit). One representative result out of two is shown. (B) Treemap representation of TRG, TRB, and B cell receptor (IGH) repertoire in PBMCs from the patient and two age-matched healthy controls. Each square represents a unique V to J joining, and the size of the square represents relative frequency within that sample. Two representative controls out of four are shown. (C and D) Quantification of the diversity and unevenness of the TRG, TRB, and IGH repertoire using the Shannon’s H index of diversity (C) and the Simpson’s D index of unevenness (D) in five healthy controls and in the SLP76-mutated patient.
Figure S3.
Figure S3.
T and B cell receptor repertoire in the SLP76-deficient patient. (A and B) Flow cytometry analysis of TCRVβ repertoire: Flow cytometry analysis of surface membrane expression of 24 different TRB variable gene families in the patient’s CD4 cells (A) or CD8 cells (B; black bars) compared with healthy control (white bars, n = 85, provided by the kit). The nomenclature of the TCR V genes is based on Wei et al. (1994). (C) Analysis of γδ T cells: Flow cytometry analysis of CD3+TCRγδ1+ and CD3+TCRVδ2+ cells. Analysis of the γδ T cells showed a marked skewing toward VD-1 and away from VD-2. Results are expressed as the percentage of positive cells. (DI) Differential V gene uses in TRG, TRB, and IGH repertoires. Percentage of different V gene usages for the TRG (D and E), TRB (F and G), and IGH (H and I) repertoires is demonstrated in unique and total sequences. For the patient, each bar represents the percentage of specific gene use based on either total (D, F, and H) or unique (E, G, and I) sequences. For the control, the bar represents the average of gene uses (n = 5), and error bars represent the SE. The nomenclature of the V genes is based on IMGT (Lefranc et al., 1999).

Similar articles

Cited by

References

    1. Amariglio, N., Lev A., Simon A., Rosenthal E., Spirer Z., Efrati O., Broides A., Rechavi G., and Somech R.. 2010. Molecular assessment of thymus capabilities in the evaluation of T-cell immunodeficiency. Pediatr. Res. 67:211–216. 10.1203/PDR.0b013e3181c6e554 - DOI - PubMed
    1. Bacchelli, C., Moretti F.A., Carmo M., Adams S., Stanescu H.C., Pearce K., Madkaikar M., Gilmour K.C., Nicholas A.K., Woods C.G., et al. . 2017. Mutations in linker for activation of T cells (LAT) lead to a novel form of severe combined immunodeficiency. J. Allergy Clin. Immunol. 139:634–642.e5. 10.1016/j.jaci.2016.05.036 - DOI - PubMed
    1. Balagopalan, L., Kortum R.L., Coussens N.P., Barr V.A., and Samelson L.E.. 2015. The linker for activation of T cells (LAT) signaling hub: from signaling complexes to microclusters. J. Biol. Chem. 290:26422–26429. 10.1074/jbc.R115.665869 - DOI - PMC - PubMed
    1. Bogin, Y., Ainey C., Beach D., and Yablonski D.. 2007. SLP-76 mediates and maintains activation of the Tec family kinase ITK via the T cell antigen receptor-induced association between SLP-76 and ITK. Proc. Natl. Acad. Sci. USA. 104:6638–6643. 10.1073/pnas.0609771104 - DOI - PMC - PubMed
    1. Bryceson, Y.T., Pende D., Maul-Pavicic A., Gilmour K.C., Ufheil H., Vraetz T., Chiang S.C., Marcenaro S., Meazza R., Bondzio I., et al. . 2012. A prospective evaluation of degranulation assays in the rapid diagnosis of familial hemophagocytic syndromes. Blood. 119:2754–2763. 10.1182/blood-2011-08-374199 - DOI - PubMed

Publication types

MeSH terms

Substances