

RasV12 Expression in Microglia Initiates Retinal Inflammation and Induces Photoreceptor Degeneration
- PMID: 33231622
- PMCID: PMC7691791
- DOI: 10.1167/iovs.61.13.34
RasV12 Expression in Microglia Initiates Retinal Inflammation and Induces Photoreceptor Degeneration
Abstract
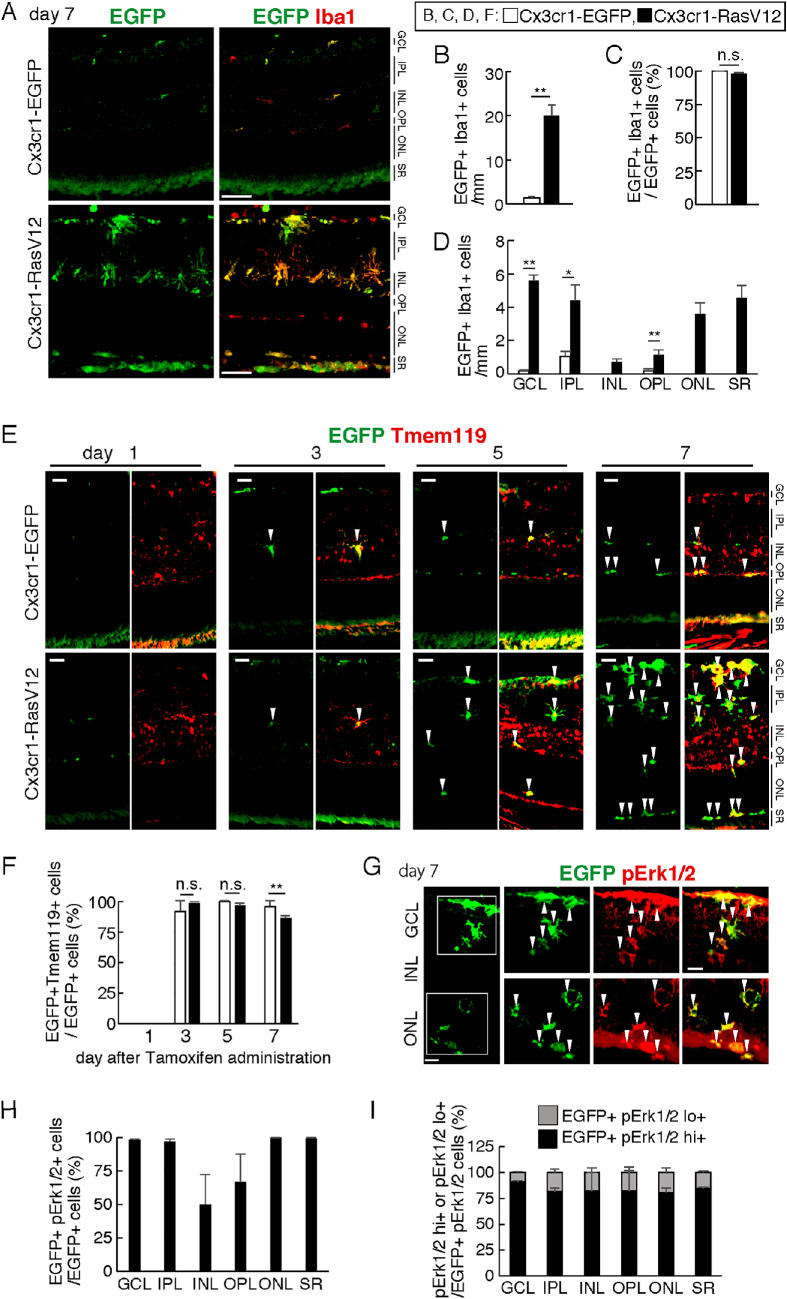
Purpose: The role of activated retinal microglia in driving retinal degeneration has been implicated in a number of in vivo disease models. Here, we investigated the primary consequences of microglial activation by the specific expression of constitutively active Ras in microglia in a transgenic mouse model before the onset of any degenerative changes in the retina.
Methods: The double transgenic lines CAG-LSL-RasV12-IRES-EGFP; Cx3cr1CreER/+ (Cx3cr1-RasV12 mice) and CAG-LSL-EGFP; Cx3cr1CreER_+ (control mice) were generated. The expression of RasV12 was induced in microglia by tamoxifen administration, and the retinas were examined by immunohistochemistry of frozen sections, RT-qPCR, and live imaging.
Results: RasV12 expression in retinal microglial cells promoted cell proliferation, cytokine expression, and phagocytosis. RasV12-expressing microglia migrated toward the inner and outer layers of the retina. Examination of glial fibrillary acidic protein (GFAP) expression revealed activation of Müller glia in the retina. We also observed loss of the photoreceptors in the outer nuclear layer in close proximity to microglial cells. However, no significant neurodegeneration was detected in the inner nuclear layer (INL) or ganglion cell layer (GCL). The morphology of RasV12-expressing microglia in the GCL and INL retained more ramified features compared with the predominantly-ameboid morphology found in outer retinal microglia.
Conclusions: The expression of RasV12 is sufficient to activate microglia and lead to photoreceptor degeneration. Neurons in the inner side of the retina were not damaged by the RasV12-activated microglia, suggesting that microenvironment cues may modulate the microglial phenotypic features and effects of microglial activation.
Conflict of interest statement
Disclosure:
Figures


Similar articles
-
Targeting translocator protein (18 kDa) (TSPO) dampens pro-inflammatory microglia reactivity in the retina and protects from degeneration.J Neuroinflammation. 2015 Nov 2;12:201. doi: 10.1186/s12974-015-0422-5. J Neuroinflammation. 2015. PMID: 26527153 Free PMC article.
-
Identification of sequential events and factors associated with microglial activation, migration, and cytotoxicity in retinal degeneration in rd mice.Invest Ophthalmol Vis Sci. 2005 Aug;46(8):2992-9. doi: 10.1167/iovs.05-0118. Invest Ophthalmol Vis Sci. 2005. PMID: 16043876
-
Deletion of Socs3 in LysM+ cells and Cx3cr1 resulted in age-dependent development of retinal microgliopathy.Mol Neurodegener. 2021 Feb 18;16(1):9. doi: 10.1186/s13024-021-00432-9. Mol Neurodegener. 2021. PMID: 33602265 Free PMC article.
-
Expression pattern of Ccr2 and Cx3cr1 in inherited retinal degeneration.J Neuroinflammation. 2015 Oct 12;12:188. doi: 10.1186/s12974-015-0408-3. J Neuroinflammation. 2015. PMID: 26458944 Free PMC article.
-
Progress in Assessing Retinal Microglia Using Single-Cell RNA Sequencing.Adv Exp Med Biol. 2025;1468:143-147. doi: 10.1007/978-3-031-76550-6_24. Adv Exp Med Biol. 2025. PMID: 39930187 Review.
Cited by
-
ALKBH5-Mediated m6A Modification of A20 Regulates Microglia Polarization in Diabetic Retinopathy.Front Immunol. 2022 Mar 1;13:813979. doi: 10.3389/fimmu.2022.813979. eCollection 2022. Front Immunol. 2022. PMID: 35300330 Free PMC article.
-
Apigenin Alleviates Autoimmune Uveitis by Inhibiting Microglia M1 Pro-Inflammatory Polarization.Invest Ophthalmol Vis Sci. 2023 May 1;64(5):21. doi: 10.1167/iovs.64.5.21. Invest Ophthalmol Vis Sci. 2023. PMID: 37219511 Free PMC article.
-
Evaluation of CRISPR/Cas9 exon-skipping vector for choroideremia using human induced pluripotent stem cell-derived RPE.J Gene Med. 2023 Feb;25(2):e3464. doi: 10.1002/jgm.3464. Epub 2022 Dec 4. J Gene Med. 2023. PMID: 36413603 Free PMC article.
-
Fetal-Derived Immune Cells at the Roots of Lifelong Pathophysiology.Front Cell Dev Biol. 2021 Feb 23;9:648313. doi: 10.3389/fcell.2021.648313. eCollection 2021. Front Cell Dev Biol. 2021. PMID: 33708774 Free PMC article. Review.
-
CX3CL1/CX3CR1 Signaling Mediated Neuroglia Activation Is Implicated in the Retinal Degeneration: A Potential Therapeutic Target to Prevent Photoreceptor Death.Invest Ophthalmol Vis Sci. 2024 Jan 2;65(1):29. doi: 10.1167/iovs.65.1.29. Invest Ophthalmol Vis Sci. 2024. PMID: 38231527 Free PMC article.
References
-
- Salter MW, Stevens B.. Microglia emerge as central players in brain disease. Nat Med. 2017; 23(9): 1018–1027. - PubMed
-
- Silverman SM, Wong WT.. Microglia in the retina: roles in development, maturity, and disease. Annu Rev Vis Sci. 2018; 4(1): 45–77. - PubMed
-
- Santos AM, Martín-Oliva D, Ferrer-Martín RM, et al. .. Microglial response to light-induced photoreceptor degeneration in the mouse retina. J Comp Neurol. 2010; 518(4): 477–492. - PubMed
-
- Ng TF, Streilein JW.. Light-induced migration of retinal microglia into the subretinal space. Investig Ophthalmol Vis Sci. 2001; 42(13): 3301–3310. - PubMed
MeSH terms
Substances
LinkOut - more resources
Full Text Sources
Miscellaneous
