

Trends in Representation of Female Applicants and Matriculants in Canadian Residency Programs Across Specialties, 1995 to 2019
- PMID: 33231640
- PMCID: PMC7686870
- DOI: 10.1001/jamanetworkopen.2020.27938
Trends in Representation of Female Applicants and Matriculants in Canadian Residency Programs Across Specialties, 1995 to 2019
Abstract
Importance: Disparities in representation between sexes have been shown at multiple career stages in medicine despite increasing representation in the overall physician workforce.
Objective: To assess sex representation of applicants to the Canadian R-1 entry match for postgraduate training programs from 1995 to 2019, comparing distribution between different specialties as well as applied vs matched applicants.
Design, setting, and participants: This cross-sectional analysis of aggregate data provided by the Canadian Resident Matching Service between 1995 and 2019 analyzed aggregate data for the Canadian R-1 residency match from 1995 through 2019.
Exposures: Applicant sex as reported in the Canadian Resident Matching Service database.
Main outcomes and measures: The sex representation of applicants was compared and the longitudinal trends in sex representation were analyzed by specialty between 1995 and 2019. The sex representation of overall applicants to the Canadian R-1 entry match were compared with matched applicants, and both were stratified by specialty.
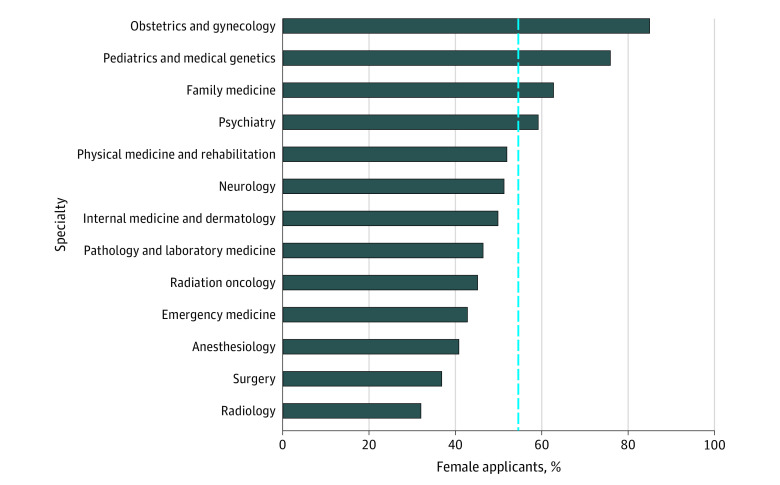
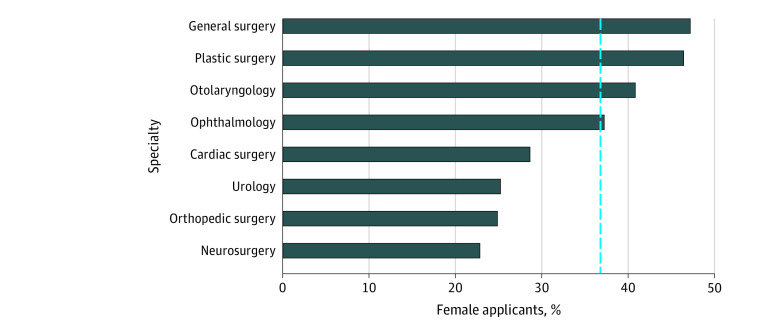
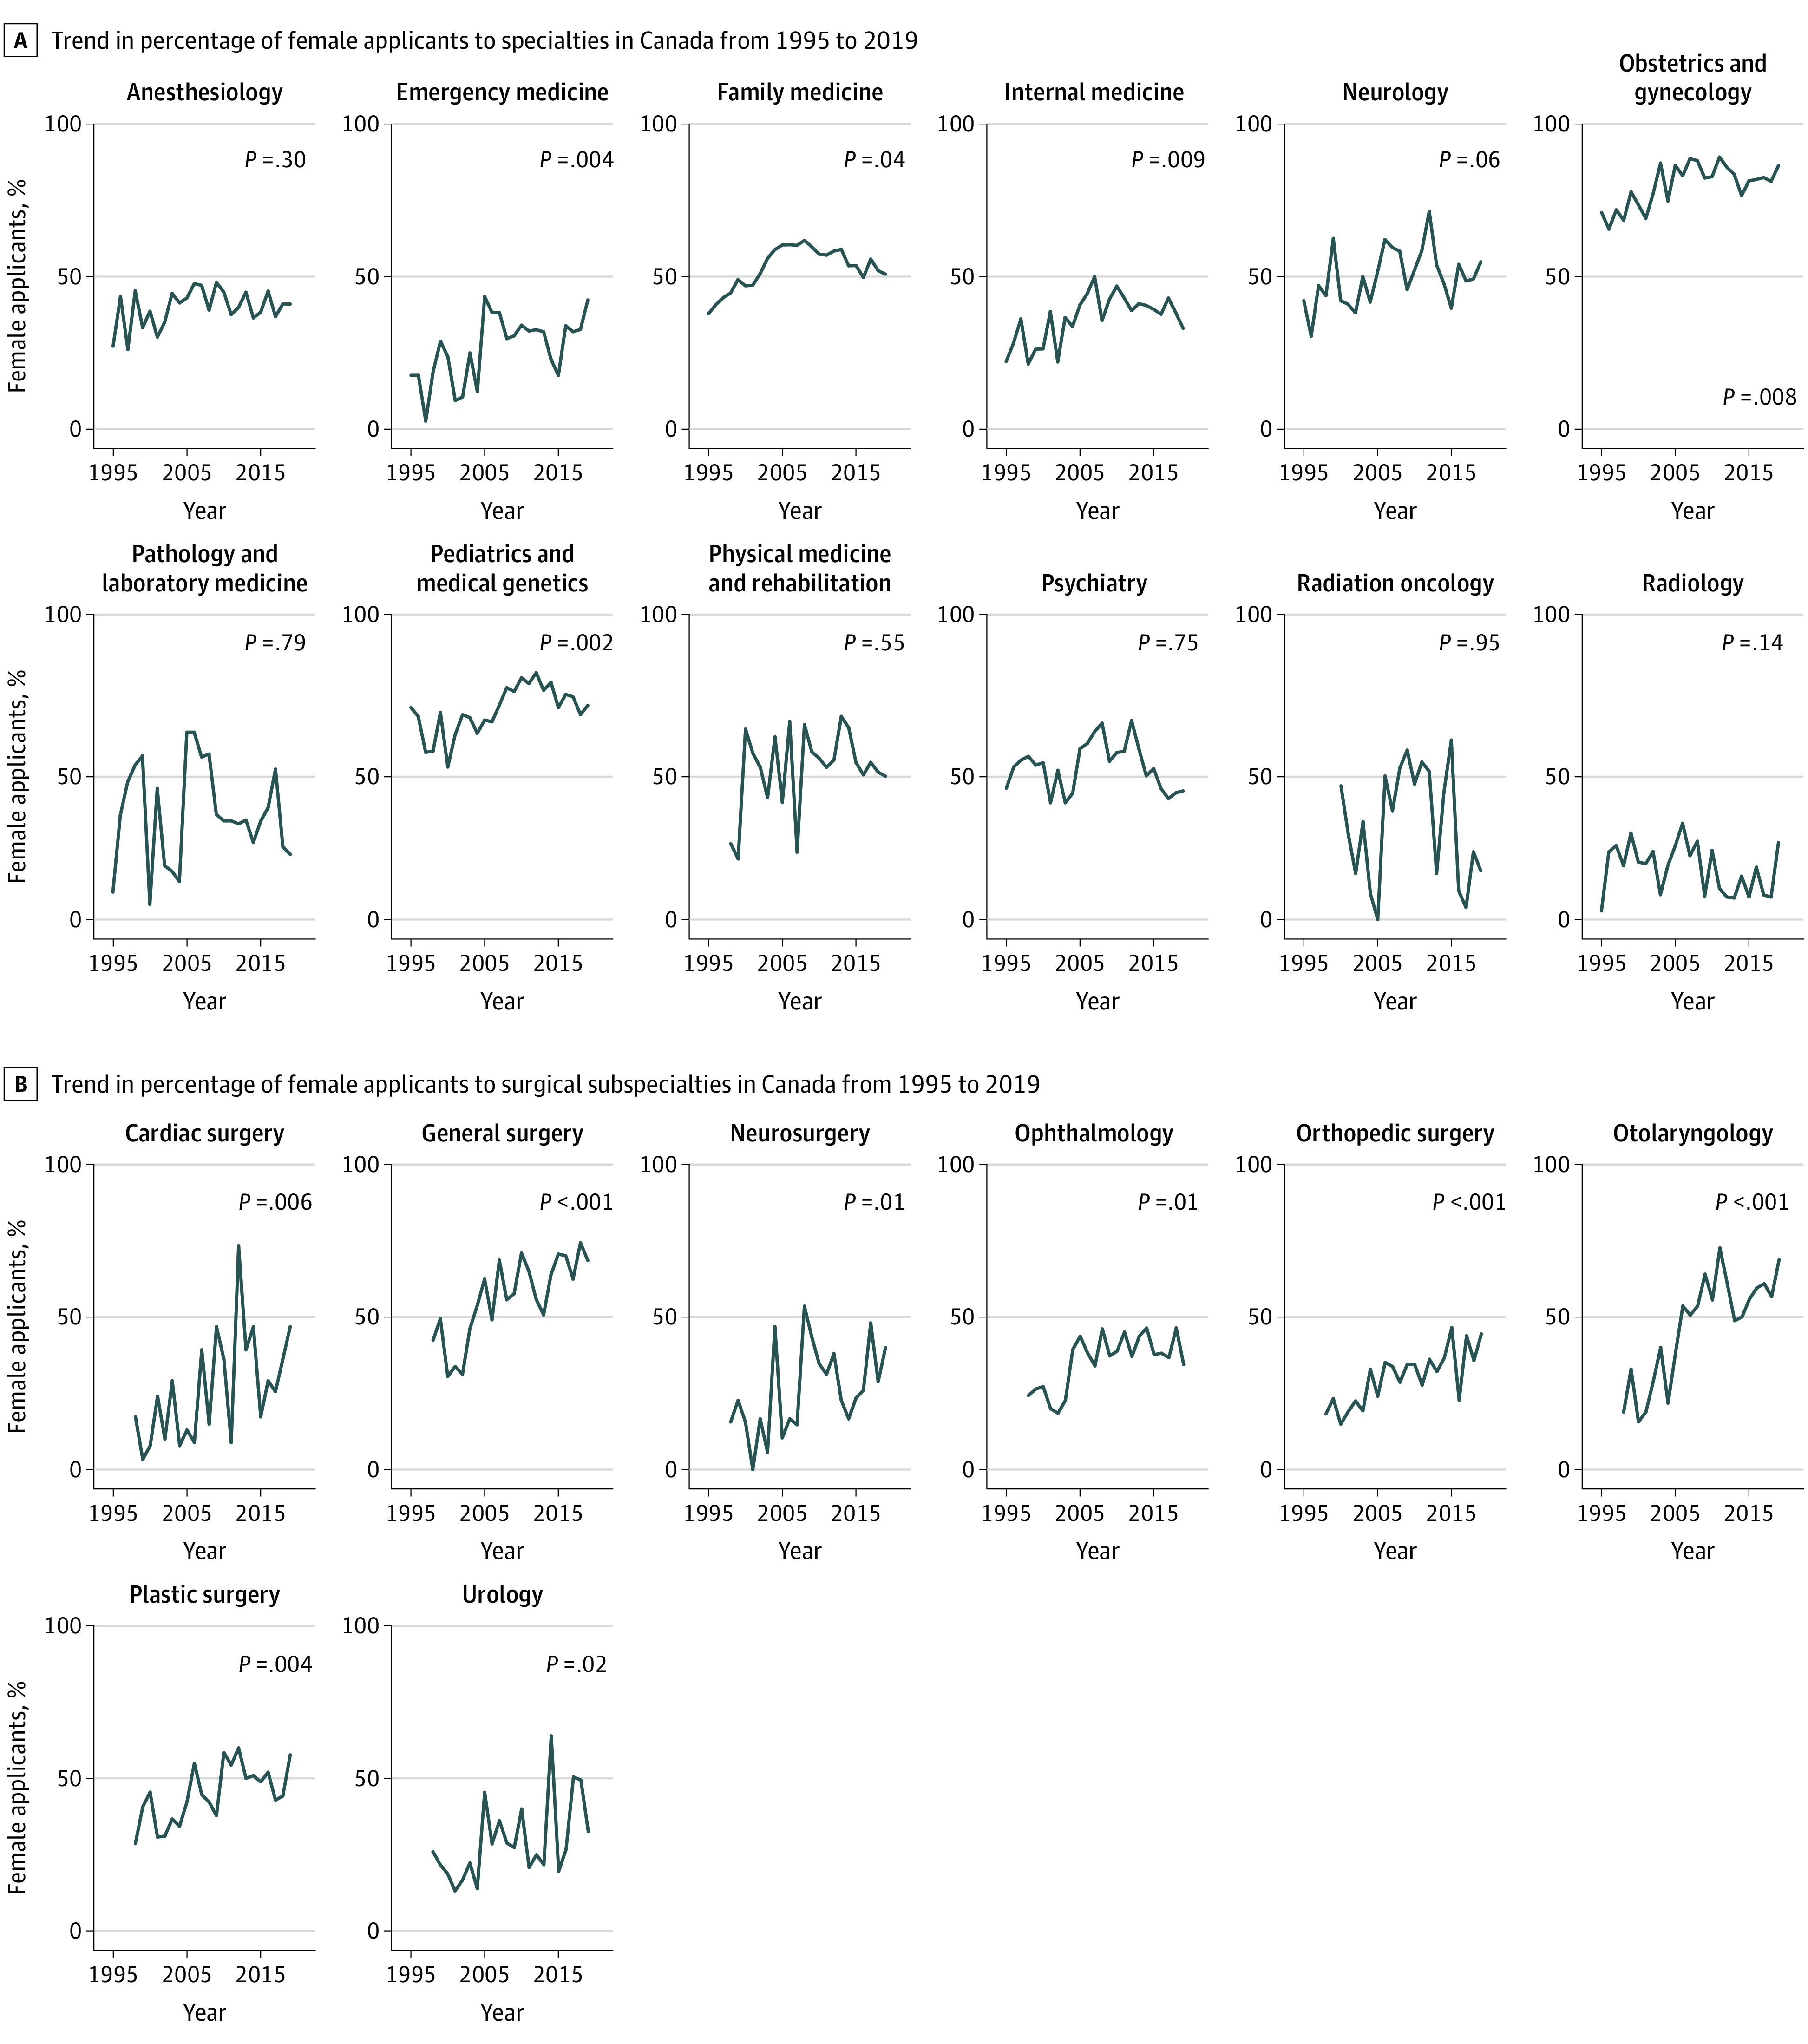
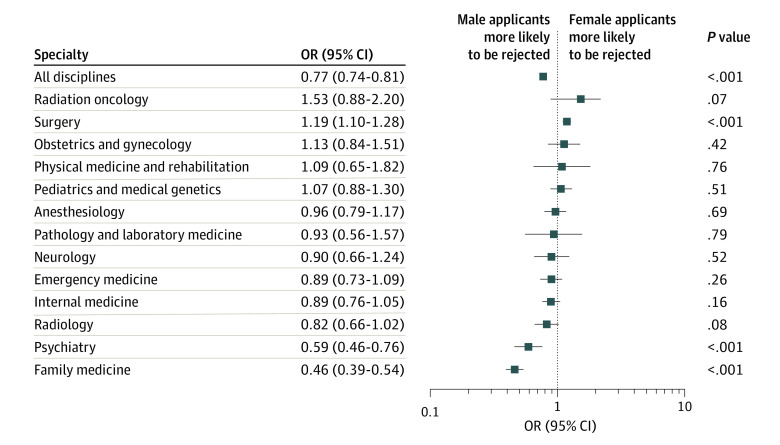
Results: A total of 48 424 applicants were identified (26 407 [54.5%] female applicants), of which 41 037 were matched applicants. Using specialty groupings, female applicants were most highly represented in obstetrics and gynecology (1776 of 2090 [85.0%]) and least represented in radiology (658 of 2055 [32.0%]). Within individual subspecialties, female applicants had the lowest representation in neurosurgery (90 of 394 [22.8%]). While female applicants represented an increasing proportion of the overall applicant population between 1995 and 2019 (z = 2.71; P = .007), significant increases were seen in some, but not all, individual specialties. Differences by sex were found among Canadian medical graduate match rates to their top-ranked specialty: female applicants had a lower likelihood of being rejected for family medicine (rejection of male applicants: OR, 0.46; 95% CI, 0.39-0.54; P < .001) and psychiatry (OR, 0.59; 95% CI, 0.46-0.76; P < .001) and were more likely to be rejected for all-encompassing surgery (acceptance of male applicants: OR, 1.19; 95% CI, 1.10-1.28; P < .001).
Conclusions and relevance: Increasing representation of female residency applicants over time was seen in some, but not all, medical specialties in Canada, and sex-based differences in successful match rates were observed in some specialties. The reasons for these disparities require further investigation for corrective strategies to be identified.
Conflict of interest statement
Figures
Comment in
-
The Impacts of Gender Disparity in Residency Matching.JAMA Netw Open. 2020 Nov 2;3(11):e2028161. doi: 10.1001/jamanetworkopen.2020.28161. JAMA Netw Open. 2020. PMID: 33231633 No abstract available.
References
Publication types
MeSH terms
LinkOut - more resources
Full Text Sources
