

Drug repositioning as a therapeutic strategy for neurodegenerations associated with OPA1 mutations
- PMID: 33231680
- PMCID: PMC7823107
- DOI: 10.1093/hmg/ddaa244
Drug repositioning as a therapeutic strategy for neurodegenerations associated with OPA1 mutations
Abstract
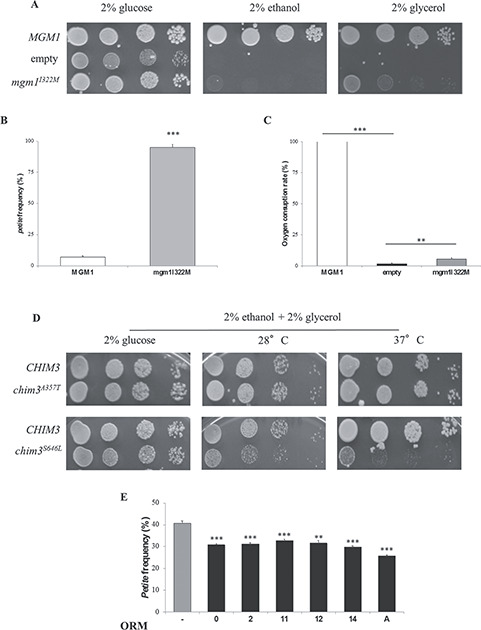
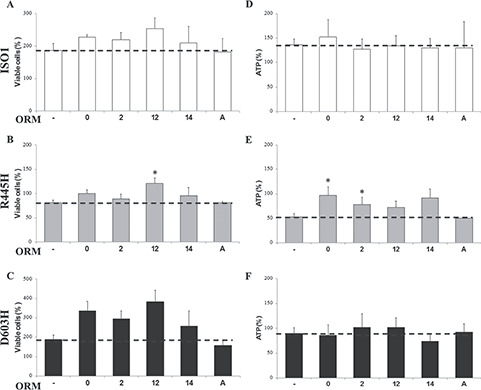
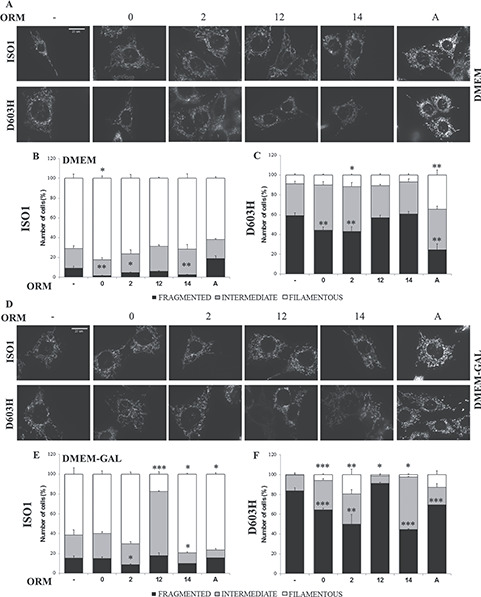
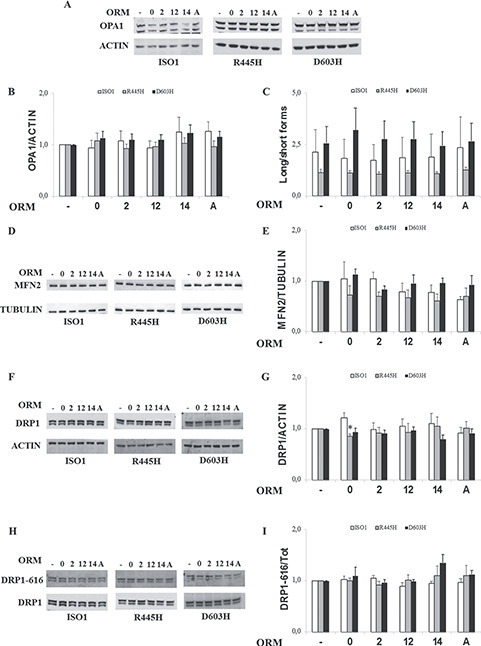
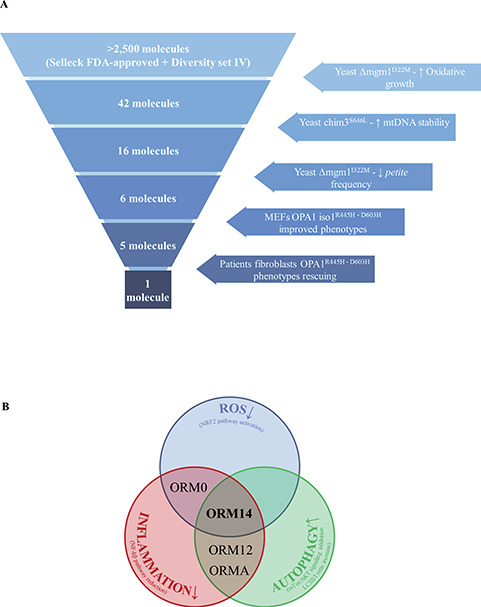
OPA1 mutations are the major cause of dominant optic atrophy (DOA) and the syndromic form DOA plus, pathologies for which there is no established cure. We used a 'drug repurposing' approach to identify FDA-approved molecules able to rescue the mitochondrial dysfunctions induced by OPA1 mutations. We screened two different chemical libraries by using two yeast strains carrying the mgm1I322M and the chim3P646L mutations, identifying 26 drugs able to rescue their oxidative growth phenotype. Six of them, able to reduce the mitochondrial DNA instability in yeast, have been then tested in Opa1 deleted mouse embryonic fibroblasts expressing the human OPA1 isoform 1 bearing the R445H and D603H mutations. Some of these molecules were able to ameliorate the energetic functions and/or the mitochondrial network morphology, depending on the type of OPA1 mutation. The final validation has been performed in patients' fibroblasts, allowing to select the most effective molecules. Our current results are instrumental to rapidly translating the findings of this drug repurposing approach into clinical trial for DOA and other neurodegenerations caused by OPA1 mutations.
© The Author(s) 2020. Published by Oxford University Press. All rights reserved. For Permissions, please email: journals.permissions@oup.com.
Figures
Similar articles
-
Deciphering OPA1 mutations pathogenicity by combined analysis of human, mouse and yeast cell models.Biochim Biophys Acta Mol Basis Dis. 2018 Oct;1864(10):3496-3514. doi: 10.1016/j.bbadis.2018.08.004. Epub 2018 Aug 4. Biochim Biophys Acta Mol Basis Dis. 2018. PMID: 30293569
-
OPA1: How much do we know to approach therapy?Pharmacol Res. 2018 May;131:199-210. doi: 10.1016/j.phrs.2018.02.018. Epub 2018 Feb 15. Pharmacol Res. 2018. PMID: 29454676 Review.
-
OPA1 mutations associated with dominant optic atrophy impair oxidative phosphorylation and mitochondrial fusion.Brain. 2008 Feb;131(Pt 2):352-67. doi: 10.1093/brain/awm335. Brain. 2008. PMID: 18222991
-
Validation of a MGM1/OPA1 chimeric gene for functional analysis in yeast of mutations associated with dominant optic atrophy.Mitochondrion. 2015 Nov;25:38-48. doi: 10.1016/j.mito.2015.10.002. Epub 2015 Oct 8. Mitochondrion. 2015. PMID: 26455272
-
OPA1 (Kjer type) dominant optic atrophy: a novel mitochondrial disease.Mol Genet Metab. 2002 Feb;75(2):97-107. doi: 10.1006/mgme.2001.3278. Mol Genet Metab. 2002. PMID: 11855928 Review.
Cited by
-
A Yeast-Based Screening Unravels Potential Therapeutic Molecules for Mitochondrial Diseases Associated with Dominant ANT1 Mutations.Int J Mol Sci. 2021 Apr 24;22(9):4461. doi: 10.3390/ijms22094461. Int J Mol Sci. 2021. PMID: 33923309 Free PMC article.
-
Drug Drop Test: How to Quickly Identify Potential Therapeutic Compounds for Mitochondrial Diseases Using Yeast Saccharomyces cerevisiae.Int J Mol Sci. 2023 Jun 27;24(13):10696. doi: 10.3390/ijms241310696. Int J Mol Sci. 2023. PMID: 37445873 Free PMC article. Review.
-
Mitochondrial Fission and Fusion: Molecular Mechanisms, Biological Functions, and Related Disorders.Membranes (Basel). 2022 Sep 16;12(9):893. doi: 10.3390/membranes12090893. Membranes (Basel). 2022. PMID: 36135912 Free PMC article. Review.
-
Molecular Mechanisms behind Inherited Neurodegeneration of the Optic Nerve.Biomolecules. 2021 Mar 25;11(4):496. doi: 10.3390/biom11040496. Biomolecules. 2021. PMID: 33806088 Free PMC article. Review.
-
Modopathies Caused by Mutations in Genes Encoding for Mitochondrial RNA Modifying Enzymes: Molecular Mechanisms and Yeast Disease Models.Int J Mol Sci. 2023 Jan 22;24(3):2178. doi: 10.3390/ijms24032178. Int J Mol Sci. 2023. PMID: 36768505 Free PMC article. Review.
References
-
- Ban T., Ishihara T., Kohno H., Saita S., Ichimura A., Maenaka K., Oka T., Mihara K. and Ishihara N. (2017) Molecular basis of selective mitochondrial fusion by heterotypic action between OPA1 and cardiolipin. Nat. Cell Biol., 19, 856–863. - PubMed
-
- Frezza C., Cipolat S., Martins de Brito O., Micaroni M., Beznoussenko G.V., Rudka T., Bartoli D., Polishuck R.S., Danial N.N., De Strooper B. et al. (2006) OPA1 controls apoptotic cristae remodeling independently from mitochondrial fusion. Cell, 14, 177–189. - PubMed
Publication types
MeSH terms
Substances
LinkOut - more resources
Full Text Sources
Medical
Molecular Biology Databases
