. 2021 Mar;42(4):1054-1069.
doi: 10.1002/hbm.25277. Epub 2020 Nov 24.

Brain functional connectivity dynamics at rest in the aftermath of affective and cognitive challenges

Affiliations

Brain functional connectivity dynamics at rest in the aftermath of affective and cognitive challenges

Julian Gaviria et al. Hum Brain Mapp. 2021 Mar.

Abstract

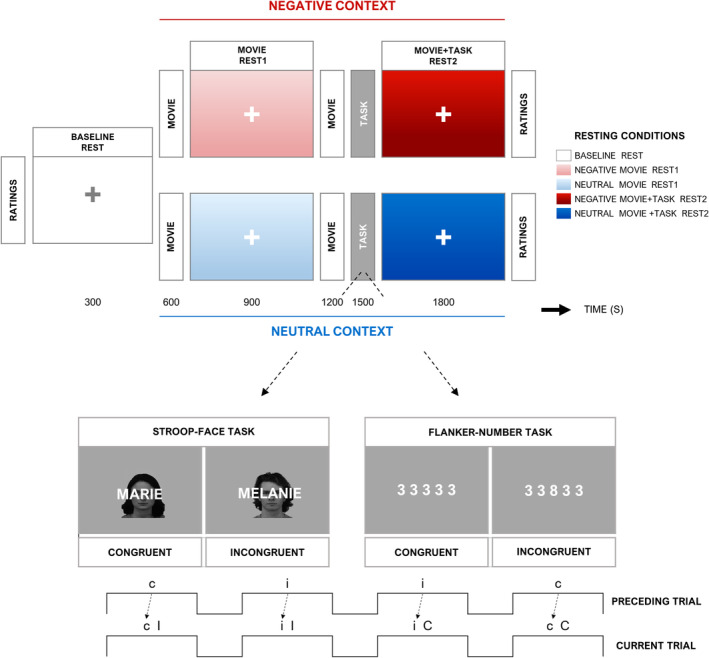
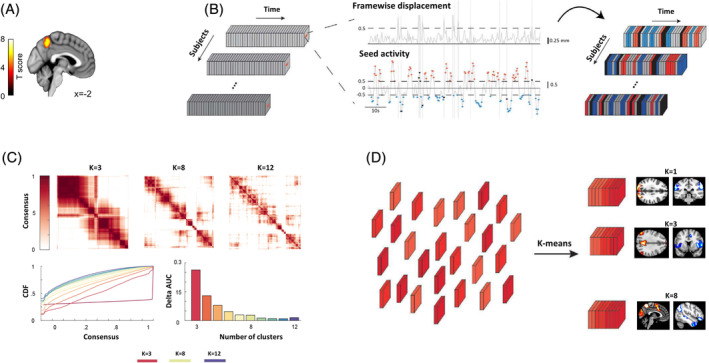
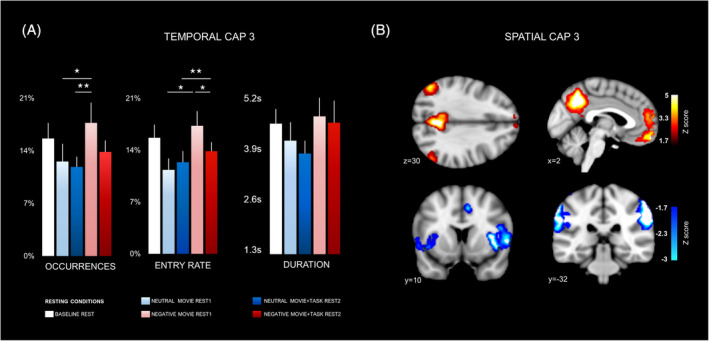
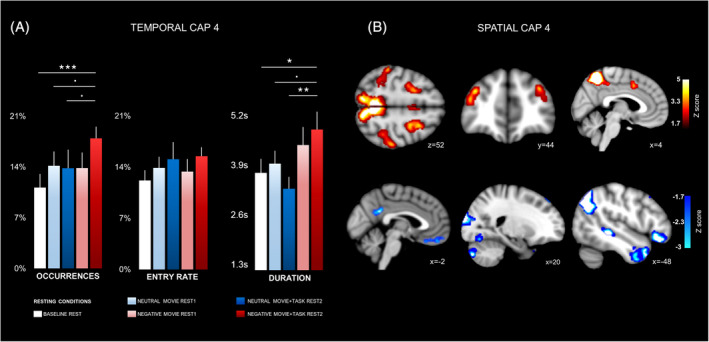
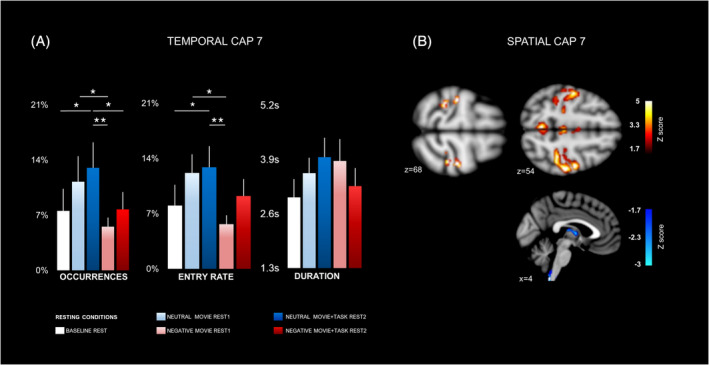
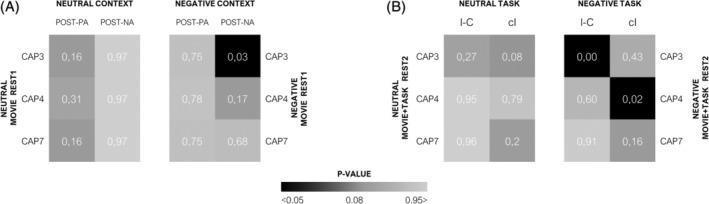
Carry-over effects on brain states have been reported following emotional and cognitive events, persisting even during subsequent rest. Here, we investigated such effects by identifying recurring co-activation patterns (CAPs) in neural networks at rest with functional magnetic resonance imaging (fMRI). We compared carry-over effects on brain-wide CAPs at rest and their modulation after both affective and cognitive challenges. Healthy participants underwent fMRI scanning during emotional induction with negative valence and performed cognitive control tasks, each followed by resting periods. Several CAPs, overlapping with the default-mode (DMN), salience, dorsal attention, and social cognition networks were impacted by both the preceding events (movie or task) and the emotional valence of the experimental contexts (neutral or negative), with differential dynamic fluctuations over time. Temporal metrics of DMN-related CAPs were altered after exposure to negative emotional content (compared to neutral) and predicted changes in subjective affect on self-reported scores. In parallel, duration rates of another attention-related CAP increased with greater task difficulty during the preceding cognitive control condition, specifically in the negative context. These findings provide new insights on the anatomical organization and temporal inertia of functional brain networks, whose expression is differentially shaped by emotional states, presumably mediating adaptive homeostatic processes subsequent to behaviorally challenging events.

Keywords: brain networks; co-activation patterns; cognitive control; dynamic functional connectivity (dFC); emotions; negative affect.


Conflict of interest statement

The authors declare no conflict of interest.

Figures

FIGURE 1
FIGURE 1
Paradigm design. (a) Initially, a baseline block (baseline rest) was recorded, preceded by an affective screening. Subsequently two experimental contexts (neutral and negative) were presented in the same functional magnetic resonance imaging (fMRI) scanning session. Each context consisted of: 1) a movie clip (5 min) followed by a rest period (movie rest1). 2) A second movie clip (5 min) and a cognitive control task (~5 min) preceding a second rest period (movie + task rest2). The contexts were differentiated by the affective valence of the clips (e.g., two negative films in the negative context). Then, 18 min (approx.) elapsed between the first and second experimental context, in order to implement a second affective screening and the clips subjective assessment. The order of the affective context was counterbalanced across participants. The Stroop and Flanker tasks were equally counterbalanced across participants and affective contexts. (b) Top: Illustration of stimuli in the Stroop task (left) and Flanker task (right). Bottom: Trial types of each cognitive task, including congruent (C) and incongruent (I) trials that could be preceded by either the same or opposite condition (“c” or “i” trials), in a semi‐random but balanced order. This resulted in four trial types, allowing subsequent behavioral analysis according to both current congruence (indicated by upper‐case letters “C” and “I”) and congruence of the preceding trial (indicated by lower‐case letters “c” and “i”)
FIGURE 2
FIGURE 2
Co‐activation pattern (CAP) analysis pipeline. (a) Seed region of interest (ROI) in precuneus used for the CAP analysis and identified by a preliminary GLM analysis, showing increased activity during negative versus neutral movies. Full GLM results on the movie clips are found in Table S1. (b) The activity time‐course from the precuneus seed is computed for each subject across all resting state blocks, and the frames for which it exceeds a threshold T seed = 0.5 either positively (red) or negatively (blue) are tagged. Frames corrupted by a framewise displacement are also tagged (black) and removed from analysis. (c) A consensus resampling‐based clustering algorithm was implemented to obtain the number and membership (consensus) of reliable CAPs within our dataset. Parameters used to calculate the “consensus rate” between all pairs of samples included 80% of item resampling, a maximum k of 12, and 50 resamplings, with Euclidean distance indices as the distance measurement. Up: Heatmaps of consensus matrices for k = 3, k = 8, k = 12, where values range from 0 (samples are never clustered together across consensus folds) to 1 (always clustered together), marked by white to dark red colors. Bottom left: consensus cumulative distribution function (CDF) of the consensus matrices from k = 2 to k = 12 (k = 3, k = 8, and k = 12; indicated by red, laguna yellow, and purple, respectively), describing how consensus entries distribute for each case. Bottom right: Delta area under the curve plot, indicating the relative change in area under the CDF curve (a larger area change implies a larger increase in the quality of clustering at the assessed k). These results provide qualitative (top matrices) and quantitative (bottom plots) information suggesting that k = 8 is the optimal number of clusters for classifying our functional magnetic resonance imaging (fMRI) rest dataset. (d) Retained frames across subjects (depicted by different shades of red) undergo k‐means clustering to be separated into K different CAPs, each defined as the arithmetic mean between the subset of frames denoting one particular network of regions (voxelwise), with which the seed was strongly co‐(de)active at the same time points. Adapted from reference Bolton et al. (2020)
FIGURE 3
FIGURE 3
Spatial and temporal characteristics of CAP3. (a) Occurrence rate (left), entry rate (middle), and duration (right), are shown for each experimental condition. Stars indicate significant differences among conditions in a mixed model‐based analysis of variance (ANOVA) (see Section 3 and Table 1). Error bars indicate SEM. (b) Spatial configuration of CAP3. Hot colors (above) represent areas with transient positive co‐activation with the precuneus seed, while cold colors (below) represent areas with transient negative co‐deactivation with precuneus (see Table S4 for details). Slice coordinates are provided in MNI space. Brain regions were observed at Z = <−1.7 (p < .05)
FIGURE 4
FIGURE 4
Spatial and temporal characteristics of CAP4. (a) Occurrence rate (left), entry rate (middle), and duration (right) across all participants are shown for all conditions. Stars indicate significant differences between conditions (see Section 3 and Table 1). Error bars indicate SEM. (b) Spatial configuration of CAP4. Hot colors (above) represent areas with transient positive co‐activation with the precuneus seed, while cold colors (below) represent areas with transient negative co‐deactivation with precuneus (see Table S4 for details). Slice coordinates are provided in MNI space. Brain regions were observed at Z = < −1.7 (p < .05)
FIGURE 5
FIGURE 5
Spatial and temporal characteristics of CAP7. (a) Occurrence rate (left), entry rate (middle), and duration (right) across all participants are shown for all conditions. Stars indicate significant differences between conditions (see Section 3 and Table 1). Error bars indicate SEM. (b) Spatial configuration of CAP7. Hot colors (above) represent areas with transient positive co‐activation with the precuneus seed, while cold colors (below) represent areas with transient negative co‐deactivation with precuneus (see Table S4 for a details). Slice coordinates are provided in MNI space. Brain regions were observed at Z = <−1.7 (p < .05)
FIGURE 6
FIGURE 6
Functional relationship of co‐activation patterns (CAPs) expression with behavioral indices. (a) Probability (p) values of partial associations between affective scores (PANAS) and the three CAPs of interest. PANAS ratings measured after each experimental context (post movie exposure) were modeled as predictors, whereas entry rates of CAPs from the “movie rest1” conditions were introduced as multiple predicted variables in the Generalized estimated equations (GEEs) models. (b) Probability (p) values of partial associations between cognitive control load and the relevant CAPs. Cognitive load was measured by the interference effect (I–C trials) and response times (RTs) on “cI” trials (most difficult task condition) and used as predictors, whereas the CAPs (entries and durations) from the “movie + task rest2” conditions were outcome variables. The p value significance was adjusted by the false discovery rate (FDR) method for multiple testing under dependency

References

    1. Andreano, J. M. , Touroutoglou, A. , Dickerson, B. , & Feldman, B. L. (2018). Hormonal cycles, brain network connectivity, and windows of vulnerability to affective disorder. Trends in Neurosciences, 41, 660–676. 10.1016/j.tins.2018.08.007. - DOI - PMC - PubMed
    1. Apazoglou, K. , Küng, A.‐L. , Cordera, P. , Aubry, J.‐M. , Dayer, A. , Vuilleumier, P. , & Piguet, C. (2019). Rumination related activity in brain networks mediating attentional switching in euthymic bipolar patients. International Journal of Bipolar Disorders, 7, 3 10.1186/s40345-018-0137-5. - DOI - PMC - PubMed
    1. Barnes, A. , Bullmore, E. T. , & Suckling, J. (2009). Endogenous human brain dynamics recover slowly following cognitive effort. PLoS One, 4, e6626 10.1371/journal.pone.0006626/nhttp://www.plosone.org/article/fetchObject.action?uri=info:doi/10.1371/journal..... - DOI - PMC - PubMed
    1. Baumeister, R. F. (2003). Ego depletion and self‐regulation failure: A resource model of self‐control. Alcoholism, Clinical and Experimental Research, 27, 281–284. - PubMed
    1. Belleau, E. L. , Taubitz, L. E. , & Larson, C. L. (2015). Imbalance of default mode and regulatory networks during externally focused processing in depression. Social Cognitive and Affective Neuroscience, 10, 744–751. - PMC - PubMed

Publication types