. 2020 Nov 24;12(24):25778-25804.
doi: 10.18632/aging.104199. Epub 2020 Nov 24.

Identification of prognostic aging-related genes associated with immunosuppression and inflammation in head and neck squamous cell carcinoma

Affiliations

Identification of prognostic aging-related genes associated with immunosuppression and inflammation in head and neck squamous cell carcinoma

Jing Yang et al. Aging (Albany NY). .

Abstract

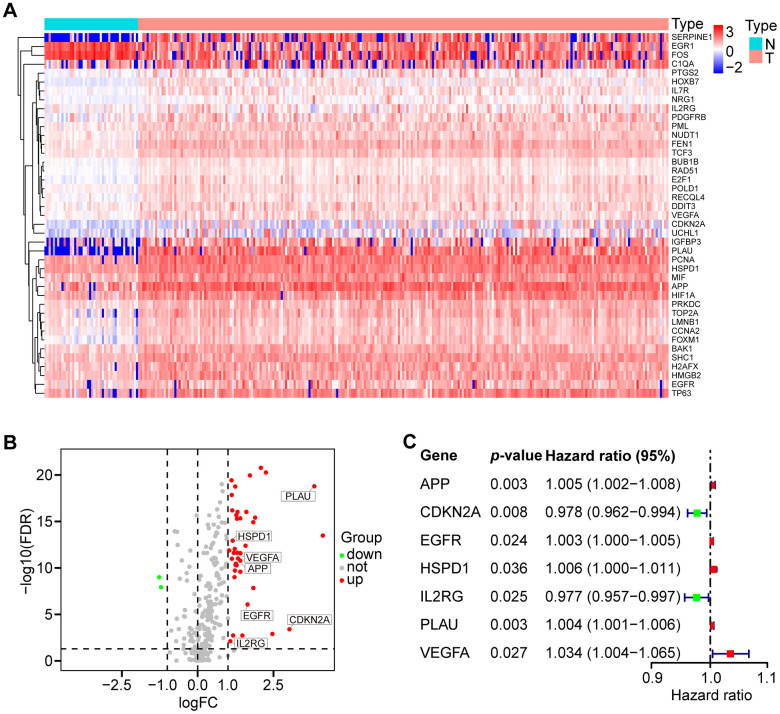
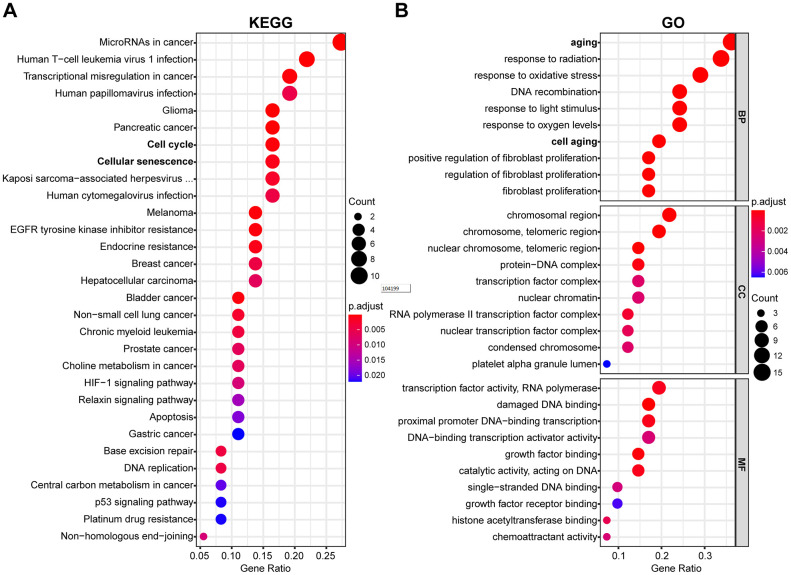
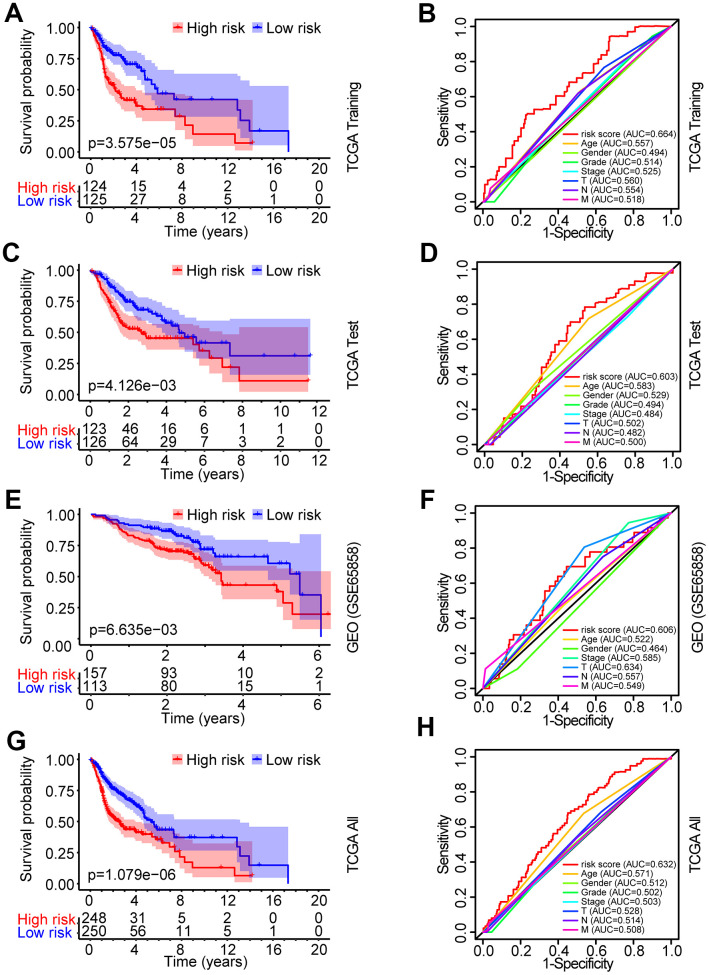
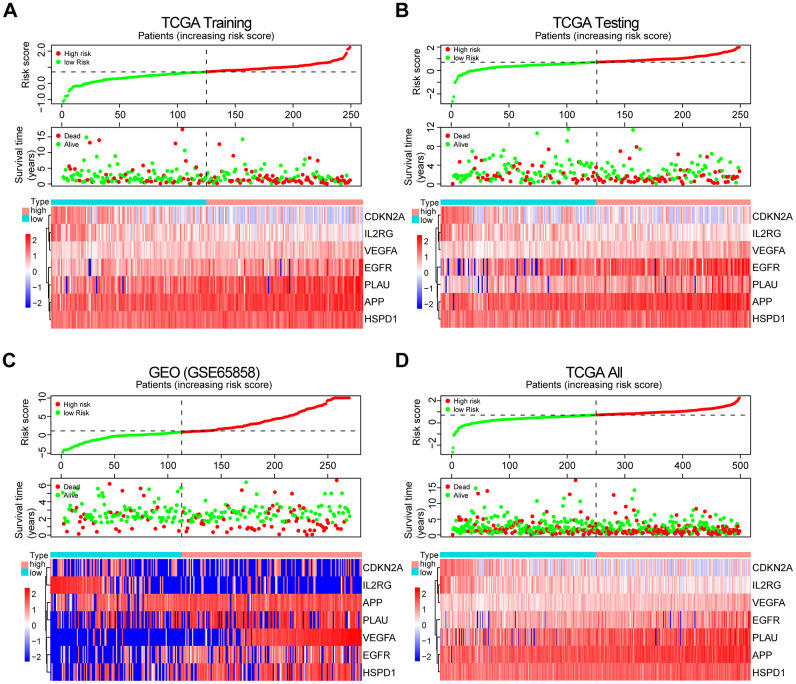
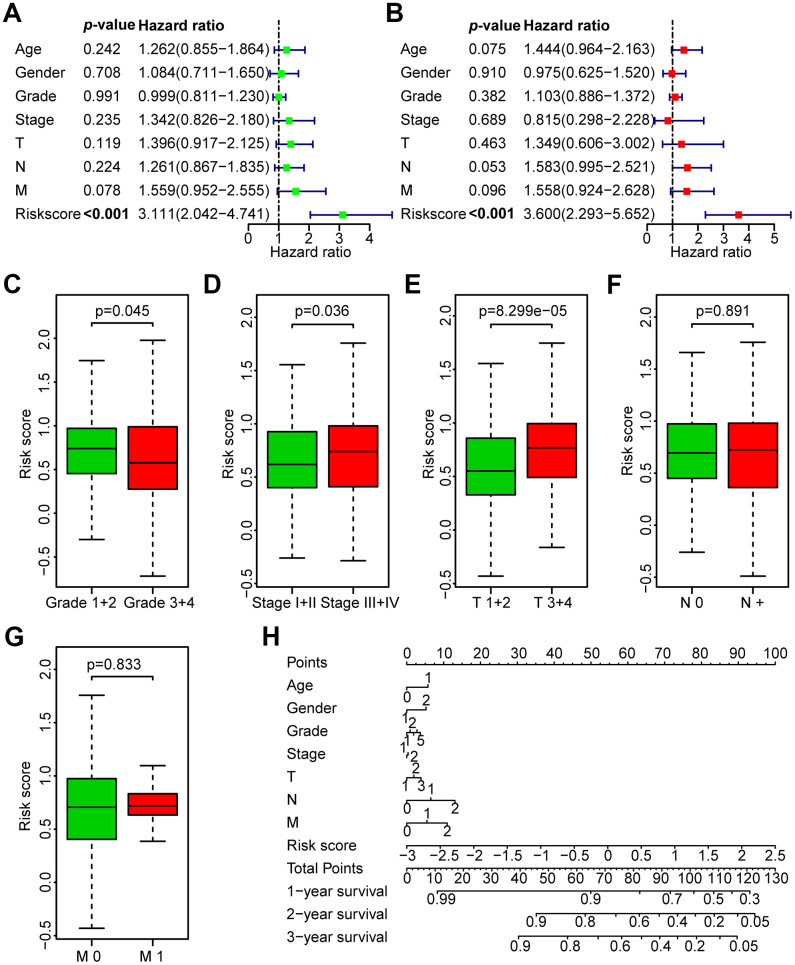
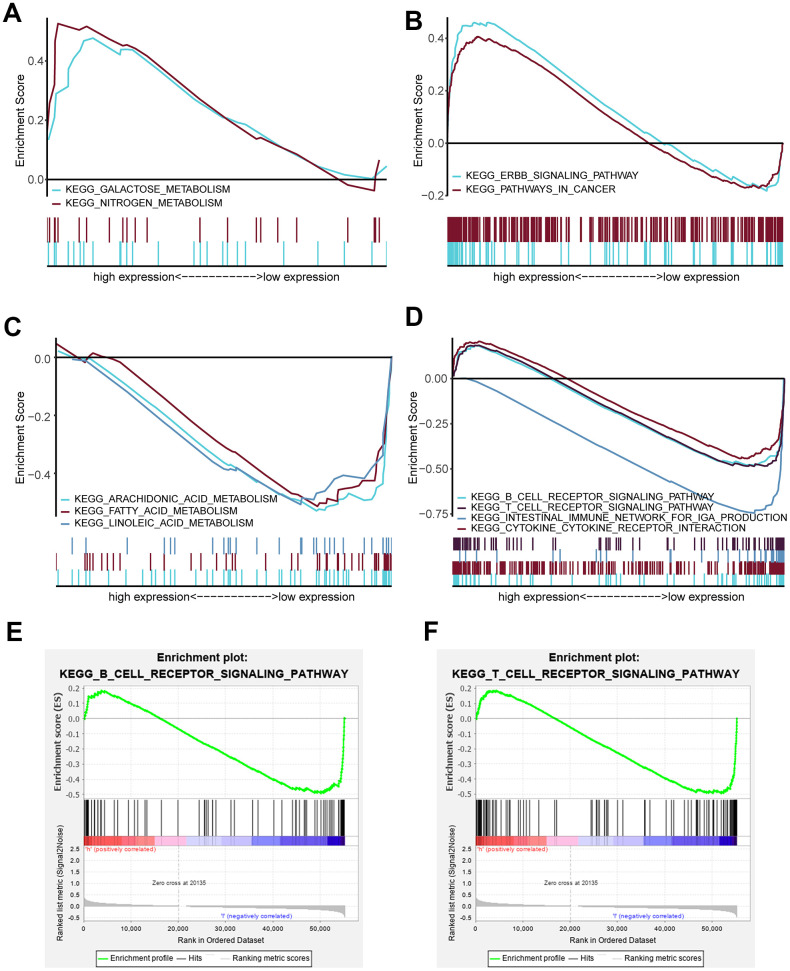
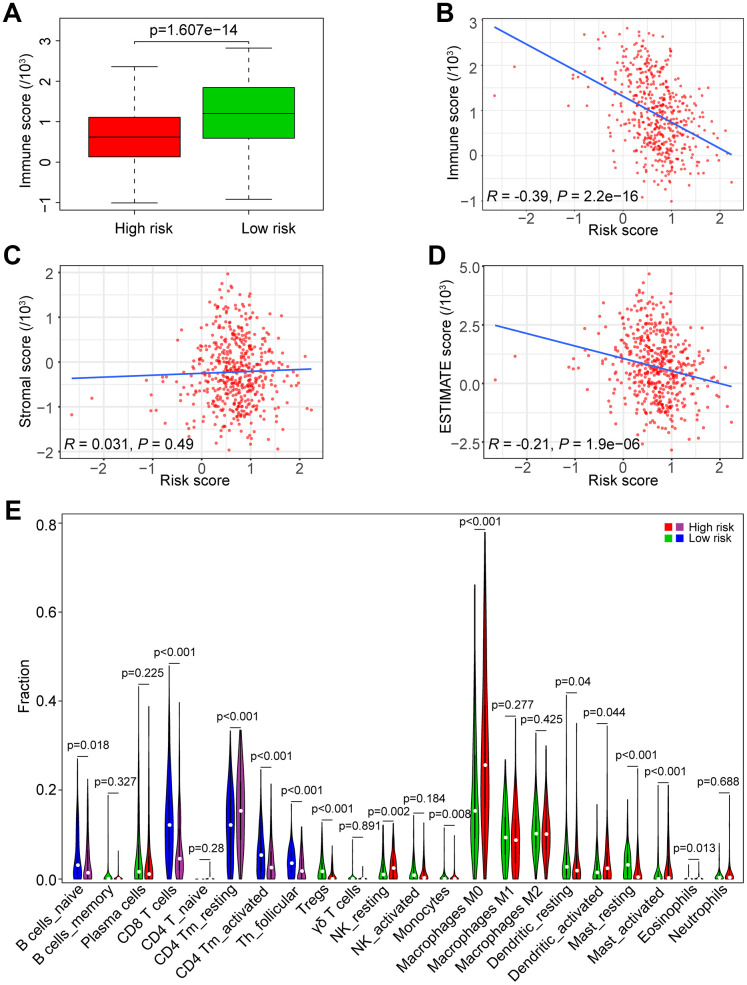
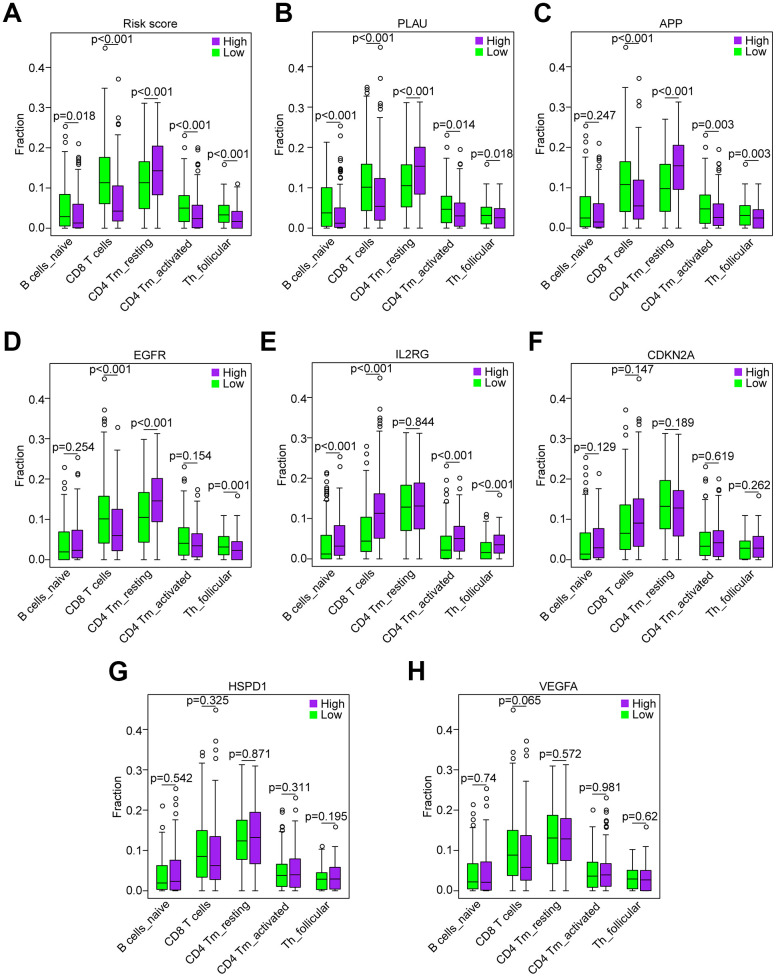
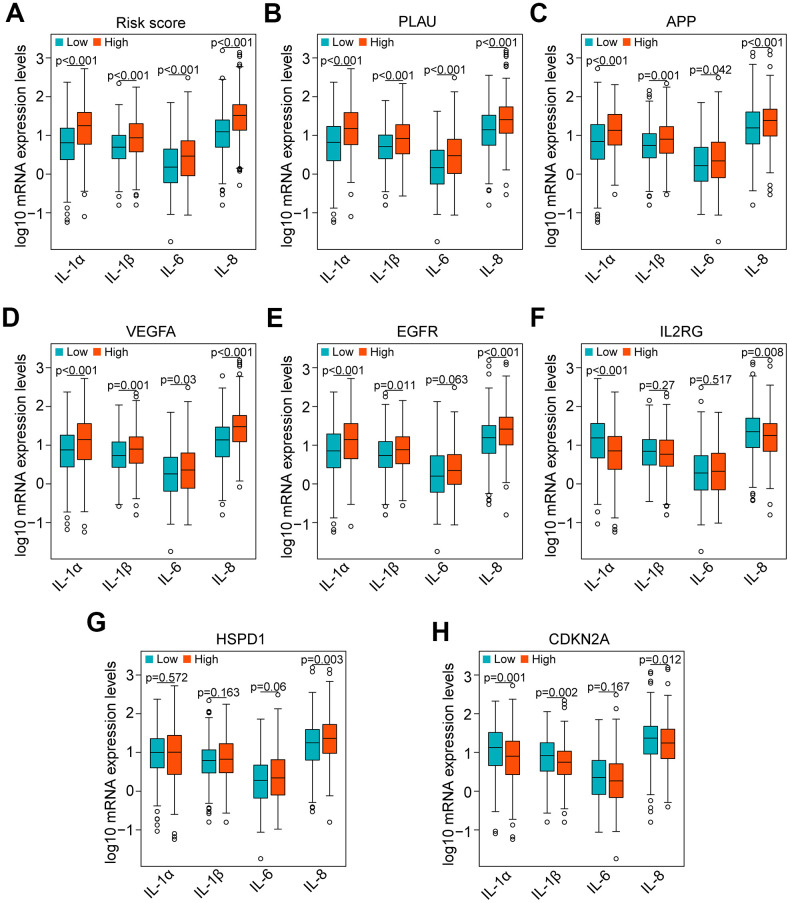
Aging is regarded as a dominant risk factor for cancer. Additionally, inflammation and asthenic immune surveillance with aging may facilitate tumor formation and development. However, few studies have comprehensively analyzed the relationship between aging-related genes (AGs) and the prognosis, inflammation and tumor immunity of head and neck squamous cell carcinoma (HNSCC). Here, we initially screened 41 differentially expressed AGs from The Cancer Genome Atlas (TCGA) database. In the training set, a prognosis risk model with seven AGs (APP, CDKN2A, EGFR, HSPD1, IL2RG, PLAU and VEGFA) was constructed and validated in the TCGA test set and the GEO set (P < 0.05). Using univariate and multivariate Cox regression analyses, we confirmed that risk score was an independent prognostic factor of HNSCC patients. In addition, a high risk score was significantly correlated with immunosuppression, and high expression of PLAU, APP and EGFR was the main factor. Furthermore, we confirmed that a high risk score was significantly associated with levels of proinflammatory factors (IL-1α, IL-1β, IL-6 and IL-8) in HNSCC samples. Thus, this risk model may serve as a prognostic signature and provide clues for individualized immunotherapy for HNSCC patients.

Keywords: aging-related genes (AGs); head and neck squamous cell carcinoma (HNSCC); immunosuppression; inflammation; prognosis.


Conflict of interest statement

CONFLICTS OF INTEREST: All authors declare that they have no conflicts of interest.

Figures

Figure 1
Figure 1
Differential expression of aging-related genes (AGs) and 7 AGs of prognostic risk models in HNSCC samples. (A) Hierarchical cluster heat map visualizing 41 differentially expressed AGs (DEAGs). (B) Volcano plot showing 39 upregulated and 2 downregulated DEAGs (FDR < 0.05 and |logFC| > 1). (C) Forest plot showing the characteristics of 7 risk DEAGs in the prognostic risk models.
Figure 2
Figure 2
Functional enrichment analysis of DEAGs of the TCGA data set. (A) The top 30 enriched pathways from KEGG pathway analysis are displayed using an enriched scatter diagram. (B) The top 10 enrichment GO terms of BP, CC and MF for DEAGs are also displayed with a scatter diagram. KEGG, Kyoto Encyclopedia of Genes and Genomes. GO, Gene Ontology; BP, biological process; CC, cell component; MF, molecular function.
Figure 3
Figure 3
Identification and verification of the prognostic risk model in HNSCC. (A) Kaplan-Meier survival curve analysis of OS in the high-risk and low-risk groups of HNSCC patients in the TCGA training set. (B) ROC curve analysis and AUC for the risk score of AGs in the TCGA training set. (C, E, G) Kaplan-Meier survival curve analysis of OS in the high-risk and low-risk groups of HNSCC patients in the TCGA test set, GEO data set and TCGA all data set, respectively. (D, F, H) ROC curve analysis and AUC for the risk score of AGs in the TCGA test set, GEO data set and TCGA all data set, respectively.
Figure 4
Figure 4
Prognosis and expression of risk genes in the high-risk and low-risk groups of HNSCC patients. (A) Risk plot distribution, survival status, and expression of risk genes of HNSCC patients in the TCGA training set. (B) Risk plot distribution, survival status, and expression of risk genes of HNSCC patients in the TCGA test set. (C) Risk plot distribution, survival status, and expression of risk genes of HNSCC patients in the GEO test set. (D) Risk plot distribution, survival status, and expression of risk genes of HNSCC patients in the TCGA all data set.
Figure 5
Figure 5
Correlation between the risk score and the clinicopathological characteristics of HNSCC patients. (A) Univariate Cox regression analysis of clinicopathological parameters of the patients in the TCGA training set. (B) Multivariate Cox regression analysis of the clinicopathological parameters of the patients in the TCGA training set. (C) Subgroup analysis of pathology grade (Grades 1+2 vs. Grades 3+4). (D) Subgroup analysis of clinical stage (Stages I+II vs. Stages III+IV). (E) Subgroup analysis of T classification (T 1+2 vs. T 3+4). (F) Subgroup analysis of N classification (N0 vs. N+). (G) Subgroup analysis of M classification (M 0 vs. M 1). (H) Nomogram for OS of HNSCC patients.
Figure 6
Figure 6
Enriched pathways of the high-risk and low-risk groups via GSEA. (A) Multiple GSEA for metabolism of the high-risk group: galactose metabolism and nitrogen metabolism. (B) Multiple GSEA for cancer pathways of the high-risk group: the ERBB signaling pathway and pathway in cancer. (C) Multiple GSEA for metabolism of the low-risk group: arachidonic acid metabolism, fatty acid metabolism and linoleic acid metabolism. (D) Multiple GSEA for inflammation and immunity of the low-risk group: the B cell receptor signaling pathway, T cell receptor signaling pathway, intestinal immune network for IgA production and cytokine_cytokine receptor interaction. (E) Single GSEA showing the B cell receptor signaling pathway. (F) Single GSEA showing the T cell receptor signaling pathway.
Figure 7
Figure 7
Association of the risk score with tumor immunity in the TCGA data set. (A) Distribution of immune scores according to the risk score of HNSCC patients. (B) Correlation of the risk score with the immune score in HNSCC samples. (C) Correlation of the risk score with the stromal score in HNSCC samples. (D) Correlation of the risk score with the ESTIMATE score in HNSCC samples. (E) Comparisons of immune cells between the high-risk and low-risk groups.
Figure 8
Figure 8
Correlation of the five immune cells with genes of the risk model in the TCGA data set. (A) Comparison of the five immune cells (naïve B cells, CD8 T cells, CD4 memory activated T cells and follicular helper T cells) between the high-risk and low-risk groups. (BH) Distribution of the five immune cells based on the high expression and low expression of PLAU, APP, EGFR, IL2RG, CDKN2A, HSPD1 and VEGFA.
Figure 9
Figure 9
Correlation of proinflammatory factors with the risk score and genes of the risk model in the TCGA data set. (A) Comparison of the main proinflammatory factors (IL-1α, IL-1β, IL-6 and IL-8) between the high-risk and low-risk groups. (BH) Distribution of the main proinflammatory factors based on high and low expression of PLAU, APP, VEGFA, EGFR, IL2RG, HSPD1 and CDKN2A.

Similar articles

Cited by

References

    1. Bray F, Ferlay J, Soerjomataram I, Siegel RL, Torre LA, Jemal A. Global cancer statistics 2018: GLOBOCAN estimates of incidence and mortality worldwide for 36 cancers in 185 countries. CA Cancer J Clin. 2018; 68:394–424. 10.3322/caac.21492 - DOI - PubMed
    1. Cramer JD, Burtness B, Le QT, Ferris RL. The changing therapeutic landscape of head and neck cancer. Nat Rev Clin Oncol. 2019; 16:669–83. 10.1038/s41571-019-0227-z - DOI - PubMed
    1. Hill SJ, D’Andrea AD. Predictive potential of head and neck squamous cell carcinoma organoids. Cancer Discov. 2019; 9:828–30. 10.1158/2159-8290.CD-19-0527 - DOI - PubMed
    1. Siegel RL, Miller KD, Jemal A. Cancer statistics, 2020. CA Cancer J Clin. 2020; 70:7–30. 10.3322/caac.21590 - DOI - PubMed
    1. López-Otín C, Blasco MA, Partridge L, Serrano M, Kroemer G. The hallmarks of aging. Cell. 2013; 153:1194–217. 10.1016/j.cell.2013.05.039 - DOI - PMC - PubMed

Publication types

MeSH terms