

Transforming the study of organisms: Phenomic data models and knowledge bases
- PMID: 33232313
- PMCID: PMC7685442
- DOI: 10.1371/journal.pcbi.1008376
Transforming the study of organisms: Phenomic data models and knowledge bases
Abstract
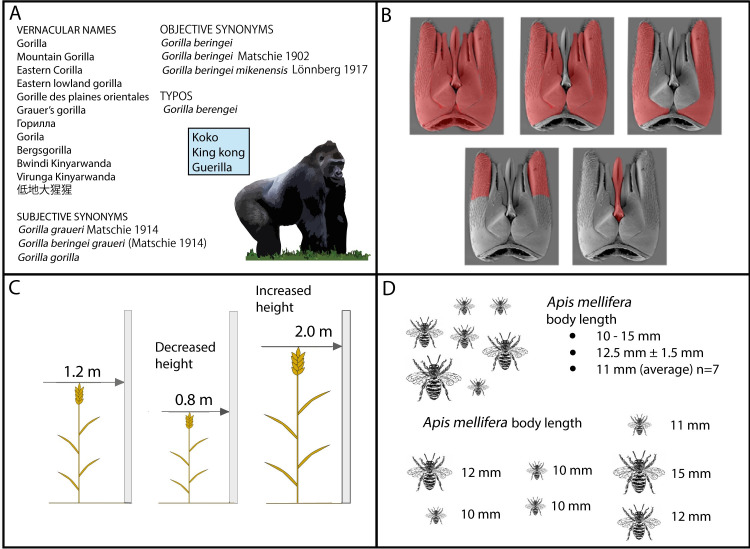
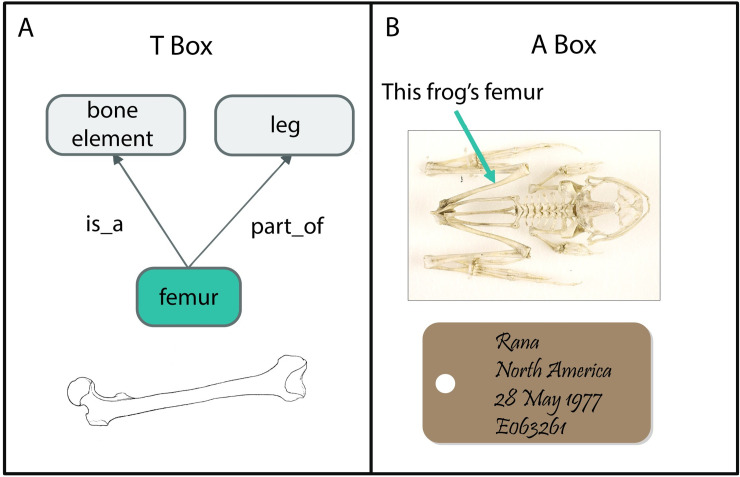
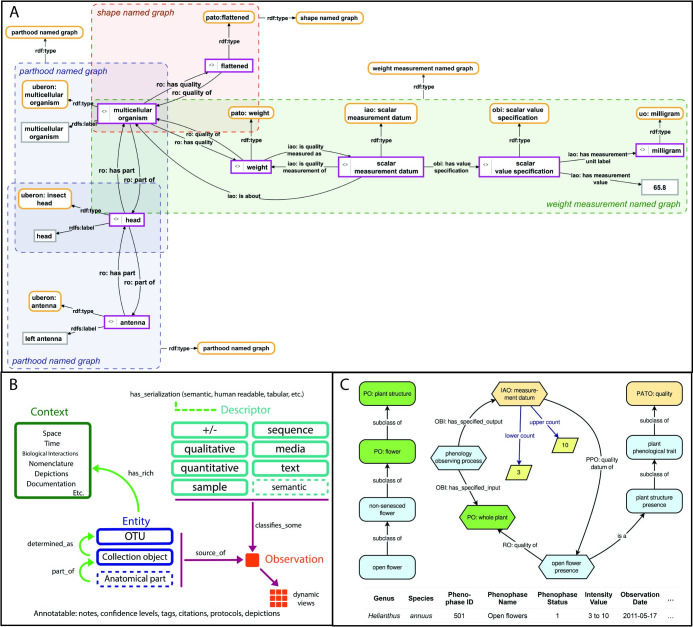
The rapidly decreasing cost of gene sequencing has resulted in a deluge of genomic data from across the tree of life; however, outside a few model organism databases, genomic data are limited in their scientific impact because they are not accompanied by computable phenomic data. The majority of phenomic data are contained in countless small, heterogeneous phenotypic data sets that are very difficult or impossible to integrate at scale because of variable formats, lack of digitization, and linguistic problems. One powerful solution is to represent phenotypic data using data models with precise, computable semantics, but adoption of semantic standards for representing phenotypic data has been slow, especially in biodiversity and ecology. Some phenotypic and trait data are available in a semantic language from knowledge bases, but these are often not interoperable. In this review, we will compare and contrast existing ontology and data models, focusing on nonhuman phenotypes and traits. We discuss barriers to integration of phenotypic data and make recommendations for developing an operationally useful, semantically interoperable phenotypic data ecosystem.
Conflict of interest statement
I have read the journal's policy and the authors of this manuscript have the following competing interests: Jessica Singer and Robert Warren are employed by Annex Agriculture. They have no consultancies, patents, products in development, or marketed products that form a competing interest. This does not alter our adherence to all PLOS Computational Biology policies on sharing data and materials.
Figures
Similar articles
-
Identifying disease-causal genes using Semantic Web-based representation of integrated genomic and phenomic knowledge.J Biomed Inform. 2008 Oct;41(5):717-29. doi: 10.1016/j.jbi.2008.07.004. Epub 2008 Aug 23. J Biomed Inform. 2008. PMID: 18755295
-
KaBOB: ontology-based semantic integration of biomedical databases.BMC Bioinformatics. 2015 Apr 23;16(1):126. doi: 10.1186/s12859-015-0559-3. BMC Bioinformatics. 2015. PMID: 25903923 Free PMC article.
-
Computational approaches to phenotyping: high-throughput phenomics.Proc Am Thorac Soc. 2007 Jan;4(1):18-25. doi: 10.1513/pats.200607-142JG. Proc Am Thorac Soc. 2007. PMID: 17202287 Free PMC article. Review.
-
Recursive expectation-maximization clustering: a method for identifying buffering mechanisms composed of phenomic modules.Chaos. 2010 Jun;20(2):026103. doi: 10.1063/1.3455188. Chaos. 2010. PMID: 20590332 Free PMC article.
-
The Alliance of Genome Resources: Building a Modern Data Ecosystem for Model Organism Databases.Genetics. 2019 Dec;213(4):1189-1196. doi: 10.1534/genetics.119.302523. Genetics. 2019. PMID: 31796553 Free PMC article. Review.
Cited by
-
The Ontology of Biological Attributes (OBA) - Computational Traits for the Life Sciences.bioRxiv [Preprint]. 2023 Jan 27:2023.01.26.525742. doi: 10.1101/2023.01.26.525742. bioRxiv. 2023. Update in: Mamm Genome. 2023 Sep;34(3):364-378. doi: 10.1007/s00335-023-09992-1. PMID: 36747660 Free PMC article. Updated. Preprint.
-
An open source knowledge graph ecosystem for the life sciences.Sci Data. 2024 Apr 11;11(1):363. doi: 10.1038/s41597-024-03171-w. Sci Data. 2024. PMID: 38605048 Free PMC article.
-
Advanced prokaryotic systematics: the modern face of an ancient science.New Microbes New Infect. 2022 Nov 11;49-50:101036. doi: 10.1016/j.nmni.2022.101036. eCollection 2022 Nov-Dec. New Microbes New Infect. 2022. PMID: 36425013 Free PMC article.
-
The Ontology of Biological Attributes (OBA)-computational traits for the life sciences.Mamm Genome. 2023 Sep;34(3):364-378. doi: 10.1007/s00335-023-09992-1. Epub 2023 Apr 19. Mamm Genome. 2023. PMID: 37076585 Free PMC article.
-
Pleiotropy data resource as a primer for investigating co-morbidities/multi-morbidities and their role in disease.Mamm Genome. 2022 Mar;33(1):135-142. doi: 10.1007/s00335-021-09917-w. Epub 2021 Sep 15. Mamm Genome. 2022. PMID: 34524473 Free PMC article.
