. 2020 Nov 24;18(11):e3000926.
doi: 10.1371/journal.pbio.3000926. eCollection 2020 Nov.

Evolution and lineage dynamics of a transmissible cancer in Tasmanian devils

Affiliations

Evolution and lineage dynamics of a transmissible cancer in Tasmanian devils

Young Mi Kwon et al. PLoS Biol. .

Abstract

Devil facial tumour 1 (DFT1) is a transmissible cancer clone endangering the Tasmanian devil. The expansion of DFT1 across Tasmania has been documented, but little is known of its evolutionary history. We analysed genomes of 648 DFT1 tumours collected throughout the disease range between 2003 and 2018. DFT1 diverged early into five clades, three spreading widely and two failing to persist. One clade has replaced others at several sites, and rates of DFT1 coinfection are high. DFT1 gradually accumulates copy number variants (CNVs), and its telomere lengths are short but constant. Recurrent CNVs reveal genes under positive selection, sites of genome instability, and repeated loss of a small derived chromosome. Cultured DFT1 cell lines have increased CNV frequency and undergo highly reproducible convergent evolution. Overall, DFT1 is a remarkably stable lineage whose genome illustrates how cancer cells adapt to diverse environments and persist in a parasitic niche.


Conflict of interest statement

The authors have declared that no competing interests exist.

Figures

Fig 1
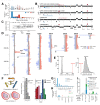
Fig 1. DFT1 phylogeny and lineage dynamics.
(A) Phylogenetic tree constructed using 550 SNVs and 932 CNVs genotyped across 639 DFT1 tumours (9 tumours were excluded from tree due to missing data). Each tip represents a tumour, coloured by clade. Branch lengths are proportional to number of variants, not evolutionary time, and high-resolution bootstrapped tree is available in S1 Fig. Tumours sampled in the north-east of Tasmania (Wukalina), the putative origin of DFT1, are indicated with arrowheads. SNV and CNV genotypes are available in S2 and S3 Tables, respectively. (B) Map of Tasmania showing distribution of DFT1 clades represented by 593 tumours in (A) and S1 Table (metastases, tumours involving captive devils, and cases of repeated sampling of individual tumours are excluded (S1 Table)). Each tumour is represented by a coloured symbol. Mapping coordinates have been randomly offset in heavily sampled labelled locations in order to aid visualisation. Sample density reflects trapping effort, not tumour prevalence. Tumour clade data and geographical coordinates are available in S1 Table. Map outline was obtained from https://library.unimelb.edu.au/collections/map_collection/map_collection_outline_maps. (C) Spatial spread of DFT1 clades. Each tumour is represented by a coloured symbol. Arrows represent putative spatial movements interpreted from the phylogeny, and year when the DFT1 clade was first observed in each location within the set of sampled tumours is marked. Dotted lines demarcate inferred distributions of clades A2 and B before sampling for this study began, with arrows illustrating inferred tumour migrations out of these core areas. Tumour clade data, sampling dates, and geographical coordinates are available in S1 Table. Map outline was obtained from https://library.unimelb.edu.au/collections/map_collection/map_collection_outline_maps. (D) DFT1 clade distribution in nine locations indicated on map in (B) between 2003 and 2018. Distribution of three clade A1 subgroups is shown in Forestier. Tumour population size reflects sampling effort, not disease incidence, and is not comparable between sites. Years with consistent sampling efforts within sites are marked with black dots. All devils were removed from the Forestier Peninsula in 2012 (arrow). Data are available in S1 Table. (E) DFT1 coinfection. The number of devils with between two and nine independently sampled DFT1 tumours is shown (277 devils had only one tumour sampled, not shown on plot). Those devils for which genotypes of all sampled tumours were indistinguishable or could be distinguished only by variation private to the individual are designated as “single infection.” Individual devils hosting tumours with distinct genotypes known to occur in other devils in the population are labelled “coinfection,” although in some cases this might represent sampling of the index tumour within which the new variation arose (S4 Table). An image of a coinfected devil (Devil 165) with tumour genotypes labelled is shown on the right. Underlying data are available in S4 Table. (F) Facial distribution of DFT1 tumours. Diagram was constructed by superimposing facial tumour locations of 96 DFT1s. Raw data are available in S1 Data in https://doi.org/10.5281/zenodo.4046235. CNV, copy number variant; DFT1, devil facial tumour 1; km, kilometre; MRCA, most recent common ancestor; SNV, single nucleotide variant.
Fig 2
Fig 2. Copy number variation in DFT1.
(A) Distribution of diploid DFT1 CNV states and widths, measured in bp. Subclonal copy number states are labelled 1.5, 2.5, and 3.5, and represent subclonal states between the two closest integer states. CNVs occurring after a whole genome duplication event are excluded. Gain and loss CNVs with CN2, loss CNVs with CN >2, and gain CNVs with CN <2 represent back mutations. The CNV detection limit was 500 kb (dotted line). Data are available in S3 Table. (B) Representative DFT1 copy number plots. Each dot represents normalised read coverage within a 100-kb genomic window. Tumour identities are, top to bottom, 377T1 (clade E), 56T2 (clade C), 228T1 (clade A2), and 209T3 (clade A1). The diploid tumour, 228T1, has lost M5, whose CNVs are visible on chromosomes 2 and 5 (red arrows). A CNV encompassing major histocompatibility complex class I component B2M was acquired in the common ancestor of clades A, B, C, and D (blue arrows). Copy number plots for all tumours are available in S2 Data in https://doi.org/10.5281/zenodo.4046235. (C) Rate of DFT1 CNV acquisition. Each tumour is represented by a grey dot, and labels mark 1 January of the labelled year. Sets of CNVs cooccuring with the same copy number in the same samples are counted once. CNVs are called relative to the reference genome. Grey shading represents regression standard error, and upper and lower lines represent prediction intervals. We corrected for ploidy in tetraploid tumours, and cell lines are excluded. Data are available in S1 Table. (D) DFT1 CNV chromosome map. Grey bars represent chromosomes with scale on left in Mb. Blue and red bars represent copy number losses and gains, respectively. Each bar is an independent CNV occurrence, and CNVs shared between tumours via a common ancestor are illustrated once. Each CNV step away from CN2 is illustrated separately. Candidate driver genes within frequently amplified regions are annotated, and complete lists of genes within CNV intervals are found in S6 Table. CNVs associated with M5 are indicated. HMGA2 is not annotated in the reference genome, Devil7.1, but is inferred to be present in the labelled interval based on cross-species genome alignment. CNVs occurring exclusively in DFT1 cell lines are excluded. CNV data are available in S3 Table. (E) DFT1 CNVs are more clustered than expected by chance. Number and length of overlapping CNVs in observed data and in data derived from 2,000 simulations. CNV data are available in S3 Table. (F) Loss of small derived chromosome M5 in diploid and tetraploid DFT1s and across DFT1 clades. M5 was acquired in a DFT1 common ancestor and is composed of fragments of chromosomes 2, 5, and X; this chromosome has been repeatedly lost in the DFT1 lineage (cartoon). The Fisher exact tests compare the observed distribution of M5 losses to those expected by chance, with the latter calculated assuming equal opportunity for M5 loss across all M5–positive tumours, correcting for change in opportunity caused by tetraploidy. Data are available in S8 Table. (G) Frequency of CNV breakpoint reuse within 567 DFT1 biopsies (cell line breakpoints excluded). Ends of chromosomes, M5 CNVs, and instances of reuse within individual samples are excluded from count. Simulated data are derived from 2,000 neutral simulations. Data are available in S9 Table. (H) Number of CNVs in Tasmanian devil cancers of different histotypes. “Lymphoma” includes two unspecified cutaneous round cell tumours (S1 Table). CNVs exclusive to DFT1 cell lines are excluded. Number of CNVs is relative to the reference genome. Each tumour is plotted as a dot, and each non-DFT data point represents an independent clone except for the three dots representing tumours 106T1, 106T2, and 106T3, which are separate tumours belonging to a single non-DFT cancer. Data are available in S1 and S3 Tables. (I) Frequency of CNV breakpoint reuse across Tasmanian devil cancers. Number of reused breakpoints between pairs or trios of devil cancer groups are shown, with colours indicating the number of breakpoints within each category which are also reused within individual devil cancer cohorts. DFT1 cell line CNVs, ends of chromosomes, M5 CNVs, and reuse within individual samples are excluded from count. Simulated data are derived from 2,000 neutral simulations of datasets of the same size. Simulated data are coloured for breakpoint reuse within group using the same colour key as used for real data, as shown on the plot. None of the reused breakpoints were found in the genomes of normal devil tissues, including those of matched hosts (S1 Table). Non-DFT, spontaneously arising non-transmissible devil cancers that are neither DFT1 nor DFT2. Data are available in S9 Table. bp, base pair; CI, confidence interval; CN, copy number; CNV, copy number variant; CN2, copy number 2; DFT1, devil facial tumour 1; LogR, ratio of tumour to normal reads, log base 2; Mb, megabase; M5, marker 5.
Fig 3
Fig 3. Copy number variation in DFT1 cell lines.
(A) DFT1 phylogenetic tree with 43 cell lines (including some duplicates collected at different passages), and tissue biopsies from devils inoculated with cell lines, indicated. DFT1 clades are labelled. Higher resolution tree is available in S1 Fig, and underlying SNV and CNV data used to generate tree are available in S2 and S3 Tables, respectively. Sample information, including cell line status, is available in S1 Table. (B) Number of CNVs in DFT1 biopsies and cell lines. Data are available in S1 and S3 Tables. (C) M5 loss events in DFT1 biopsies and cell lines. Cell lines derived from tumour lineages lacking M5 are excluded. Data are available in S8 Table. (D) Chromosome map illustrating CNVs in DFT1 cell lines. Grey bars represent chromosomes. Blue and red bars represent copy number losses and gains, respectively, which were observed in DFT1 cell lines but not in DFT1 biopsies. Each bar is an independent CNV occurrence, and CNVs shared by multiple cell lines via a common ancestor are illustrated once. Each CNV step away from CN2 is illustrated separately, thus a CNV present at CN <1 or >3 is shown multiple times. The location of ERBB2 is marked, together with a window within which the rDNA occurs (exact coordinates are unknown). Data are available in S3 Table. (E) Representative genomic copy number plots for a DFT1 biopsy, cell line, and experimental inoculation of the same cell line into a devil. Each dot represents normalised read coverage within a 100-kb genomic window. Tumour identifiers are labelled in parentheses, all three samples belong to Clade A1-3A3 (S1 Table). Copy number plots for all tumours are available in S2 Data in https://doi.org/10.5281/zenodo.4046235. CN, copy number; CNV, copy number variant; DFT1, devil facial tumour 1; M5, marker 5; logR, ratio of tumour to normal reads, log base 2; rDNA, ribosomal DNA; SNV, single nucleotide variant.

Similar articles

  • The evolution of two transmissible cancers in Tasmanian devils.
    Stammnitz MR, Gori K, Kwon YM, Harry E, Martin FJ, Billis K, Cheng Y, Baez-Ortega A, Chow W, Comte S, Eggertsson H, Fox S, Hamede R, Jones M, Lazenby B, Peck S, Pye R, Quail MA, Swift K, Wang J, Wood J, Howe K, Stratton MR, Ning Z, Murchison EP. Stammnitz MR, et al. Science. 2023 Apr 21;380(6642):283-293. doi: 10.1126/science.abq6453. Epub 2023 Apr 20. Science. 2023. PMID: 37079675 Free PMC article.
  • Genome sequencing and analysis of the Tasmanian devil and its transmissible cancer.
    Murchison EP, Schulz-Trieglaff OB, Ning Z, Alexandrov LB, Bauer MJ, Fu B, Hims M, Ding Z, Ivakhno S, Stewart C, Ng BL, Wong W, Aken B, White S, Alsop A, Becq J, Bignell GR, Cheetham RK, Cheng W, Connor TR, Cox AJ, Feng ZP, Gu Y, Grocock RJ, Harris SR, Khrebtukova I, Kingsbury Z, Kowarsky M, Kreiss A, Luo S, Marshall J, McBride DJ, Murray L, Pearse AM, Raine K, Rasolonjatovo I, Shaw R, Tedder P, Tregidgo C, Vilella AJ, Wedge DC, Woods GM, Gormley N, Humphray S, Schroth G, Smith G, Hall K, Searle SM, Carter NP, Papenfuss AT, Futreal PA, Campbell PJ, Yang F, Bentley DR, Evers DJ, Stratton MR. Murchison EP, et al. Cell. 2012 Feb 17;148(4):780-91. doi: 10.1016/j.cell.2011.11.065. Cell. 2012. PMID: 22341448 Free PMC article.
  • Curse of the devil: molecular insights into the emergence of transmissible cancers in the Tasmanian devil (Sarcophilus harrisii).
    Patchett AL, Flies AS, Lyons AB, Woods GM. Patchett AL, et al. Cell Mol Life Sci. 2020 Jul;77(13):2507-2525. doi: 10.1007/s00018-019-03435-4. Epub 2020 Jan 3. Cell Mol Life Sci. 2020. PMID: 31900624 Free PMC article. Review.
  • ERBB3: A potential serum biomarker for early detection and therapeutic target for devil facial tumour 1 (DFT1).
    Hayes DA, Kunde DA, Taylor RL, Pyecroft SB, Sohal SS, Snow ET. Hayes DA, et al. PLoS One. 2017 Jun 7;12(6):e0177919. doi: 10.1371/journal.pone.0177919. eCollection 2017. PLoS One. 2017. PMID: 28591206 Free PMC article.
  • Devil Facial Tumours: Towards a Vaccine.
    Owen RS, Siddle HV. Owen RS, et al. Immunol Invest. 2019 Oct;48(7):719-736. doi: 10.1080/08820139.2019.1624770. Epub 2019 Jun 4. Immunol Invest. 2019. PMID: 31161832 Review.

Cited by

References

    1. Pearse AM, Swift K. Allograft theory: transmission of devil facial-tumour disease. Nature. 2006;439(7076):549 Epub 2006 Feb 3. 10.1038/439549a . - DOI - PubMed
    1. Loh R, Bergfeld J, Hayes D, O’Hara A, Pyecroft S, Raidal S, et al. The pathology of devil facial tumor disease (DFTD) in Tasmanian Devils (Sarcophilus harrisii). Vet Pathol. 2006;43(6):890–5. Epub 2006 Nov 14. 10.1354/vp.43-6-890 . - DOI - PubMed
    1. Hawkins CE, Baars C, Hesterman H, Hocking GJ, Jones ME, Lazenby B, et al. Emerging disease and population decline of an island endemic, the Tasmanian devil Sarcophilus harrisii. Biol Conserv. 2006;131(2):307–24. 10.1016/j.biocon.2006.04.010 WOS:000239069700014. - DOI
    1. Lazenby BT, Tobler MW, Brown WE, Hawkins CE, Hocking GJ, Hume F, et al. Density trends and demographic signals uncover the long-term impact of transmissible cancer in Tasmanian devils. J Appl Ecol. 2018;55(3):1368–79. Epub 2018 Aug 10. 10.1111/1365-2664.13088 - DOI - PMC - PubMed
    1. McCallum H, Jones M, Hawkins C, Hamede R, Lachish S, Sinn DL, et al. Transmission dynamics of Tasmanian devil facial tumor disease may lead to disease-induced extinction. Ecology. 2009;90(12):3379–92. Epub 2010 Feb 4. 10.1890/08-1763.1 . - DOI - PubMed

Publication types