. 2020 Dec 3;27(6):876-889.e12.
doi: 10.1016/j.stem.2020.11.009. Epub 2020 Nov 17.

Androgen Signaling Regulates SARS-CoV-2 Receptor Levels and Is Associated with Severe COVID-19 Symptoms in Men

Affiliations

Androgen Signaling Regulates SARS-CoV-2 Receptor Levels and Is Associated with Severe COVID-19 Symptoms in Men

Ryan M Samuel et al. Cell Stem Cell. .

Abstract

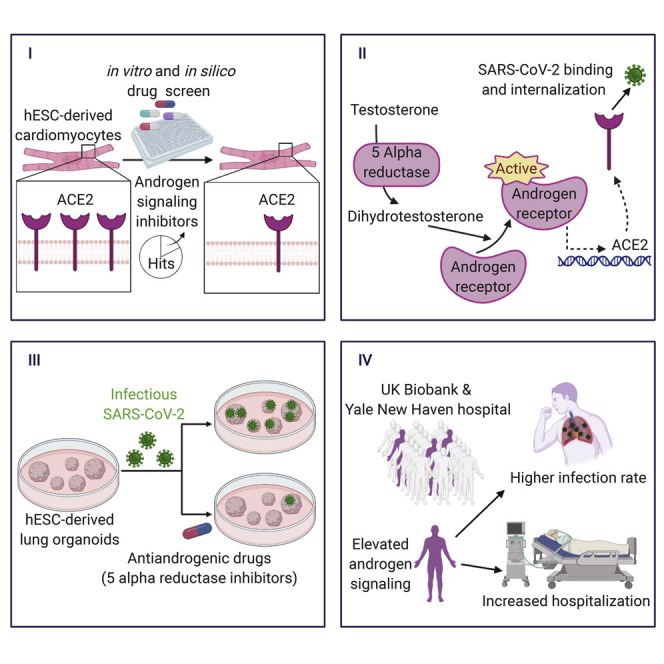
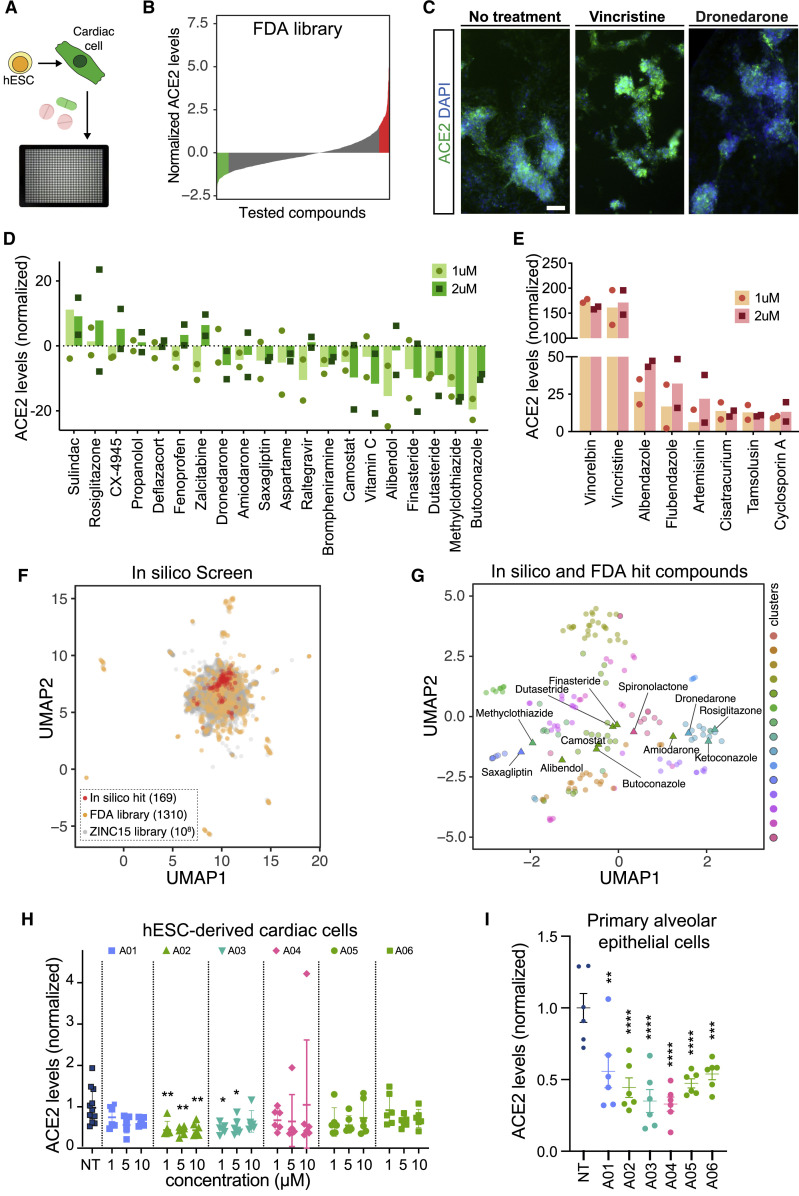
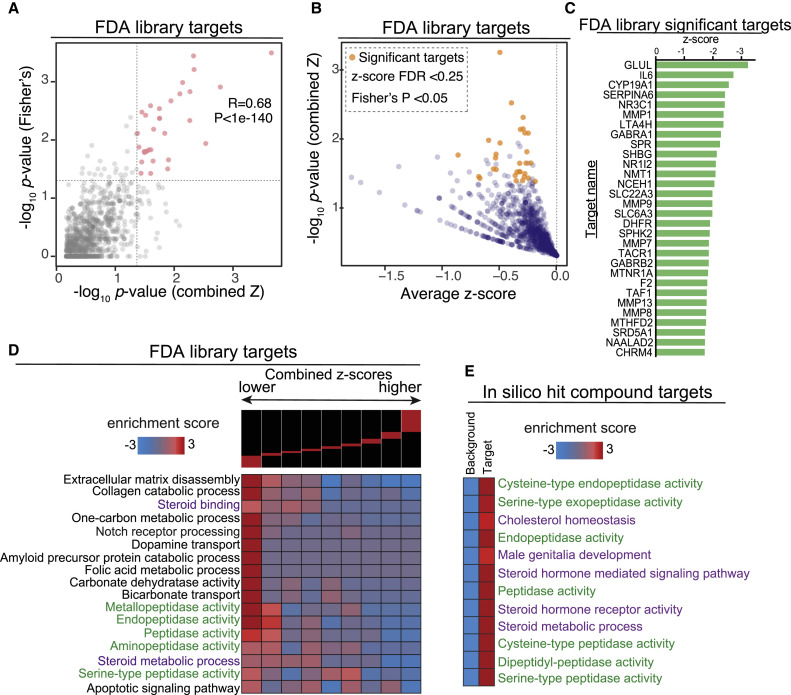
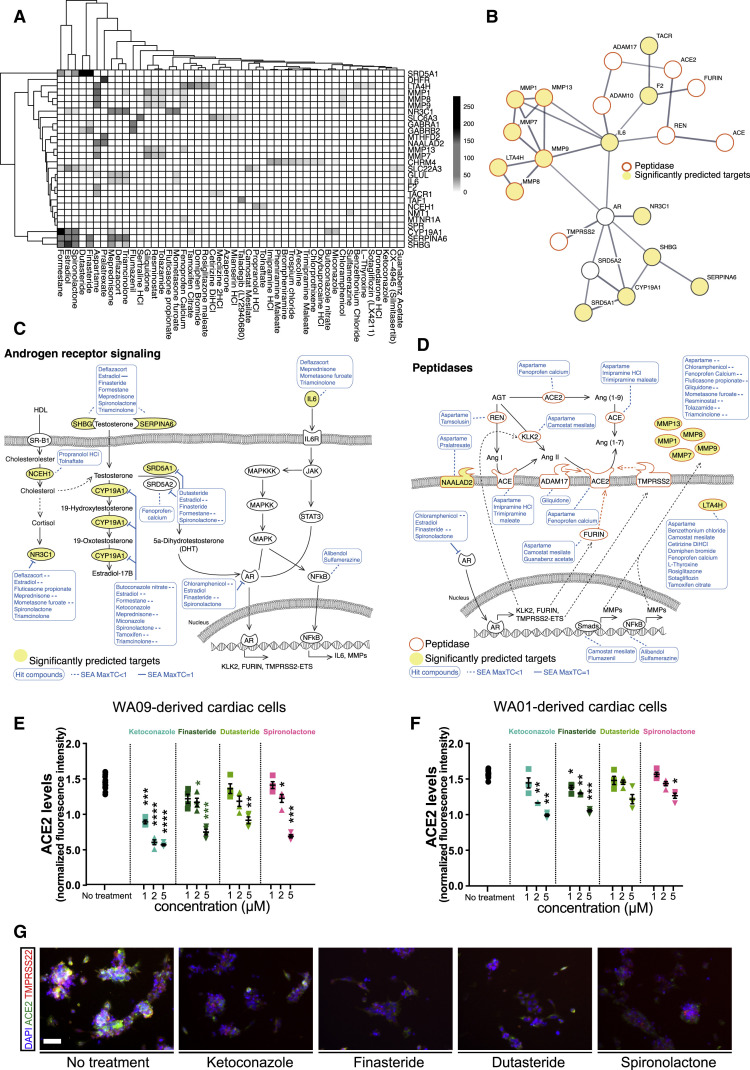
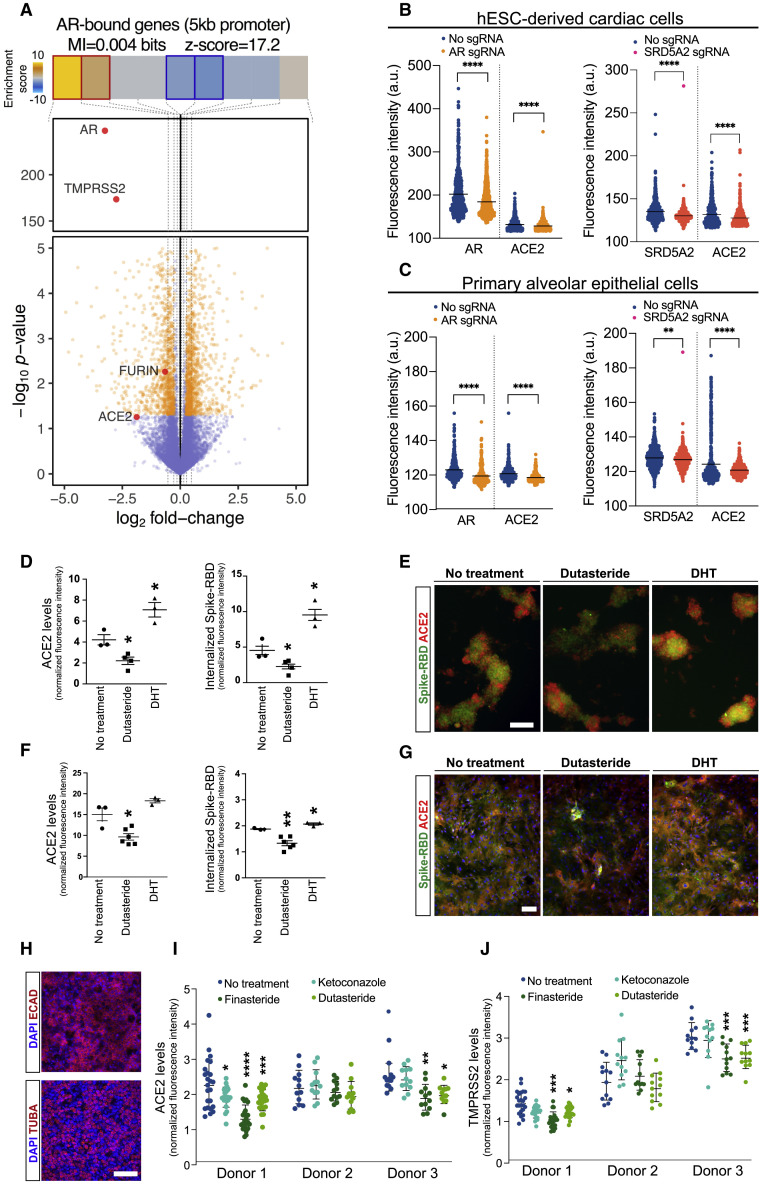
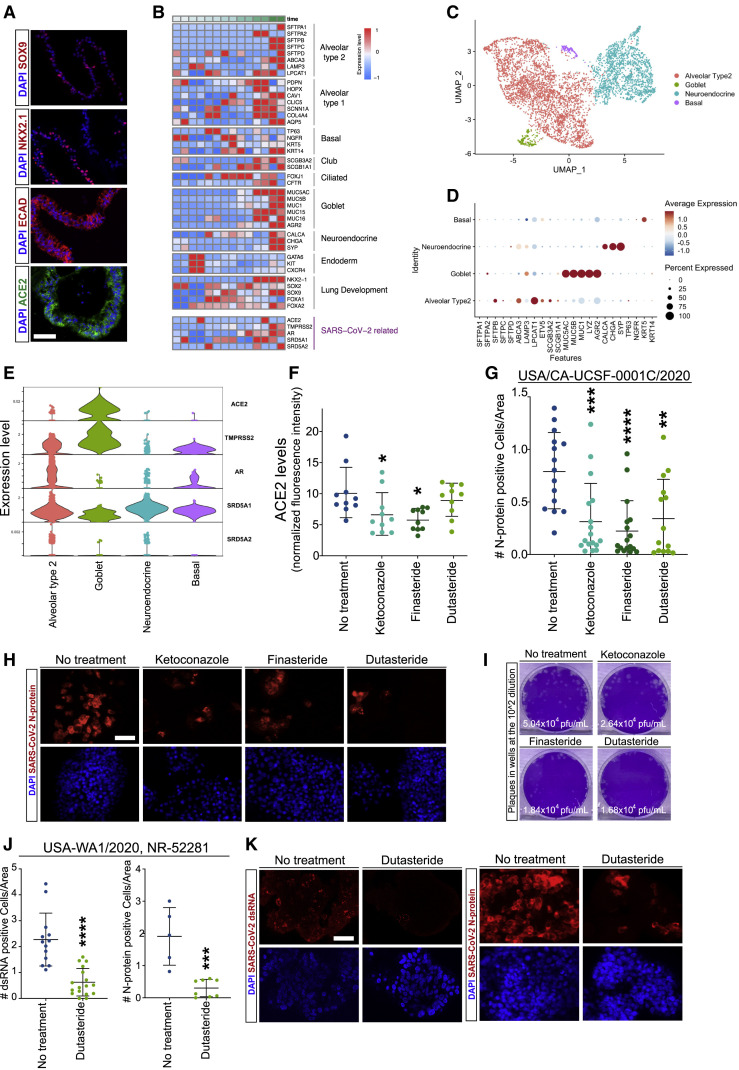
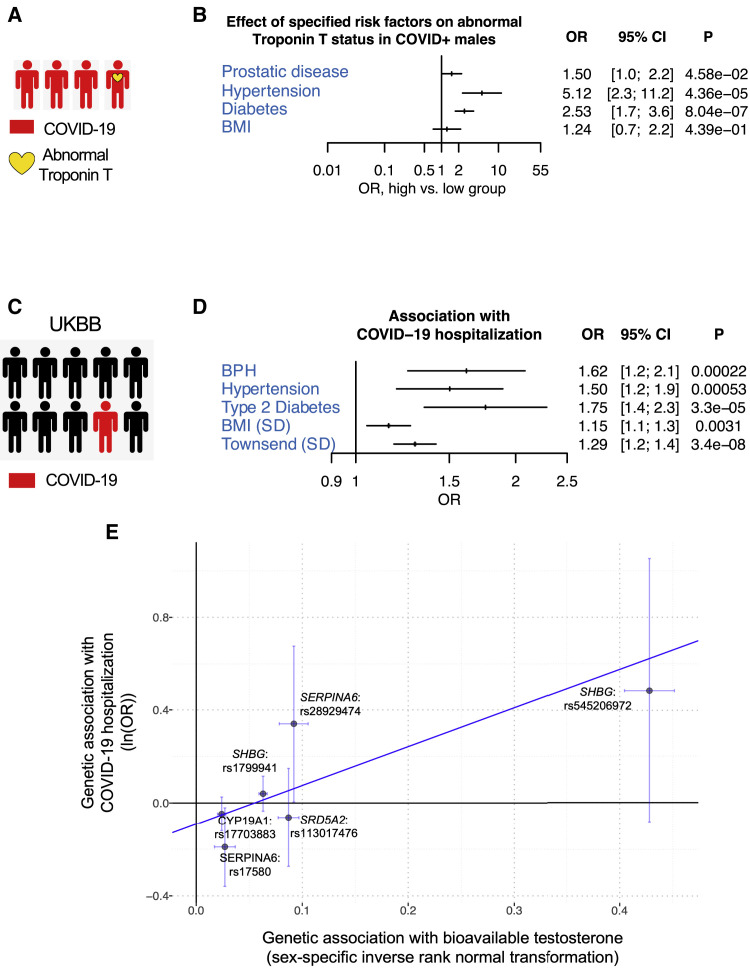
SARS-CoV-2 infection has led to a global health crisis, and yet our understanding of the disease and potential treatment options remains limited. The infection occurs through binding of the virus with angiotensin converting enzyme 2 (ACE2) on the cell membrane. Here, we established a screening strategy to identify drugs that reduce ACE2 levels in human embryonic stem cell (hESC)-derived cardiac cells and lung organoids. Target analysis of hit compounds revealed androgen signaling as a key modulator of ACE2 levels. Treatment with antiandrogenic drugs reduced ACE2 expression and protected hESC-derived lung organoids against SARS-CoV-2 infection. Finally, clinical data on COVID-19 patients demonstrated that prostate diseases, which are linked to elevated androgen, are significant risk factors and that genetic variants that increase androgen levels are associated with higher disease severity. These findings offer insights on the mechanism of disproportionate disease susceptibility in men and identify antiandrogenic drugs as candidate therapeutics for COVID-19.

Keywords: 5-alpha reductase inhibitors; ACE2 regulation; COVID-19 risk factors; COVID-19 sex bias; SARS-CoV-2 infection model; deep learning; drug re-purposing; hPSC-based disease modeling; high content screening; virtual drug screen.


Conflict of interest statement

Declaration of Interests P.N. receives grants from Apple, Amgen, and Boston Scientific, and personal fees from Apple and Blackstone Life Sciences, all outside the submitted work. F.F. receives grants from Takeda Pharmaceuticals on projects outside of the submitted work.

Figures

None
Graphical abstract
Figure 1
Figure 1
High-Throughput In Vitro and In Silico Screenings Identify Drugs that Modulate ACE2 Expression in hESC-Derived Cardiomyocytes (A and B) High-throughput screening of Selleckchem FDA-approved drug library identifies drugs that increase and decrease ACE2 expression in hESC-derived cardiomyocytes. (C) Representative immunofluorescent images of cells treated with vehicle, vincristine, and dronedarone at 1 μM. Scale bar: 200 μm. (D and E) Dose response of hits that (D) decreased and (E) increased ACE2 expression in hESC-derived cardiomyocytes culture. (F) Two-dimensional visualization of molecular features (Morgan fingerprints) for the in vitro and in silico tested compounds using UMAP. For the ZINC15 library, the points are sub-sampled by a factor of 103. (G) UMAP visualization of the in vitro (labeled) and in silico (unlabeled) hit compounds. Also shown are the K-means cluster memberships based on their Morgan fingerprints. (H) Dose response analysis of selected in silico hit compounds in hESC-derived cardiac cells. Data are represented as mean ± SEM. (I) Effect of selected in silico hit compounds on ACE2 expression in human primary alveolar epithelial cells. Data are represented as mean ± SEM. p value < 0.05, ∗∗p value < 0.01, ∗∗∗p value < 0.001. See also Figure S1 and Table S1.
Figure 2
Figure 2
Target Prediction Analysis Identified Shared Pathways among ACE2 Regulators (A) We employed two independent tests for identifying the genes that are most likely targeted by the effective treatments: (1) a combined z-score approach, where normalized z-scores from all the treatments associated with a gene are integrated, and (2) a Fisher’s exact test to assess the enrichment of a gene among those that are targets of treatments with negative z-scores. Here we have shown the correlation between the p values reported by these two independent approaches. (B) A one-sided volcano plot showing the average z-score versus −log of p value for all genes with negative z-scores. The genes that pass our statistical thresholds are marked in gold (combined z-score FDR < 0.25 and Fisher’s p value < 0.05). (C) The identified target genes along with their combined z-score, associated p value, and FDRs. Also included are the total number of compounds each gene is likely targeted by, and the number of those that result in lower ACE2 expression (z-score < 0). (D) Gene-set enrichment analysis using iPAGE for the target genes identified from FDA-approved library with negative z-score. Genes were ordered based on their combined z-score from left to right and divided into nine equally populated bins. The enrichment and depletion pattern of various gene-sets is then assessed across this spectrum using mutual information. Red boxes show enrichment and blue boxes show depletion. (E) Gene-set enrichment analysis for the in silico hits. Similar to (D), genes were grouped into those that are likely targeted by the identified compounds and those that are not (i.e., background). We then assessed the enrichment of each pre-compiled gene-set among the targets using iPAGE. See also Figure S2 and Table S2.
Figure 3
Figure 3
Androgen Signaling Regulates Peptidase Expression (A) The drug-gene interaction matrix for the 30 significantly enriched drug target genes from Figure 2C that are deemed functional in their respective analyses. Shading represents the significance of the predicted interaction. (B) STRING protein-protein interaction network was used to identify interactions between our list of significantly enriched genes from Figure 2C (depicted as significantly predicted targets and yellow circles), androgen signaling pathway components (AR and SRD5A2), and proteins implicated in ACE2 regulation (ACE, ADAM10, ADAM17, FURIN, REN, TMPRSS2). Minimum required interaction score was set to 0.7 corresponding to high confidence and edge thickness indicates the degree of data support. (C) SEA predicted drug-protein target interactions (blue lines and boxes) in the androgen signaling pathway. Yellow ovals represent significantly enriched genes from Figure 2C. Dashed lines represent MaxTC < 1. (D) The expression of ACE2-related peptidases is regulated by AR and other transcription factors that are targets of our candidate drugs. MaxTC, maximum tanimoto similarity between compounds from ref_target to compounds from query_target in [0,1] with 1 being identical up to the resolution of the fingerprint. (E and F) Dose response analysis of the effects of antiandrogenic drug candidates on ACE2 expression in cardiac cells generated from hECS lines WA09 (E) and WA01 (F). Data are represented as mean ± SEM. (G) Representative images of immunofluorescence staining for ACE2 and TMPRSS2 in hESC-derived cardiomyocytes treated with antiandrogenic drugs. Scale bar = 50 μm. p value < 0.05, ∗∗p value < 0.01, ∗∗∗p value < 0.001. See also Figure S3 and Table S3.
Figure 4
Figure 4
Androgen Receptor Signaling Modulates ACE2 and TMPRSS2 Levels in Heart and Lung Cells (A) Volcano plot visualizing gene expression changes in response to AR knockdown in LNCaP cells. Genes of interest are labeled and shown in red. Also shown are the enrichment and depletion pattern of AR target genes (i.e., genes with promoter AR binding) as a heatmap along with the mutual information value and its associated z-score. The log-fold change values were divided into equally populated bins and the enrichment of AR-bound genes in each bin was assessed using hypergeometric p values and colored accordingly (gold for enrichment and blue for depletion; red and blue borders mark bins that are statistically significant. (B and C) Effect of CRISPR-Cas9 ribonucleoproteins containing AR and SRD5A2 sgRNAs on ACE2 expression in hESC-derived cardiomyocyes and human primary alveolar epithelial cells. Dots represent fluorescence intensity values in individual cells. (D–G) Differential effect of dutasteride (potent inhibitor of testosterone to DHT conversion) and DHT on the membrane ACE2 levels and spike-RBD protein entry to cardiomyocytes (D and E) and alveolar epithelial cells (F and G) with their corresponding immunofluorescence images. (H) Immunofluorescence staining of bronchial epithelial cells isolated from human lung tissue for epithelial marker ECAD and ciliated cell marker TUBA. (I and J) Effect of antiandrogenic drug candidates on ACE2 expression in human primary bronchial epithelial cells isolated from three independent donors. Individual values represent normalized fluorescence intensity in independent imaging fields across different Transwell inserts. Scale bar = 100 μm in (E), (G), and (H). p value < 0.05, ∗∗p value < 0.01, ∗∗∗p value < 0.001. Data are represented as mean ± SEM. See also Figure S4.
Figure 5
Figure 5
Antiandrogenic Drugs Reduce ACE2 and SARS-CoV-2 Infection in hESC-Derived Lung Organoids (A) Immunofluorescence staining of hESC-derived lung organoids (HLOs) for epithelial lineage markers SOX9, NKX2.1, and ECAD and SARS-CoV-2 receptor ACE2. (B) Expression analysis of lineage-specific markers during HLO differentiation measured using bulk RNA sequencing at days 0, 5, 9, 15, 25, 35, and 50. (C) UMAP visualization of single-cell RNA sequencing data showing different epithelial cell clusters in differentiated HLOs. (D) Dot plot visualization of single-cell expression of epithelial subtype-specific lineage markers in different cell clusters. (E) Violin plot visualization of single-cell expression of SARS-CoV-2 receptors and androgen signaling genes in different lung epithelial cell clusters. (F) Effect of antiandrogenic drugs on ACE2 levels in HLOs. (G and H) Quantification (G) and representative images of immunofluorescence staining (H) of SARS-CoV-2 N-protein in HLOs treated with antiandrogenic drugs prior to infection with SARS-CoV-2 isolate USA/CA-UCSF-0001C/2020. (I) Plaque assay quantification of viral titers in supernatants of infected HLOs treated with antiandrogenic drugs. (J and K) Quantification (J) and representative images of immunofluorescence staining (K) of viral double-strand RNA (dsRNA) and SARS-CoV-2 N-protein in infected HLOs treated with dutasteride prior to infection with SARS-CoV-2 isolate USA-WA1/2020, NR-52281. Scale bar = 100 μm in (A) and 50 μm in (H) and (K). p value < 0.05, ∗∗p value < 0.01, ∗∗∗p value < 0.001. Data are represented as mean ± SEM. See also Figure S5.
Figure 6
Figure 6
Effects of Androgen Signaling on Outcomes Associated with COVID-19 (A) Schematic representation of the patients’ outcome analysis with COVID-19 at Yale New Haven Hospital. (B) The effects of BMI, prostatic disease, hypertension, and diabetes on the odds of having abnormal troponin T in male patients with COVID-19 in Yale patients. Troponin T and BMI were dichotomized during data collection. BMI, <30 versus ≥30; troponin T, normal (<0.01 ng/mL) versus abnormal (≥0.01 ng/mL). For the primary outcome, the odds ratio were calculated for the pre-specified subgroups. (C) Schematic representation of the outcome studied in the UK Biobank (UKBB) cohort. (D) Association of BPH with COVID-19 hospitalization, in multivariate logistic models adjusted for age, hypertension, type 2 diabetes, normalized BMI, Townsend deprivation index, and principal components of genetic ancestry. (E) Gene set enrichment analysis of androgen signaling genes on COVID-19 hospitalization using the COVID-19 host genetics initiative GWAS results. (F) Mendelian randomization between bioavailable testosterone and COVID-19 hospitalization. MR-Egger (visualized through the blue fitted line) was performed between 6 independent variants near the androgen signaling genes from the drug screen that are genome-wide significantly associated with bioavailable testosterone and their respective associations from the COVID-19 host genetics initiative release GWAS. OR = odds ratio, CI = confidence interval. See also Figure S6 and Table S4.

Update of

References

    1. Armstrong J., Rudkin J.K., Allen N., Crook D.W., Wilson D.J., Wyllie D.H., O’Connell A.-M. Dynamic linkage of COVID-19 test results between Public Health England’s Second Generation Surveillance System and UK Biobank. Microb. Genom. 2020;6:6. - PMC - PubMed
    1. Azevedo A., Cunha V., Teixeira A.L., Medeiros R. IL-6/IL-6R as a potential key signaling pathway in prostate cancer development. World J. Clin. Oncol. 2011;2:384–396. - PMC - PubMed
    1. Bonser L.R., Koh K.D., Johansson K., Choksi S.P., Cheng D., Liu L., Sun D.I., Zlock L.T., Eckalbar W.L., Finkbeiner W.E. Flow cytometric analysis and purification of airway epithelial cell subsets. bioRxiv. 2020 doi: 10.1101/2020.04.20.051383. - DOI - PMC - PubMed
    1. Bost P., Giladi A., Liu Y., Bendjelal Y., Xu G., David E., Blecher-Gonen R., Cohen M., Medaglia C., Li H. Host-viral infection maps reveal signatures of severe COVID-19 patients. Cell. 2020;181:1475–1488.e12. - PMC - PubMed
    1. Bowden J., Davey Smith G., Burgess S. Mendelian randomization with invalid instruments: effect estimation and bias detection through Egger regression. Int. J. Epidemiol. 2015;44:512–525. - PMC - PubMed

Publication types

MeSH terms