Review
. 2021 Feb 2;33(2):242-257.
doi: 10.1016/j.cmet.2020.10.026. Epub 2020 Nov 23.

The Power of Plasticity-Metabolic Regulation of Hepatic Stellate Cells

Affiliations
Review

The Power of Plasticity-Metabolic Regulation of Hepatic Stellate Cells

Parth Trivedi et al. Cell Metab. .

Abstract

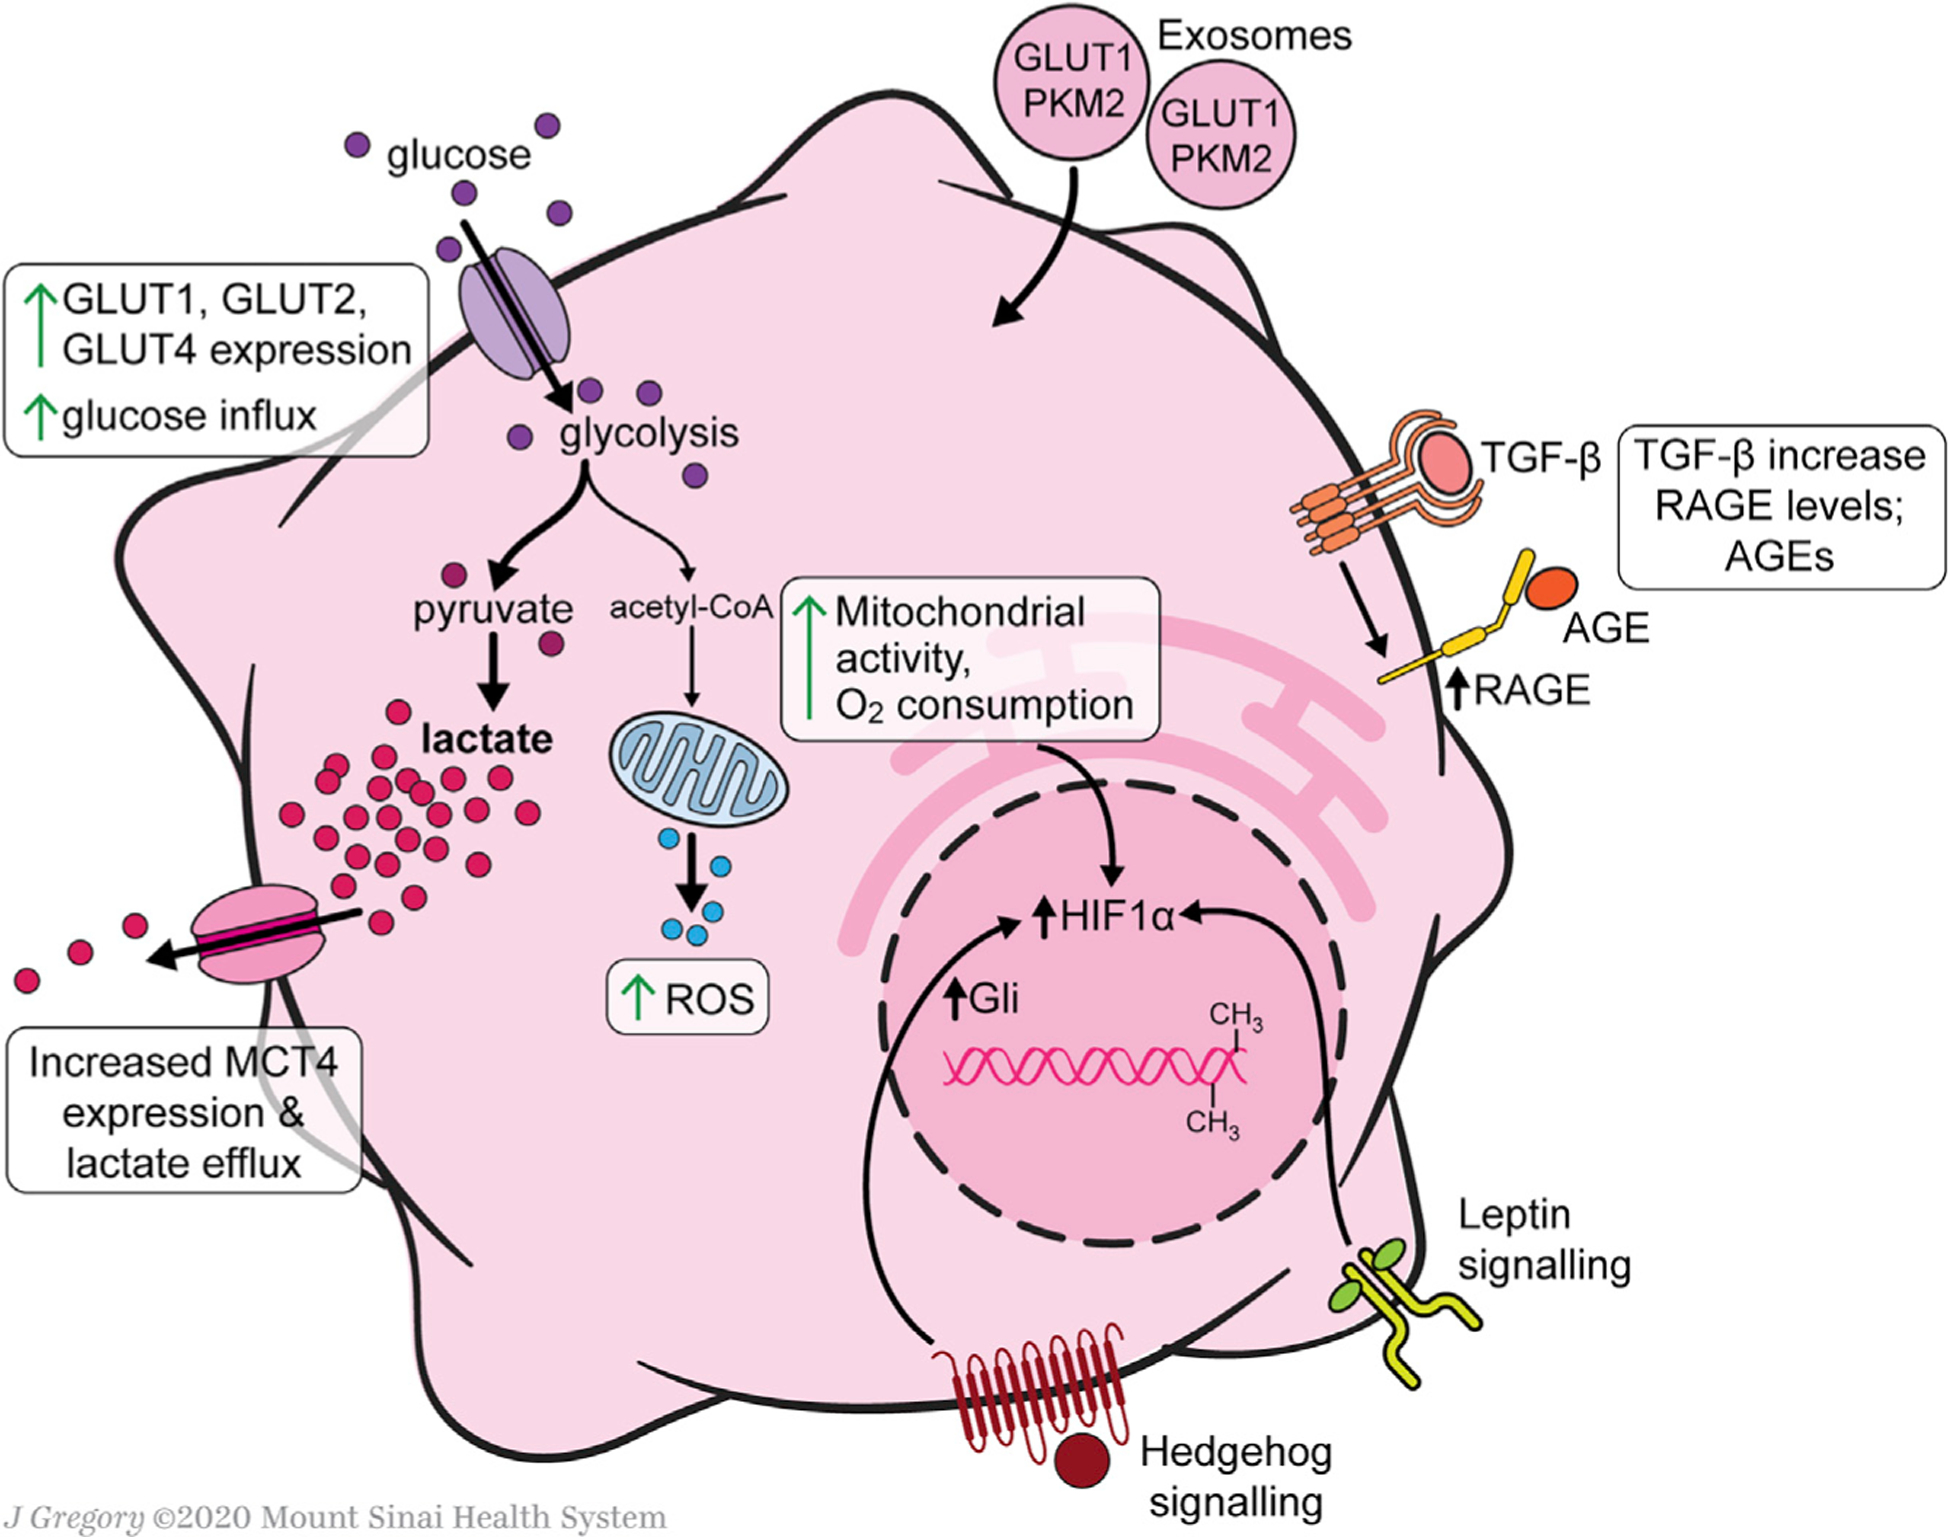
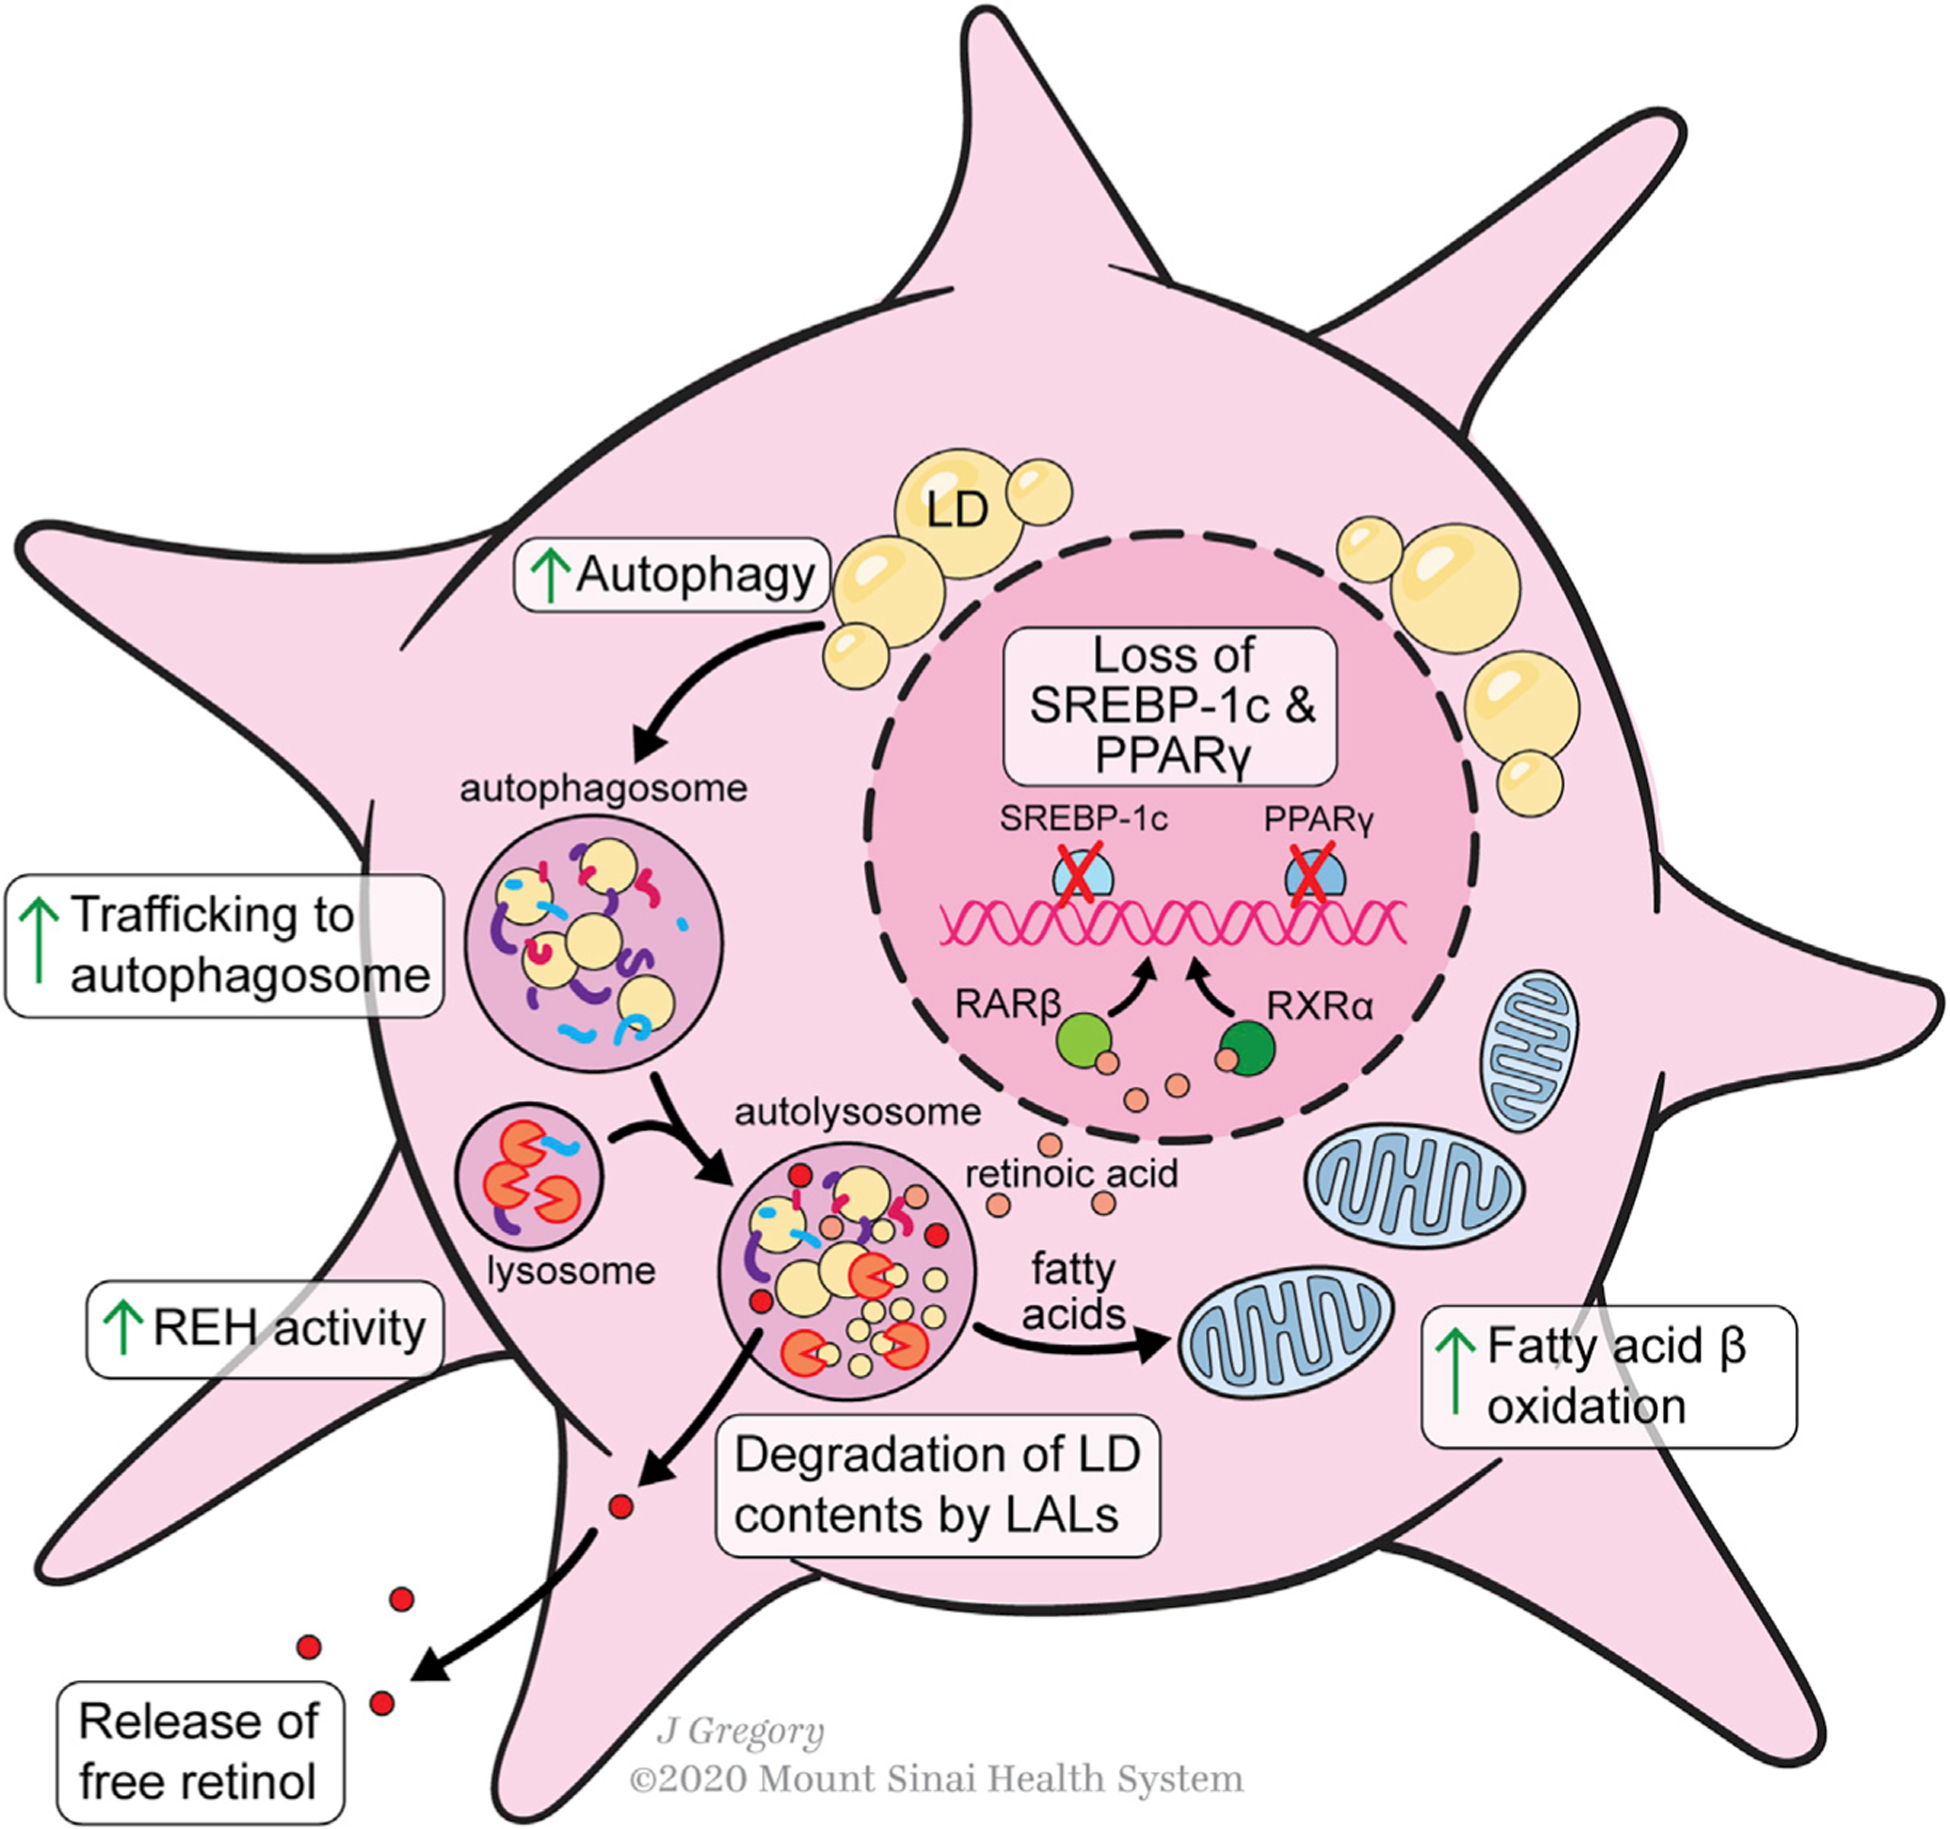
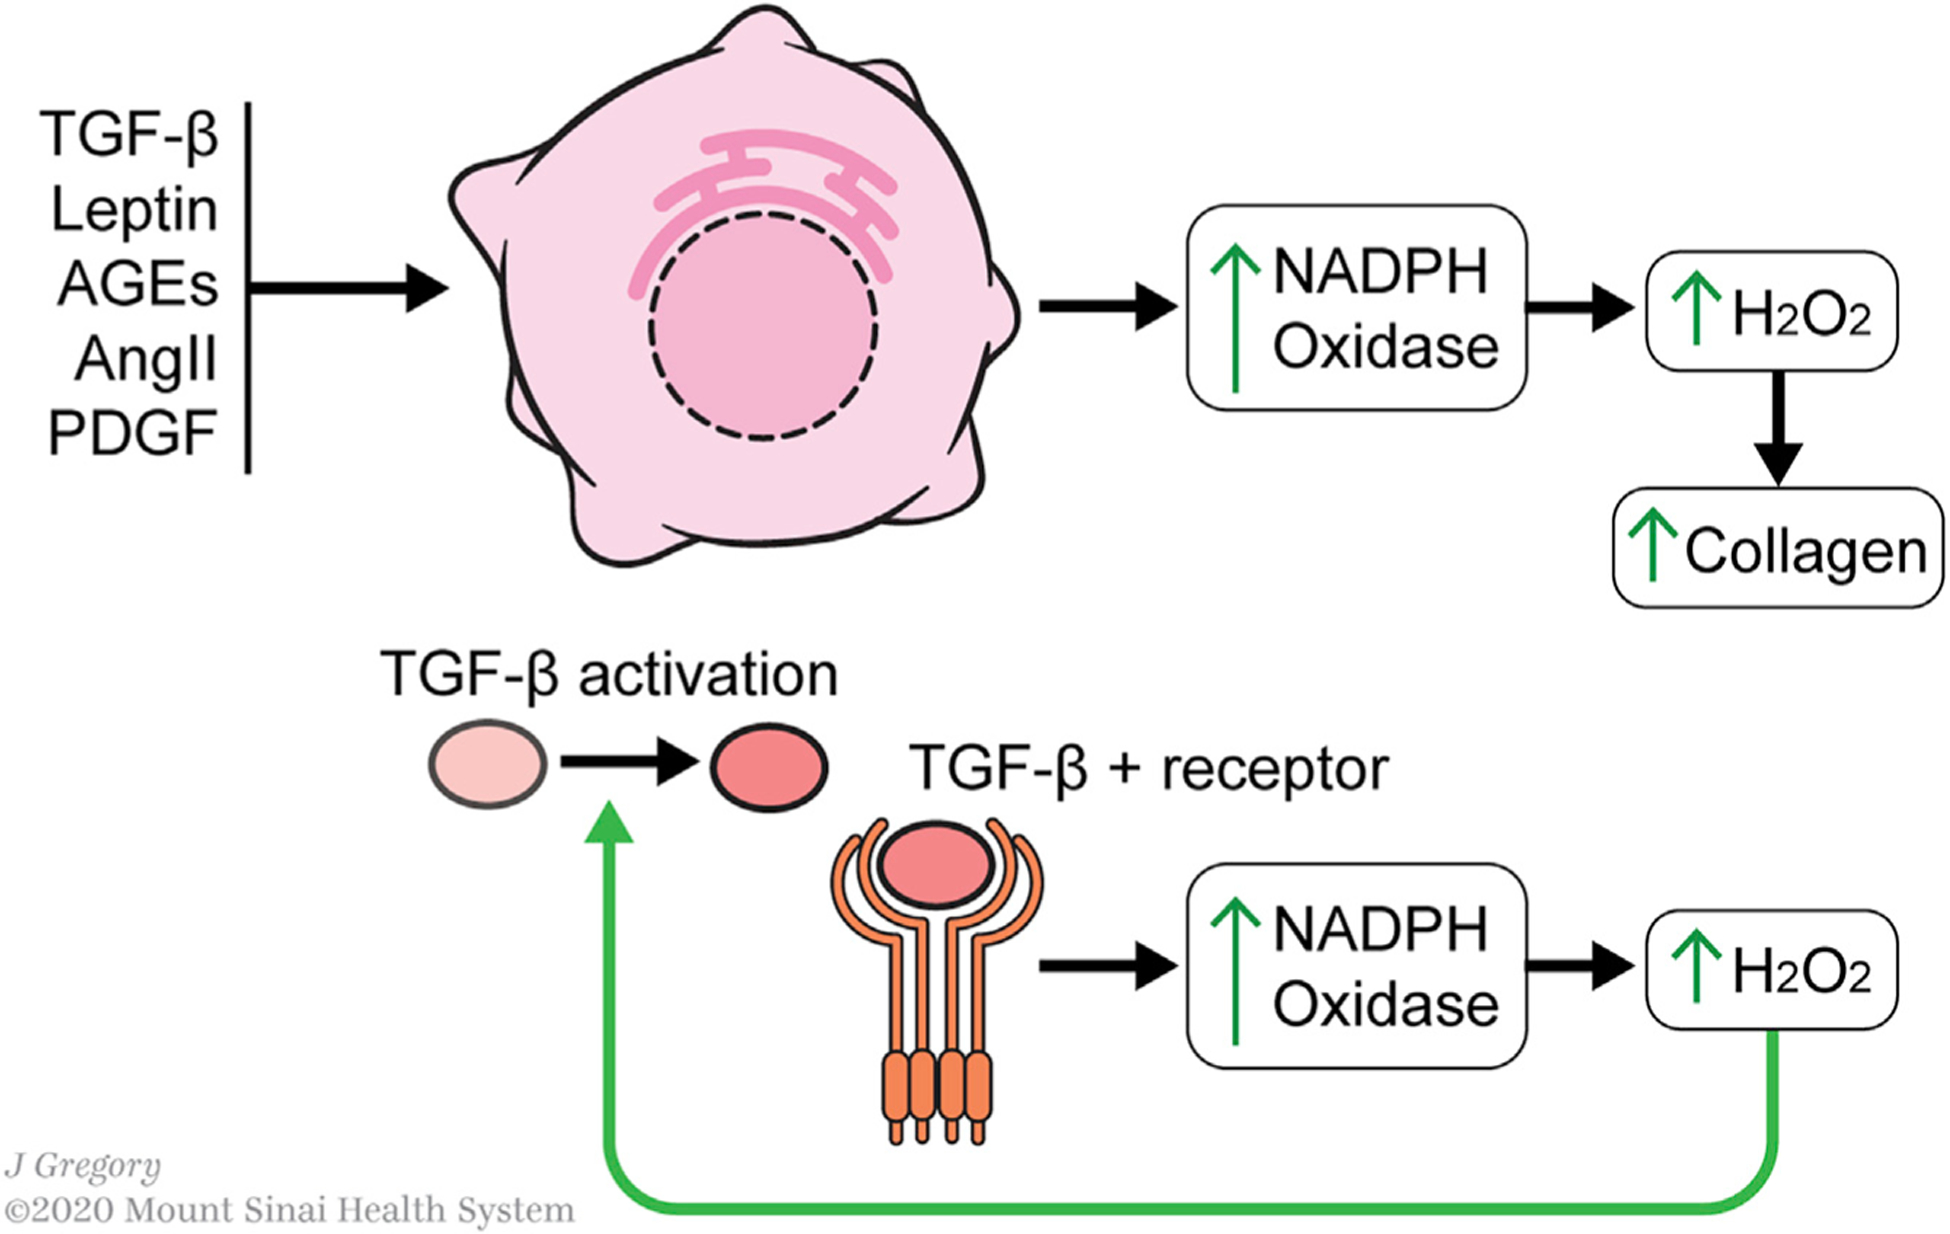
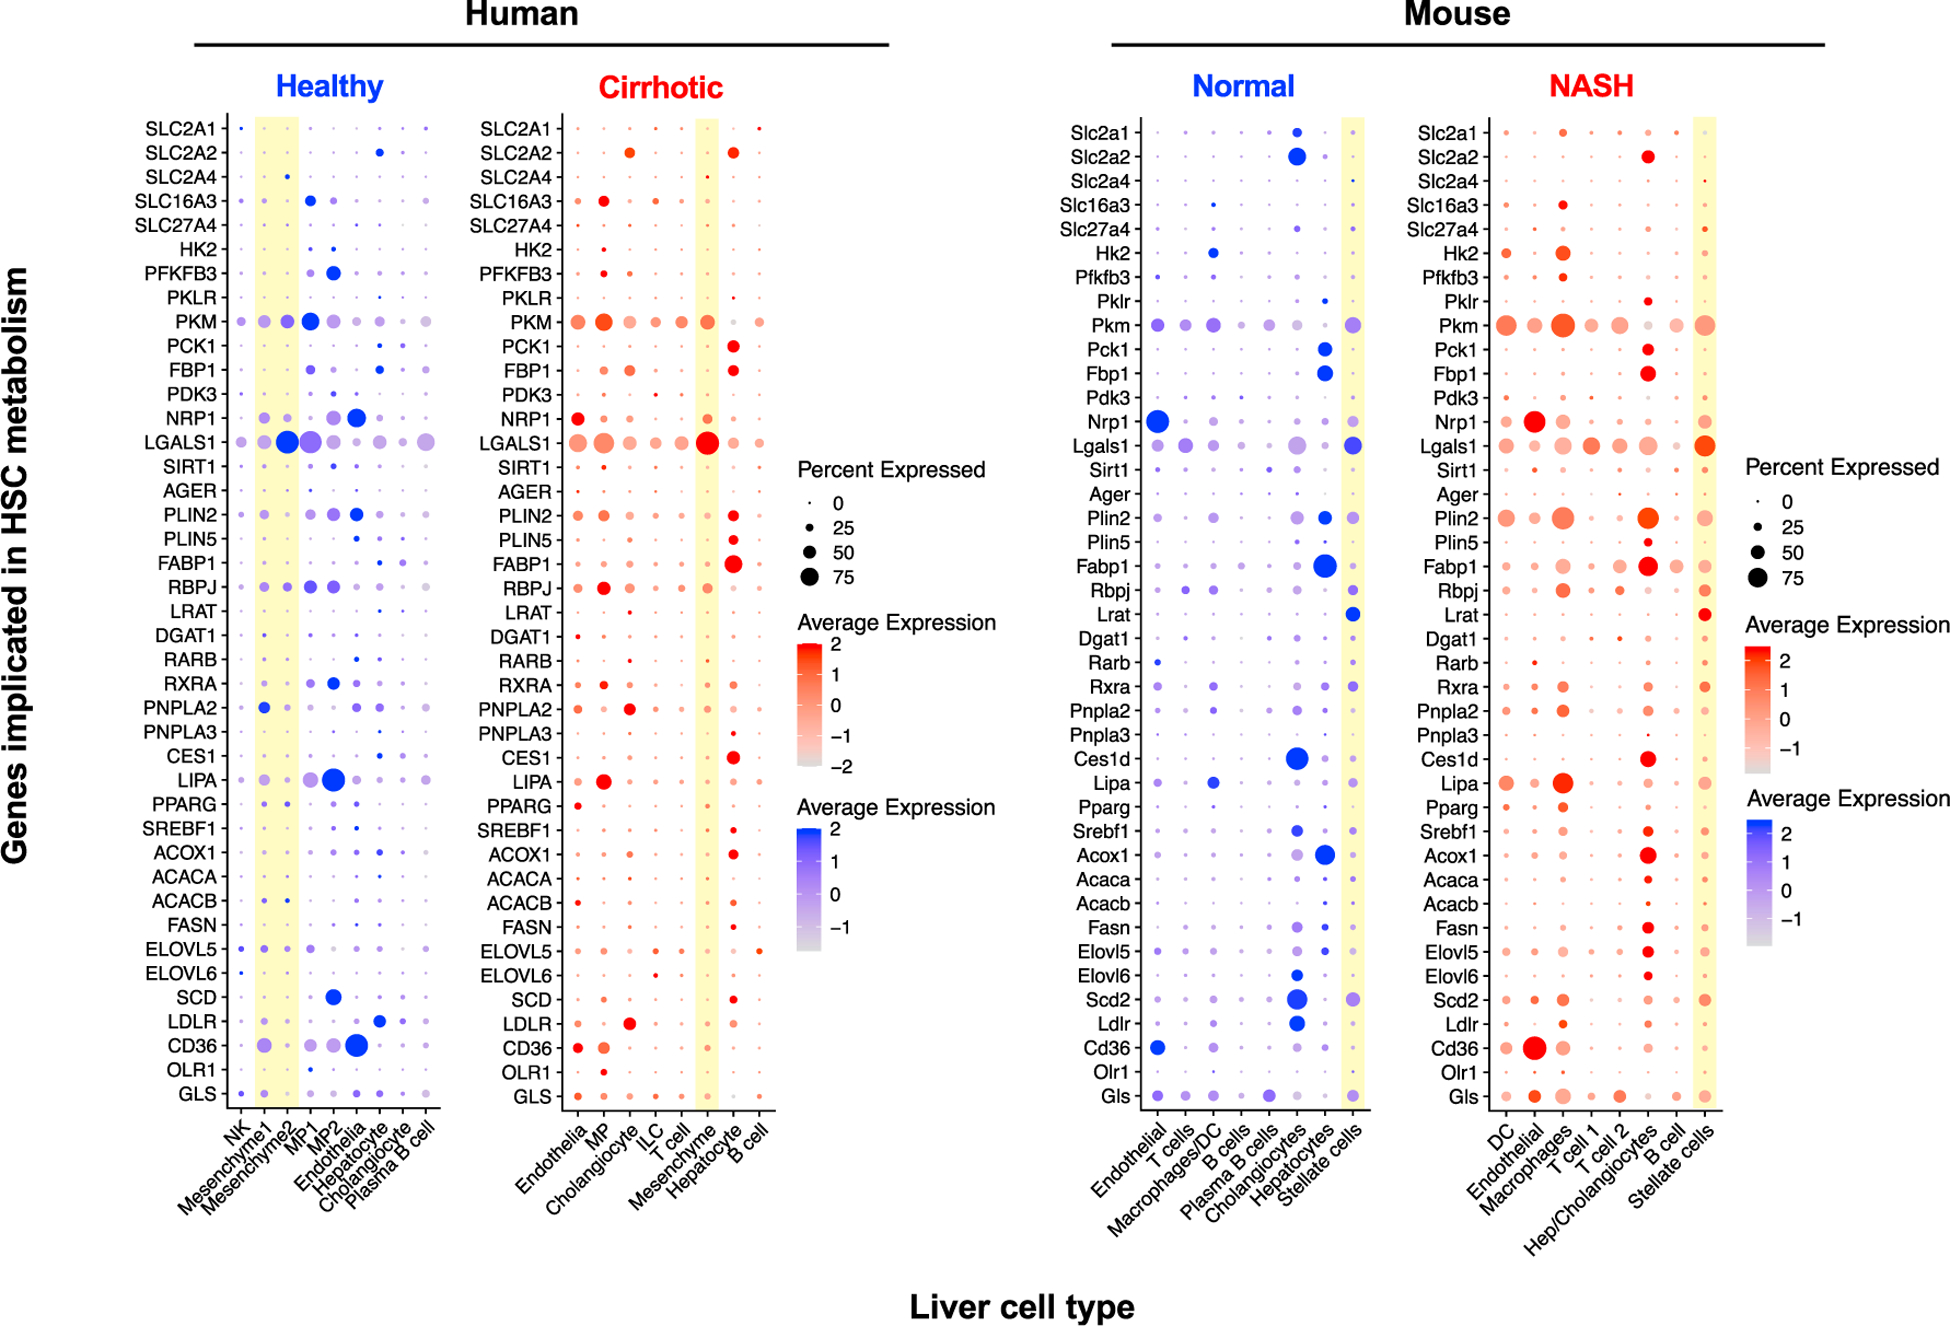
Hepatic stellate cells (HSCs) are resident non-parenchymal liver pericytes whose plasticity enables them to regulate a remarkable range of physiologic and pathologic responses. To support their functions in health and disease, HSCs engage pathways regulating carbohydrate, mitochondrial, lipid, and retinoid homeostasis. In chronic liver injury, HSCs drive hepatic fibrosis and are implicated in inflammation and cancer. To do so, the cells activate, or transdifferentiate, from a quiescent state into proliferative, motile myofibroblasts that secrete extracellular matrix, which demands rapid adaptation to meet a heightened energy need. Adaptations include reprogramming of central carbon metabolism, enhanced mitochondrial number and activity, endoplasmic reticulum stress, and liberation of free fatty acids through autophagy-dependent hydrolysis of retinyl esters that are stored in cytoplasmic droplets. As an archetype for pericytes in other tissues, recognition of the HSC's metabolic drivers and vulnerabilities offer the potential to target these pathways therapeutically to enhance parenchymal growth and modulate repair.


Figures

Figure 1.
Figure 1.. Features of HSC Activation and Resolution
Normally quiescent vitamin-A-rich pericytic cells, upon liver injury the cells initiate activation, rendering them responsive to many cytokines and soluble signals that trigger a full cellular transdifferentiation to myofibroblasts, whose features include enhanced proliferation, contractility, fibrogenesis, as well as altered matrix degradation properties, chemotaxis (directed migration), and the capacity to modify the inflammatory and immune milieu. Once injury resolves, the fate of these cells includes apoptosis, progressive senescence and/or deactivation to a more quiescent, intermediate cell phenotype. The relative distribution among these three fates during fibrosis resolution has not been determined, however.
Figure 2.
Figure 2.. Glucose and Mitochondrial Metabolism in Activated HSCs
Exosomes from aHSCs, which contain GLUT1 and pyruvate kinase muscle isozyme 2 (PKM2), induce activation of qHSCs. Overall glycolytic flux is increased in activated HSCs relative to quiescent HSCs. Glucose influx capacity increases through upregulation of the glucose transporters GLUT1, GLUT2, and GLUT4. The pyruvate byproduct of glycolysis is shunted primarily toward lactate production, which accumulates in the cells despite increased expression of the lactate transporter MCT4 and increased lactate efflux. Lactate accumulation is a contributor to HSC activation. Despite a preferential shunting toward lactate production, overall mitochondrial activity is increased when HSCs activate. Additionally, there is an increase in mitochondrial ROS production. Major pro-fibrotic signals that contribute to the reprogramming of glucose metabolism include Hh signaling through Gli and leptin, both of which converge upon the transcription factor HIF-1α, an inducer of glucose transporters and glycolytic enzymes. DNA methyltransferase and histone methyltransferases induce epigenetic modifications that shift HSC metabolism toward increased glycolysis. TGF-β signaling increases HSC expression of RAGE, thereby making activated HSCs sensitive to global glucose metabolism, as AGEs are a result of hyperglycemia.
Figure 3.
Figure 3.. Lipid Metabolism during HSC Activation
Lipid metabolism in activated HSCs is characterized by a loss of retinyl ester-containing cytoplasmic droplets. The transcription factors PPAR-γ and SREBP-1c, adipogenic master regulators, are markers of HSC quiescence that are downregulated during activation. Lipid droplets are trafficked to the autosome for degradation. Vitamin A de-esterification also occurs under the control of lysosomal acid lipase REH activity is also increased, liberating free retinol to the extracellular space. Lipid droplet contents from the autolysosome are further metabolized by the cell through increased fatty acid β-oxidation. Conversion of some intracellular retinol to retinoic acid promotes increased RARβ and RXRβ transcription.
Figure 4.
Figure 4.. Redox Metabolism in HSC Activation
Profibrotic stimuli (TGFb, leptin, AGEs, angiotensin II, and PDGF) converge upon a MAPK/ERK signaling pathway that leads to increased NADPH oxidase (NOX) expression. Increased NOX expression increases H2O2 levels, which facilitates the finding of the transcription factor C/EBPβ to its cognate element on the Col1α1 promoter, thereby increasing collagen expression. The increase in H2O2 levels is accompanied by an increased capacity of HSCs to handle oxidative stress, such as through increased glutathione and superoxide dismutase levels. Combined with responsiveness of collagen expression to H2O2, this points toward a signaling role for H2O2 in activated HSC, which is traditionally considered to be a marker of cell stress. Redox metabolism in HSCs also acts a feedforward mechanism for activation; TGF-β signaling increased H2O2 levels through induction of NOX expression, while TGF-β itself converted from its latent from to its active form in the presence of H2O2
Figure 5.
Figure 5.. Metabolism-Related Gene Expression by HSCs from Healthy and Diseased Liver Based on Published Single-Cell RNA Sequencing Studies
Human healthy and cirrhotic liver single-cell RNA sequencing datasets were extracted from Ramachandran et al. (2019) and from a study analyzing health and NASH mouse liver (Xiong et al., 2019). Data were processed using Seurat 3.0 (Butler et al., 2018; Stuart et al., 2019) using default parameters with cell clusters assigned using gene markers reported in the original publications. Mesenchymal cell clusters that likely represent HSCs are highlighted in yellow. “Percent Expression” refers to percentage of cells from each cell type that express the gene of interest. “NK,” natural killer cells; “MP,” mononuclear phagocytes; “ILC,” innate lymphoid cells; and “DC,” dendritic cells.

References

    1. Abraham S, Sweet T, Khalili K, Sawaya BE, and Amini S (2009). Evidence for activation of the TGF-beta1 promoter by C/EBPbeta and its modulation by Smads. J. Interferon Cytokine Res 29, 1–7. - PMC - PubMed
    1. Adachi T, Togashi H, Suzuki A, Kasai S, Ito J, Sugahara K, and Kawata S (2005). NAD(P)H oxidase plays a crucial role in PDGF-induced proliferation of hepatic stellate cells. Hepatology 41, 1272–1281. - PubMed
    1. Ajat M, Molenaar M, Brouwers JFHM, Vaandrager AB, Houweling M, and Helms JB (2017). Hepatic stellate cells retain the capacity to synthesize retinyl esters and to store neutral lipids in small lipid droplets in the absence of LRAT. Biochim. Biophys. Acta Mol. Cell Biol. Lipids 1862, 176–187. - PubMed
    1. Allenby G, Bocquel MT, Saunders M, Kazmer S, Speck J, Rosenberger M, Lovey A, Kastner P, Grippo JF, and Chambon P (1993). Retinoic acid receptors and retinoid X receptors: interactions with endogenous retinoic acids. Proc. Natl. Acad. Sci. USA 90, 30–34. - PMC - PubMed
    1. Amann T, and Hellerbrand C (2009). GLUT1 as a therapeutic target in hepatocellular carcinoma. Expert Opin. Ther. Targets 13, 1411–1427. - PubMed

Publication types

LinkOut - more resources