. 2021 Jan 7;184(1):184-193.e10.
doi: 10.1016/j.cell.2020.11.016. Epub 2020 Nov 14.

Cryo-EM Structure of an Extended SARS-CoV-2 Replication and Transcription Complex Reveals an Intermediate State in Cap Synthesis

Affiliations

Cryo-EM Structure of an Extended SARS-CoV-2 Replication and Transcription Complex Reveals an Intermediate State in Cap Synthesis

Liming Yan et al. Cell. .

Abstract

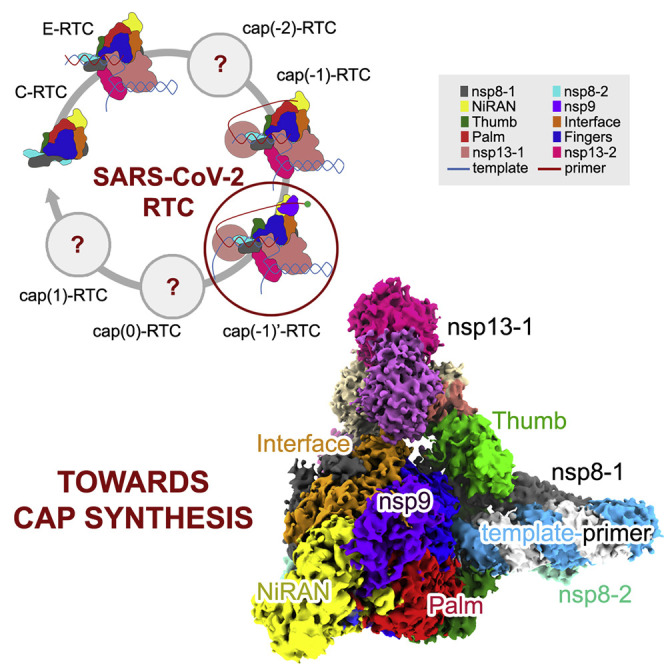
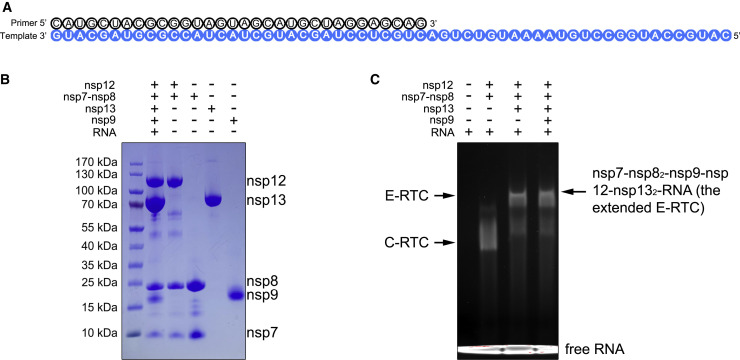
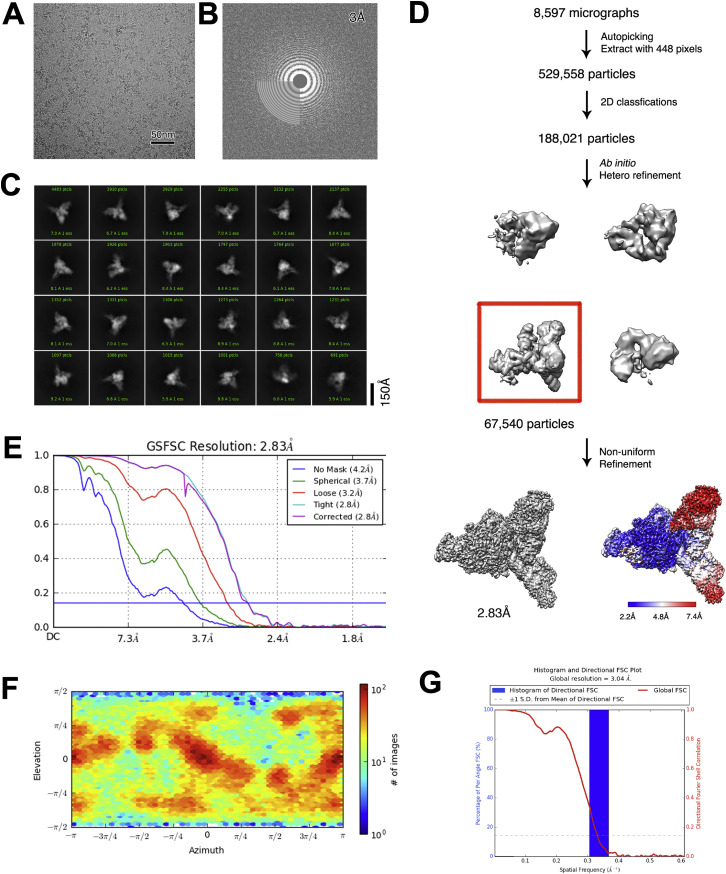
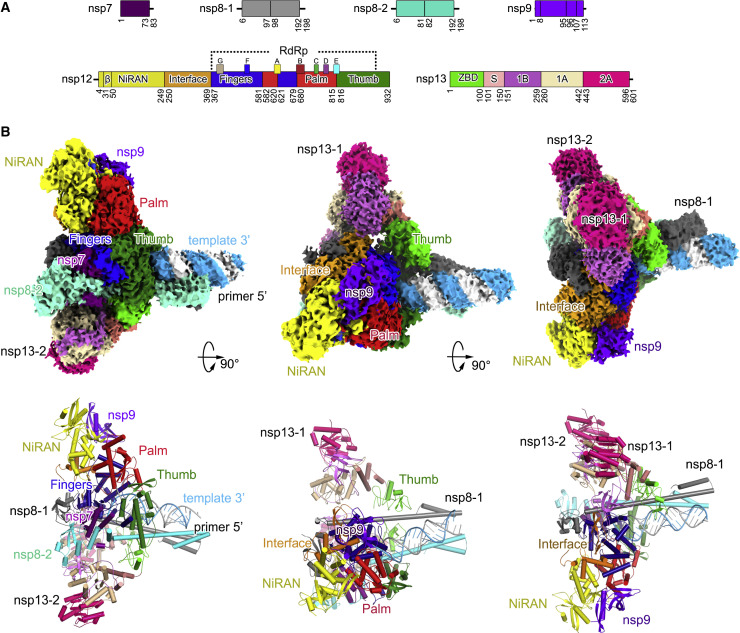
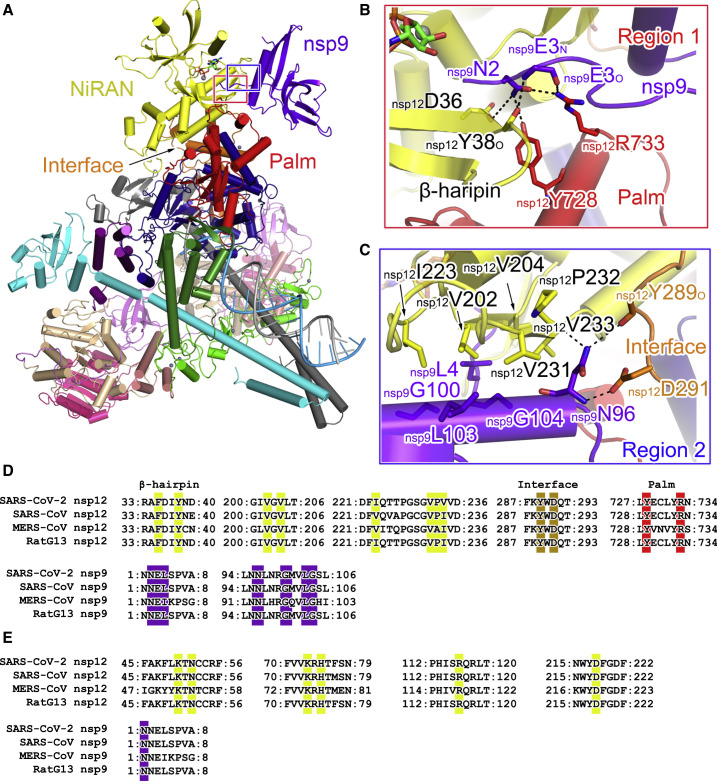
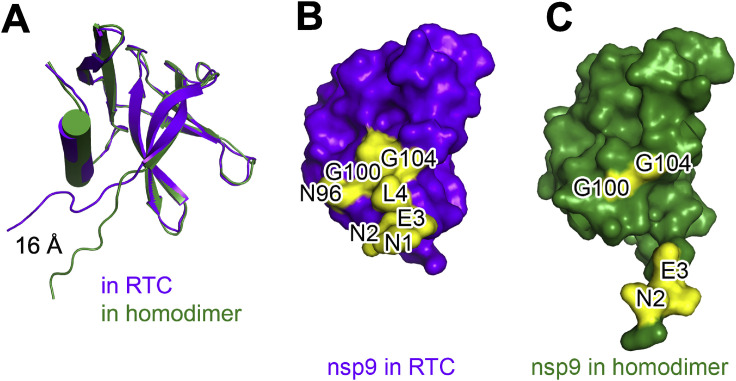
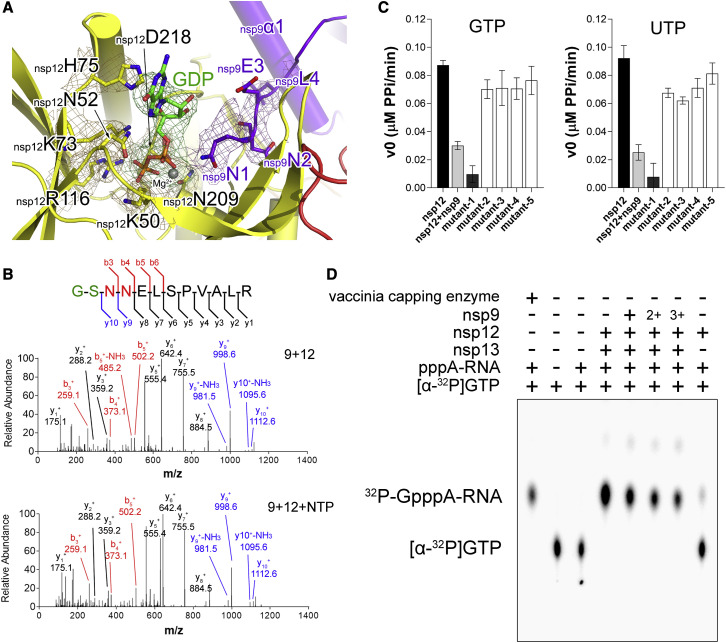
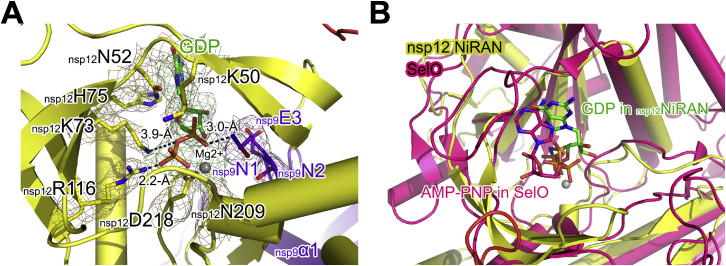
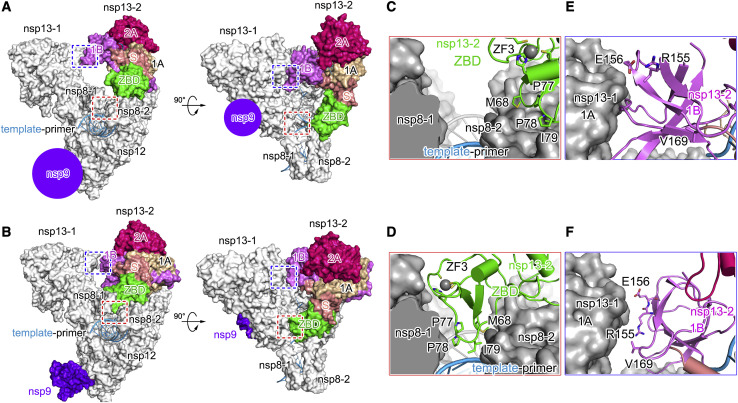
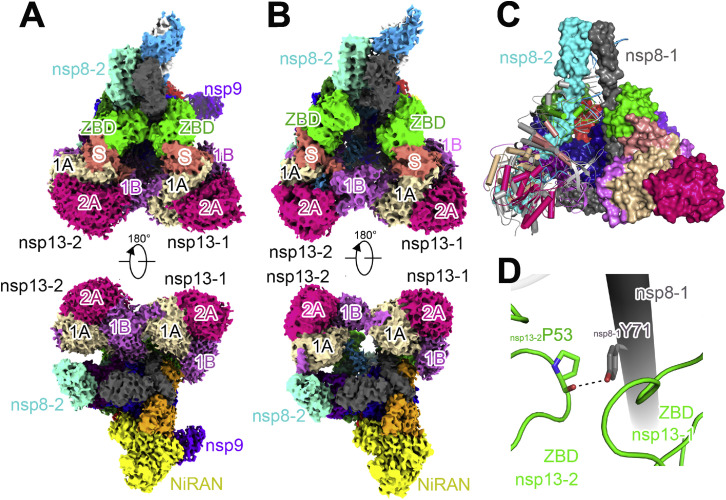
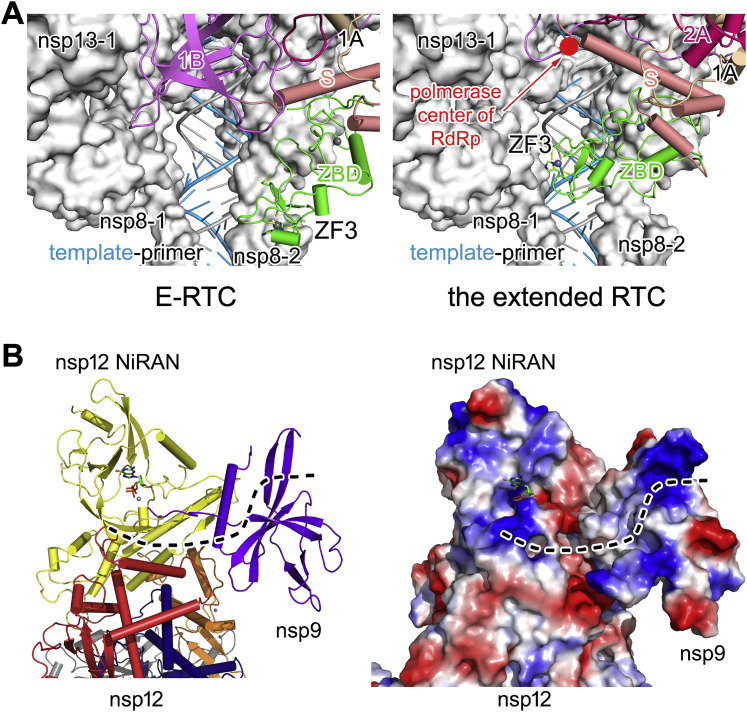
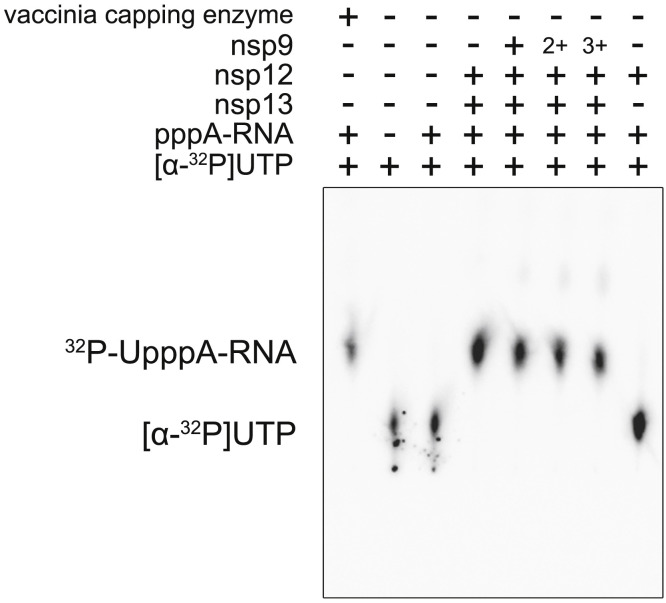
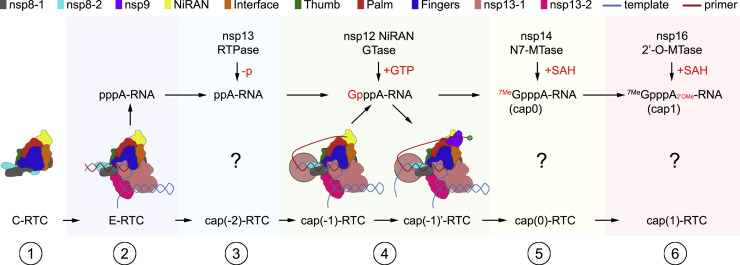
Transcription of SARS-CoV-2 mRNA requires sequential reactions facilitated by the replication and transcription complex (RTC). Here, we present a structural snapshot of SARS-CoV-2 RTC as it transitions toward cap structure synthesis. We determine the atomic cryo-EM structure of an extended RTC assembled by nsp7-nsp82-nsp12-nsp132-RNA and a single RNA-binding protein, nsp9. Nsp9 binds tightly to nsp12 (RdRp) NiRAN, allowing nsp9 N terminus inserting into the catalytic center of nsp12 NiRAN, which then inhibits activity. We also show that nsp12 NiRAN possesses guanylyltransferase activity, catalyzing the formation of cap core structure (GpppA). The orientation of nsp13 that anchors the 5' extension of template RNA shows a remarkable conformational shift, resulting in zinc finger 3 of its ZBD inserting into a minor groove of paired template-primer RNA. These results reason an intermediate state of RTC toward mRNA synthesis, pave a way to understand the RTC architecture, and provide a target for antiviral development.

Keywords: SARS-CoV-2; cap; cryo-EM; mRNA synthesis; nsp9; replication and transcription complex.


Conflict of interest statement

Declaration of Interests The authors declare no competing interests.

Figures

None
Graphical abstract
Figure 1
Figure 1
Purification of the SARS-CoV-2 Nsp7-Nsp82-Nsp9-Nsp12-Nsp132-RNA Complex (A) The scaffold of RNA used in the structural study. (B) SDS-PAGE analysis of the complex and individual components. Lane 1, marker; lane 2, nsp12-nsp7-nsp8-nsp13-nsp9 and RNA complex; lane 3, the nsp12-7-8 complex purified by mono Q 5/50 ion-exchange chromatography; lane 4, the nsp7-8 complex; lane 5, nsp13; lane 6, nsp9. The 10% SDS-PAGE gel was stained with Coomassie blue. (C) Native gel electrophoretic mobility shift assay reveals the formation of the complex. The 6% polyacrylamide gel was visualized with ethidium bromide to stain the RNA.
Figure S1
Figure S1
Cryo-EM Reconstruction, Related to Figure 2 (A) Raw image of SARS-CoV-2 cap(−1) RTC particles in vitreous ice recorded at defocus values from −1.0 to −1.8 μm. Scale bar, 50 nm. (B) Power spectrum of the image shown in (A), with plot of the rotationally averaged intensity versus resolution. White circle indicates the spatial frequency corresponding to 3.0 Å resolution. (C) Representative class averages. The edge of each square is ∼367 Å. (D) Flowchart of SARS-CoV-2 cap(−1) RTC reconstruction. Local resolution estimation is shown at the bottom panel. (E) Fourier shell correlation (FSC) of the final 3D reconstruction following gold standard refinement. FSC curves are plotted before and after masking. (F) Angular distribution heatmap of particles used for the refinement. (G) The 3DFSC sphericity analyzed with 3DFSC in cryoSPARC (Punjani et al., 2017).
Figure 2
Figure 2
Architecture of the Extended E-RTC (A) Domain organization of each component in the extended E-RTC. The color scheme for nsp7, nsp8, nsp12, and nsp13 is generally the same as that used in our previous work (Gao et al., 2020) with modifications. Nsp7, deep purple; nsp8-1, gray; nsp8-2, green cyan; nsp9, magenta; nsp12 NiRAN, yellow; nsp12 Interface, orange; nsp12 Fingers, blue; nsp12 Palm, red; nsp12 Thumb, green; nsp13 ZBD, light green; nsp13 S, light salmon; nsp13 1B, light magenta; nsp13 1A, sand; nsp13 2A, red pink. (B) Cryo-EM densities (upper panels) and cartoon representations (lower panels) of the extended E-RTC shown in three perpendicular views.
Figure 3
Figure 3
Interface between the Nsp9 and Nsp12 Protomers (A–C) Two regions at the nsp9-nsp12 interface are highlighted by red (A) and blue frames and are enlarged in (B) and (C). The extended E-RTC is shown as a cartoon diagram with the color scheme the same as in Figure 1. Key residues at the nsp9-nsp12 interface are shown as colored sticks. The dashed lines indicated the bonds with the distance less than 3.5 Å. (D and E) Sequence alignments of the key regions at the nsp9-nsp12 interface (D), GDP binding (E) (related to Figure 4). The key contact residues are highlighted by colored backgrounds with the same color as the domain or protein where they are located.
Figure S2
Figure S2
Comparison of Nsp9 in RTC and in a Crystal Structure, Related to Figure 3 (A) The structures of SARS-CoV-2 nsp9 in RTC (purple) and in a crystal structure (PDB: 6W9Q) (Littler et al., 2020) (green) aligned. (B and C) Surface representation of the structure of nsp9 in RTC (B) and (C) the crystal structure of nsp9. The key interacting residues of nsp9 with nsp12 in RTC or the inter-protomer interaction sites in the dimeric crystal structure are highlighted in yellow and with labels.
Figure 4
Figure 4
Nsp9 Inhibits Nsp12 GTase Activity (A) Structure of nsp9 N terminus inserting into the catalytic center of nsp12 NiRAN. The polypeptides of nsp9 and nsp12 are shown as cartoon diagrams with the same color scheme in Figure 2. A GDP bound at the catalytic center of nsp12 NiRAN is shown as colored sticks (C, green; O, red; N, blue; P, gold). Key residues are represented as colored sticks with labels. The magnesium ion is shown as a gray sphere. The cryo-EM density for the bound GDP and key residues are shown in mesh. The sequence comparison of these key residues with other CoVs is shown in Figure 3E. (B) MS/MS (tandem mass spectrometry) spectrum of a peptide ion of nsp9 incubated with nsp12 in the absence or presence of NTP. The concentration of nsp9 is 1 mg/mL. For the reaction, 1 mg/mL nsp9 was incubated with 10 mg/mL nsp12 and 2 mM NTP for 30 min at 25°C. The proteins were excised from SDS-PAGE stained with Coomassie blue. Gel samples were reduced and alkylated using DTT and iodoacetamide, respectively. Samples were digested by Asp-N overnight at 37°C and de-salted using solid phase extraction (SPE) prior to mass spectrometry analysis. The peptide sequence is shown on top with the Asp-N digestion-induced fragmentation pattern. The b and y ions are shown in red and blue/black, respectively. Two residues from the expression vector are colored in green. (C) Nucleotidylation activities of WT nsp12 alone, WT nsp12 incubated with WT nsp9, nsp12 with the nsp12K73A mutant (mutant-1), nsp9Δ5 (mutant-2), nsp9N96A (mutant-3), nsp9G100E (mutant-4), and nsp9G104E (mutant-5). The results were shown as the mean ± SD from three independent experiments. (D) Results of GTase activity assays. The components used in each lane are labeled. In lanes 5–7, nsp12 is incubated with nsp9 in molar ratio of 1:2 (denoted as +), 1:4 (denoted as 2+), and 1:6 (denoted as 3+). The integrated densities of the bands in lanes 4–7 corresponding to apo-nsp12, plus nsp9, plus 2+ nsp9, and plus 3+ nsp9, 27,887, 16,412, 12,563, and 10,614, respectively were calculated using ImageJ Fiji software (Schindelin et al., 2012). The result is a representative of three independent experiments.
Figure S3
Figure S3
Structural Detail of the Nsp9 N Terminus Inserting into the Catalytic Center of Nsp12 NiRAN and the Comparison of Nsp12 NiRAN with SelO, Related to Figure 4 (A) A perpendicular view of Figure 4A. The dashed lines show the interaction with labeled distances. (B) The aligned structures of SARS-CoV-2 nsp12 (yellow) and SelO (PDB: 6EAC) (magenta). GDP and AMP-PNP bound to nsp12 NiRAN and SelO, respectively are shown as colored sticks.
Figure 5
Figure 5
Conformational Changes in Nsp13-2 upon Nsp9 Binding (A and B) Structures of E-RTC (A) and the extended E-RTC (B) are aligned with the guidance of nsp7-nsp8-nsp12 and are shown in the same two perpendicular views. In each panel, nsp13-2 and nsp9 are colored as in Figure 1. Other components in RTC have white molecular surfaces. Two purple circles indicate the position for nsp9 binding. Two regions with conformational changes are framed and are enlarged in (C–F). (C and D) Conformational changes for nsp13-2 ZBD ZF3 in E-RTC (C) and in the extended E-RTC (D). (E and F) Conformational changes for nsp13-2 1B domain in E-RTC (E) and in the extended E-RTC (F).
Figure S4
Figure S4
Orientation Differences of Nsp13-2 in Extended E-RTC and E-RTC, Related to Figure 5 (A and B) Structure of the extended E-RTC (A) and E-RTC (B) aligned to the extended E-RTC and in the same two perpendicular views. (C) Comparison of the extended E-RTC and E-RTC. The structural regions with high similarity in two RTCs, including nsp7-nsp8-nsp12-RNA and nsp13-1, are shown as a molecular surface with the same color scheme in Figure 2. Nsp13-2 in the two RTCs are displayed as colored cartoons. (D) The interaction of nsp8-1Y71 with nsp13-2 ZBD in the extended E-RTC. The dashed line represents a potential hydrogen bond.
Figure S5
Figure S5
The Conformational Difference of Nsp13-2 ZBD ZF3 and a Potential RNA-Binding Groove at the Nsp9-Nsp12 Interface, Related to Figures 5C, 5D, and 6 (A) nsp13-2 ZBD ZF3 conformational changes between in E-RTC compared to the extended E-RTC. The view is perpendicular to Figures 5C and 5D. (B) A potential RNA binding groove. Nsp9 and nsp12 are displayed as colored cartoons in the left panel and are covered by electrostatic potential surfaces in the right panel. GDP bound to nsp12 NiRAN is shown as colored sticks to indicate the catalytic center of nsp12 NiRAN. The dashed lines indicate a potential RNA binding groove through nsp12 NiRAN to nsp9.
Figure S6
Figure S6
Results of GTase Activity Assays with [α-32P]-UTP, Related to Figure 4D The components used in each lane are labeled. In lane 5-7, nsp12 is incubated with nsp9 in molar ratio of 1:2 (denoted as +), 1:4 (denoted as 2+) and 1:6 (denoted as 3+). The reaction condition is the same as that used in Figure 4D.
Figure 6
Figure 6
A Model for mRNA Synthesis by SARS-CoV-2 RTC The representative building blocks in the RTCs are indicated in the upper panel.

References

    1. Afonine P.V., Klaholz B.P., Moriarty N.W., Poon B.K., Sobolev O.V., Terwilliger T.C., Adams P.D., Urzhumtsev A. New tools for the analysis and validation of cryo-EM maps and atomic models. Acta Crystallogr. D Struct. Biol. 2018;74:814–840. - PMC - PubMed
    1. Bost A.G., Carnahan R.H., Lu X.T., Denison M.R. Four proteins processed from the replicase gene polyprotein of mouse hepatitis virus colocalize in the cell periphery and adjacent to sites of virion assembly. J. Virol. 2000;74:3379–3387. - PMC - PubMed
    1. Bouvet M., Debarnot C., Imbert I., Selisko B., Snijder E.J., Canard B., Decroly E. In vitro reconstitution of SARS-coronavirus mRNA cap methylation. PLoS Pathog. 2010;6:e1000863. - PMC - PubMed
    1. Brockway S.M., Clay C.T., Lu X.T., Denison M.R. Characterization of the expression, intracellular localization, and replication complex association of the putative mouse hepatitis virus RNA-dependent RNA polymerase. J. Virol. 2003;77:10515–10527. - PMC - PubMed
    1. Chan J.F., Yuan S., Kok K.H., To K.K., Chu H., Yang J., Xing F., Liu J., Yip C.C., Poon R.W., et al. A familial cluster of pneumonia associated with the 2019 novel coronavirus indicating person-to-person transmission: a study of a family cluster. Lancet. 2020;395:514–523. - PMC - PubMed

Publication types

MeSH terms