. 2020 Nov 21;9(11):3743.
doi: 10.3390/jcm9113743.

ACE2 Interaction Networks in COVID-19: A Physiological Framework for Prediction of Outcome in Patients with Cardiovascular Risk Factors

Affiliations

ACE2 Interaction Networks in COVID-19: A Physiological Framework for Prediction of Outcome in Patients with Cardiovascular Risk Factors

Zofia Wicik et al. J Clin Med. .

Abstract

Background: Severe acute respiratory syndrome coronavirus 2 (SARS-CoV-2) infection (coronavirus disease 2019; COVID-19) is associated with adverse outcomes in patients with cardiovascular disease (CVD). The aim of the study was to characterize the interaction between SARS-CoV-2 and Angiotensin-Converting Enzyme 2 (ACE2) functional networks with a focus on CVD.

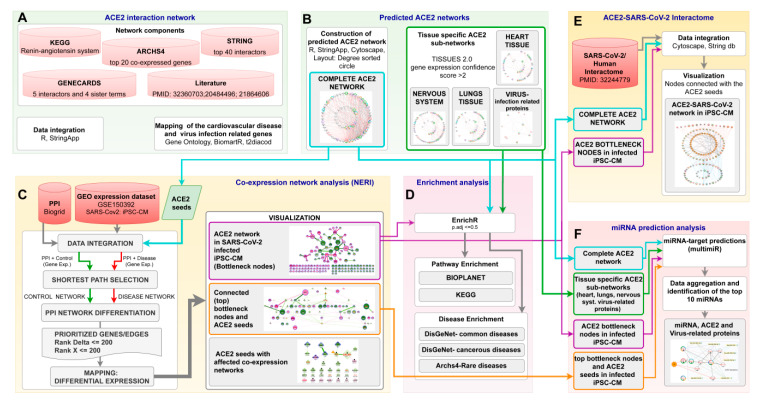
Methods: Using the network medicine approach and publicly available datasets, we investigated ACE2 tissue expression and described ACE2 interaction networks that could be affected by SARS-CoV-2 infection in the heart, lungs and nervous system. We compared them with changes in ACE-2 networks following SARS-CoV-2 infection by analyzing public data of human-induced pluripotent stem cell-derived cardiomyocytes (hiPSC-CMs). This analysis was performed using the Network by Relative Importance (NERI) algorithm, which integrates protein-protein interaction with co-expression networks. We also performed miRNA-target predictions to identify which miRNAs regulate ACE2-related networks and could play a role in the COVID19 outcome. Finally, we performed enrichment analysis for identifying the main COVID-19 risk groups.

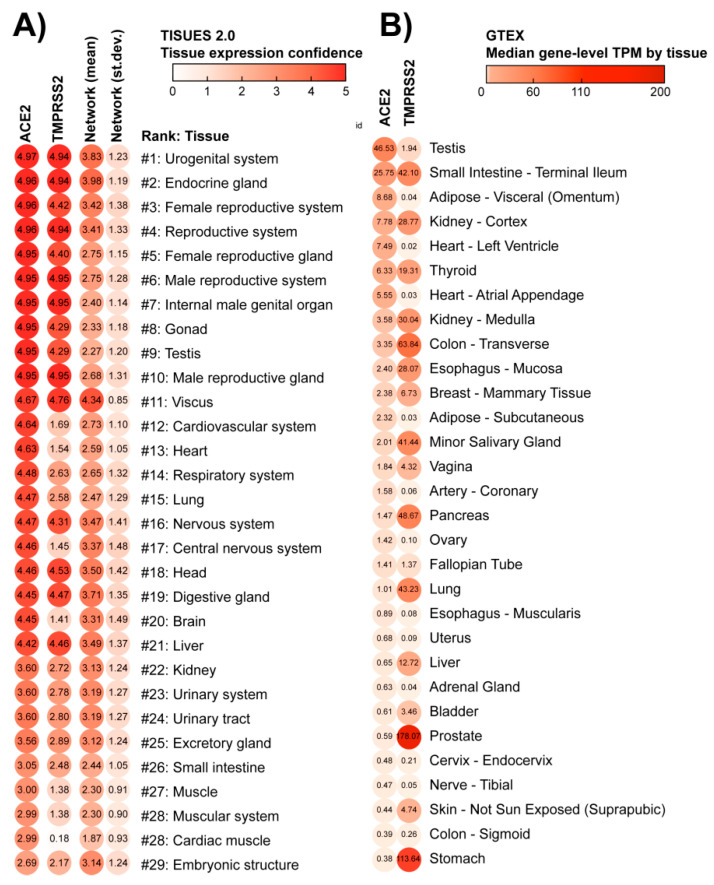
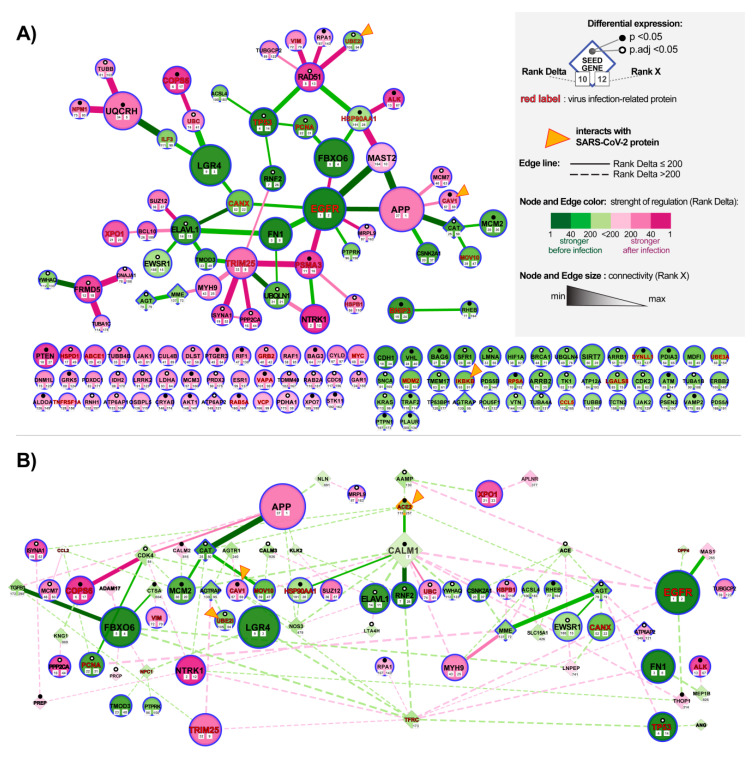
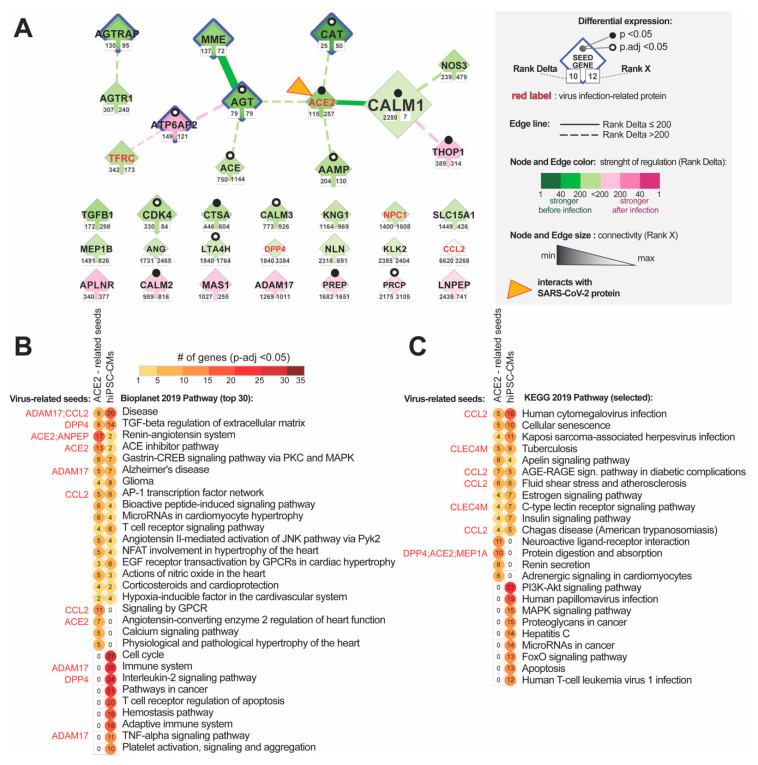
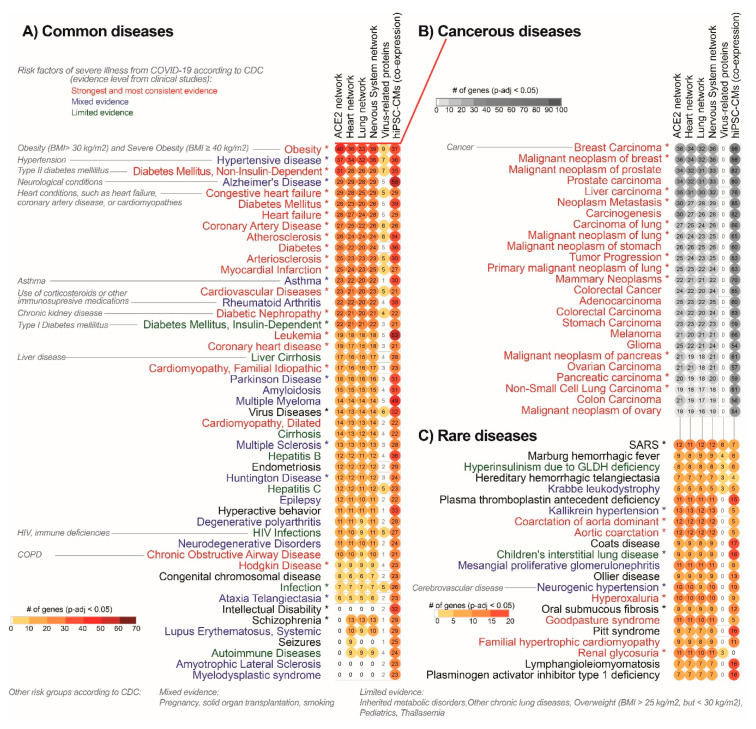
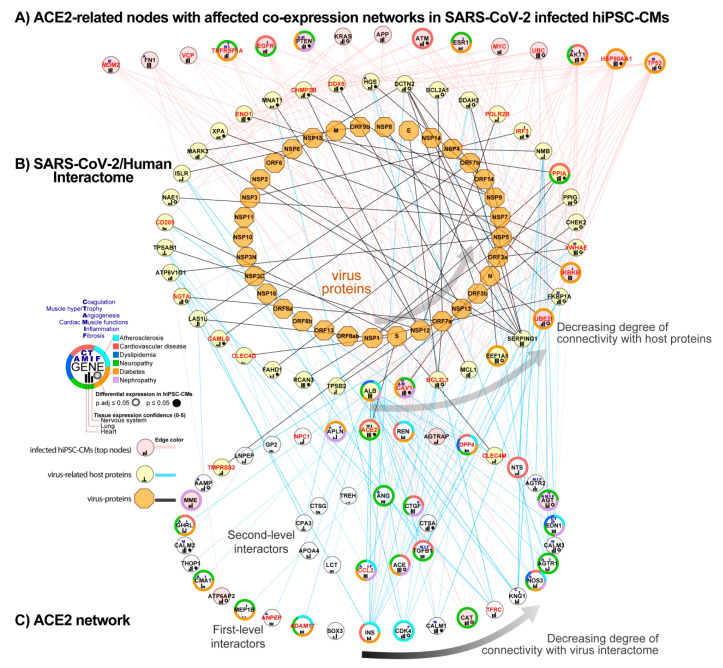
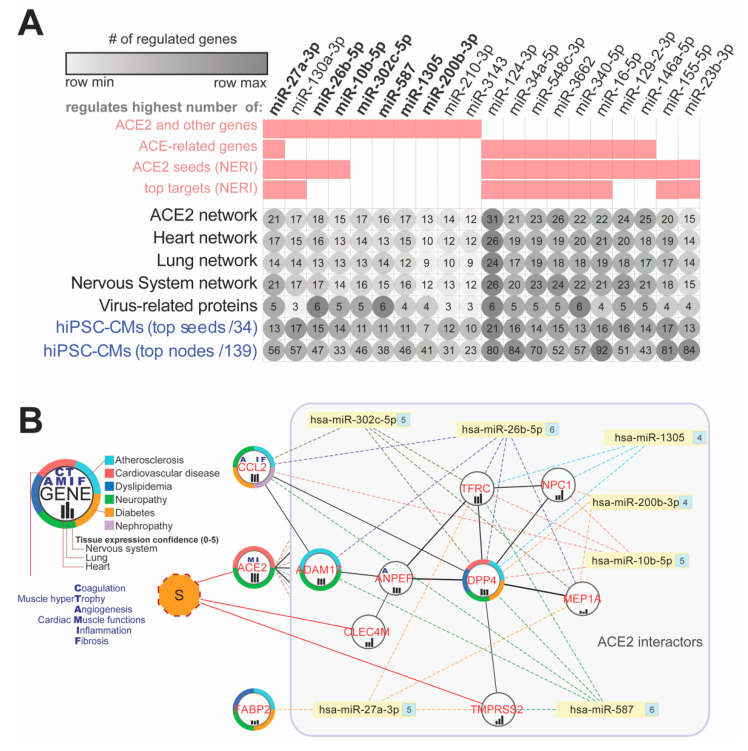
Results: We found similar ACE2 expression confidence levels in respiratory and cardiovascular systems, supporting that heart tissue is a potential target of SARS-CoV-2. Analysis of ACE2 interaction networks in infected hiPSC-CMs identified multiple hub genes with corrupted signaling which can be responsible for cardiovascular symptoms. The most affected genes were EGFR (Epidermal Growth Factor Receptor), FN1 (Fibronectin 1), TP53, HSP90AA1, and APP (Amyloid Beta Precursor Protein), while the most affected interactions were associated with MAST2 and CALM1 (Calmodulin 1). Enrichment analysis revealed multiple diseases associated with the interaction networks of ACE2, especially cancerous diseases, obesity, hypertensive disease, Alzheimer's disease, non-insulin-dependent diabetes mellitus, and congestive heart failure. Among affected ACE2-network components connected with the SARS-Cov-2 interactome, we identified AGT (Angiotensinogen), CAT (Catalase), DPP4 (Dipeptidyl Peptidase 4), CCL2 (C-C Motif Chemokine Ligand 2), TFRC (Transferrin Receptor) and CAV1 (Caveolin-1), associated with cardiovascular risk factors. We described for the first time miRNAs which were common regulators of ACE2 networks and virus-related proteins in all analyzed datasets. The top miRNAs regulating ACE2 networks were miR-27a-3p, miR-26b-5p, miR-10b-5p, miR-302c-5p, hsa-miR-587, hsa-miR-1305, hsa-miR-200b-3p, hsa-miR-124-3p, and hsa-miR-16-5p.

Conclusion: Our study provides a complete mechanistic framework for investigating the ACE2 network which was validated by expression data. This framework predicted risk groups, including the established ones, thus providing reliable novel information regarding the complexity of signaling pathways affected by SARS-CoV-2. It also identified miRNAs that could be used in personalized diagnosis in COVID-19.

Keywords: ACE2; COVID-19; SARS-CoV-2; cardiovascular; gene expression; miR; miRNA; microRNA; therapeutic target.


Conflict of interest statement

The authors declare no conflict of interest.

Figures

Figure 1
Figure 1
Tissues sorted by the potential of being infected by SARS-CoV-2. These lists of tissues were generated according to the concentration of membrane receptors Angiotensin-Converting Enzyme 2 (ACE2) and Transmembrane Protease Serine 2 (TMPRSS2), obtained from (A) TISSUES 2.0 database expression confidence values, and (B) Genotype-Tissue Expression (GTEx) project Transcripts Per Million (TPM) values. The virus starts the cell infection by binding to ACE2, a major hub in multiple physiological processes: this binding can block ACE2 network activity. However, the virus will enter the host cell when TMPRSS2 cleavages ACE2. The first column depicts the average gene and protein expression confidence for the ACE2 receptor; the second column depicts the average expression confidence of TMPRSS2. The mean and standard deviation of expression confidence across 69 genes/proteins of the ACE2 network are presented in the third and fourth columns of panel A, respectively. Notice that the lungs and respiratory system are ranked as #14–15 in the TISSUES 2.0 list, while the heart and cardiovascular system are #12–13. Nervous and reproductive systems are ranked as #16–17 and #1–10, respectively.
Figure 2
Figure 2
The workflow of bioinformatic analyses. (A) data collection to construct complete ACE2 (Angiotensin-Converting Enzyme 2) network; (B) generation of the complete ACE2 network as well as tissue-specific sub-networks; (C) ACE2-related co-expression network analysis of human-induced pluripotent stem cell-derived cardiomyocyte (hiPSC-CMs) 72 h post-infection with SARS-CoV2 using Network by Relative Importance (NERI) algorithm; (D) Enrichment analysis of signaling pathways and diseases related to alterations in ACE2 networks; (E) integration of complete ACE2 network with NERI; and (F) miRNA prediction analysis in ACE2 related networks.
Figure 3
Figure 3
Predicted ACE2 (Angiotensin-Converting Enzyme 2) interaction network. (A) Complete ACE2 network visualized as two circles ordered by the number of connections (degree) with other nodes. A circular degree-sorted layout was used to enable us to hide the edges to simplify visualization. The external circle depicts the first level ACE2 interactors; the internal circle depicts the second level of interactors, with genes that do not connect directly with ACE2. For clarity, on the main figure, we showed only the edges associated with virus-related proteins (gene id in red). Edges associated with virus-related proteins are shown in red for first-level (direct) and in grey for the second-level (indirect) ACE2 interactors. Inset in the top right depicts the additional information for each gene/protein, as associated processes (blue letters), associated diseases (color-label ring), and expression confidence across key tissues (black bars). Inset in the bottom right depicts the same network including all edges. Genes present on the bottom, toward the right of the circular network, showed the highest connectivity within the network. Notice that the closest ACE2 interactors are ACE (Angiotensin-Converting Enzyme 1), renin (REN) and inulin (INS), which play a central role in the pathophysiology of a number of cardiovascular disorders. The following interactor is KNG1 (Kininogen 1), essential for blood coagulation and assembly of the kallikrein-kinin system and AGT (Angiotensinogen) influencing the renin-angiotensin system (RAS) function. In the network are present 11 virus-infection-related proteins (red labels) forming a dense connection with ACE2 and its top interactors which can affect its functionality. (B) Subsets of ACE2 network containing only highly expressed proteins in the heart, lung, and nervous system; analogous network for virus-related proteins (right). From the genes which did not have direct interactions with ACE2, the gene ACE showed the highest connectivity.
Figure 4
Figure 4
Alteration of ACE2 (Angiotensin-Converting Enzyme 2) networks in cardiomyocytes infected with SARS-CoV-2. (A) ACE-2 related hub genes with corroborated signaling obtained by analyzing expression data of human-induced pluripotent stem cell-derived cardiomyocytes (hiPSC-CMs) after 72 h of infection with SARS-CoV2. The network was constructed by using the NERI (Network by Relative Importance) algorithm which integrates protein-protein interaction (PPI) BioGrid interactome with gene co-expression network. For clarity, we selected top genes and edges which had Rank Delta and Rank S number between 1 and 200; additionally, we showed nodes with the best NERI scores (low-rank number) which did not have associated edges with best scores (low-rank number). Genes marked with orange triangles showed direct interaction with SARS-Cov-2 [39]. Notice that EGFR (Epidermal Growth Factor Receptor) and APP (Amyloid Beta Precursor Protein) showed the strongest alterations in their co-expression networks. (B) PPI network between top co-expressed hub genes from panel A (circular shapes) and seed genes (diamond shapes) related to the complete ACE2 network identified using data mining. The size of the nodes and weight of the edges is associated with Rank X number, related to biological importance, while color is associated with Rank Delta, related to the difference in co-expression network between control and disease. Notice that ACE2 shows a reduced number of connections, consistent with its initial downregulation in the early stage of infection; in later stages of infection, we can expect an inversion of observed regulation caused by the virus-related ACE2 overexpression [40].
Figure 5
Figure 5
ACE2 (Angiotensin-Converting Enzyme 2) network in infected human-induced pluripotent stem cell-derived cardiomyocyte (hiPSC-CMs) and top signaling pathways enriched in ACE2 interaction networks. (A) ACE2 related genes identified using data mining and co-expression network in stem cell-derived cardiomyocytes (hiPSC-CMs) 72 h after infection. Pathway enrichment analysis of the complete ACE2 network (68 genes) and 139 top hub genes identified in ACE2 related co-expression network analysis for hiPSC-CMs. Notice that the strongest altered interaction was between AGT-MME (membrane metallo-endopeptidase) and ACE2 and CALM1 (Calmodulin 1), and the strongest affected nodes are AGT (Angiotensinogen) and CAT (Catalase). (B) Bioplanet database (top 30 pathways) and (C) KEGG database (additional pathways not present in Bioplanet). Virus-infection related proteins from the complete ACE2 network are marked with red font. All circles presented on the graph are associated with significantly enriched pathways (False Discovery Rate corrected p-value < 0.05). In this analysis, we also included ACE2-sub-networks for the heart, lungs, and nervous system, but due to high similarity with results for the complete ACE2 network, we excluded them from the figure for better clarity.
Figure 6
Figure 6
Top potential COVID-19 risk groups are significantly associated with ACE2 interaction networks. Risk groups are characterized as (A) common, (B) cancerous and (C) rare diseases. This list is based on enrichment analysis of a database of gene-disease associations (DisGeNET), analyzed through the EnrichR database. We performed disease enrichment analysis in the complete ACE2 network (leftmost column of symbols), and subsets of this network expressed in the heart, lung, and nervous system; we also performed this same analysis for 11 virus-infection related proteins (rightmost column) and ACE2-co-expression network in stem cell-derived cardiomyocytes (hiPSC-CMs) after 72 h of infection. Diseases marked with asterisks include the ACE2 gene. For heart, lung and nervous system tissue, we used the cutoff of expression confidence > 2, obtained from the Tissue2.0 database. All circles presented on the graph are associated with significantly enriched disease terms (False Discovery Rate corrected p-value < 0.05). Top cancer-related diseases are shown on panel B and were subset from the DisGeNET diseases list by using cancer-related keywords. Notice that top diseases are already known as major risk groups in COVID-19. Label colors are associated with evidence of underlying medical conditions that increase the risk of severe illness from COVID-19 according to the Centers for Disease Control and Prevention (CDC) [https://www.cdc.gov/coronavirus/2019-ncov/need-extra-precautions/evidence-table.html updated on 2 November 2020]. “Strongest and most consistent evidence” was defined as consistent evidence from multiple small studies or a strong association from a large study; “Mixed evidence” was defined as multiple studies that reached different conclusions about risk associated with a condition; and “Limited evidence” was defined as consistent evidence from a small number of studies. Unassigned terms are marked with black color.
Figure 7
Figure 7
Combined ACE2 network with SARS-CoV-2/Human interactome and co-expression network in infected human-induced pluripotent stem cell-derived cardiomyocytes (hiPSC-CMs). (A) Hub nodes identified in the co-expression network analysis of infected hiPSC-CMs using the NERI algorithm, showing the highest connectivity with SARS-CoV-2/Human interactome (top 15 genes). (B) SARS-CoV-2/Human interactome as shown in previously published work [39]. (C) ACE2 network components that interact with SARS-CoV-2/Human interactome proteins. Nodes from network A which have the highest connectivity are sorted from right to left. Nodes from the networks B and C are circularly sorted by the number of connections with virus interactome. Virus proteins are shown as orange octagons, while virus-infection related human proteins have red labels.
Figure 8
Figure 8
Top 20 potential miRNA modulators of the ACE2 network in COVID-19. (A) Top miRNAs regulating the highest number of genes within all ACE2 related-networks. Pink squares are showing if miRNA was present among the top 10 miRNAs in a given dataset. (B) Interaction network between virus-infection related proteins (red labels) and top miRNAs (bolded label on the A panel) regulating ACE2 and shared between analyzed networks and regulating at least four virus-related proteins from the complete network. Numbers on the right side of the miRNAs depict the number of targeted genes within the network. CCL2 and FABP2 genes are not direct interactors of the ACE2, so they are presented outside of the ACE2-interactors box. “S” refers to SARS-CoV-2 spike glycoprotein S. Human-induced pluripotent stem cell-derived cardiomyocytes (hiPSC-CMs).

Similar articles

Cited by

References

    1. Zhu N., Zhang D., Wang W., Li X., Yang B., Song J., Zhao X., Huang B., Shi W., Lu R., et al. A Novel Coronavirus from Patients with Pneumonia in China, 2019. N. Engl. J. Med. 2020;382:727–733. doi: 10.1056/NEJMoa2001017. - DOI - PMC - PubMed
    1. Wu C., Chen X., Cai Y., Xia J., Zhou X., Xu S., Huang H., Zhang L., Zhou X., Du C., et al. Risk Factors Associated With Acute Respiratory Distress Syndrome and Death in Patients With Coronavirus Disease 2019 Pneumonia in Wuhan, China. JAMA Intern. Med. 2020;180:934–943. doi: 10.1001/jamainternmed.2020.0994. - DOI - PMC - PubMed
    1. Yang J., Zheng Y., Gou X., Pu K., Chen Z., Guo Q., Ji R., Wang H., Wang Y., Zhou Y. Prevalence of comorbidities and its effects in coronavirus disease 2019 patients: A systematic review and meta-analysis. Int. J. Infect. Dis. 2020;94:91–95. doi: 10.1016/j.ijid.2020.03.017. - DOI - PMC - PubMed
    1. Li B., Yang J., Zhao F., Zhi L., Wang X., Liu L., Bi Z., Zhao Y. Prevalence and impact of cardiovascular metabolic diseases on COVID-19 in China. Clin. Res. Cardiol. 2020;109:531–538. doi: 10.1007/s00392-020-01626-9. - DOI - PMC - PubMed
    1. Leung G.M., Hedley A.J., Ho L.-M., Chau P., Wong I.O., Thach T.Q., Ghani A.C., Donnelly C.A., Fraser C., Riley S., et al. The Epidemiology of Severe Acute Respiratory Syndrome in the 2003 Hong Kong Epidemic: An Analysis of All 1755 Patients. Ann. Intern. Med. 2004;141:662–673. doi: 10.7326/0003-4819-141-9-200411020-00006. - DOI - PubMed