. 2020 Nov 21;12(11):730.
doi: 10.3390/toxins12110730.

Ergot and Ergot Alkaloids in Cereal Grains Intended for Animal Feeding Collected in Slovenia: Occurrence, Pattern and Correlations

Affiliations

Ergot and Ergot Alkaloids in Cereal Grains Intended for Animal Feeding Collected in Slovenia: Occurrence, Pattern and Correlations

Janja Babič et al. Toxins (Basel). .

Abstract

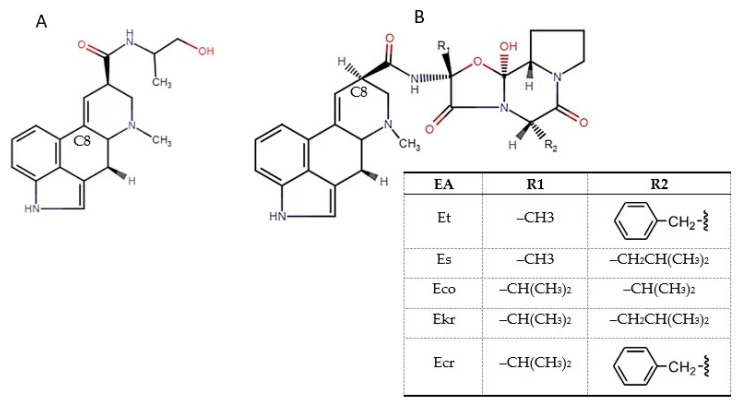
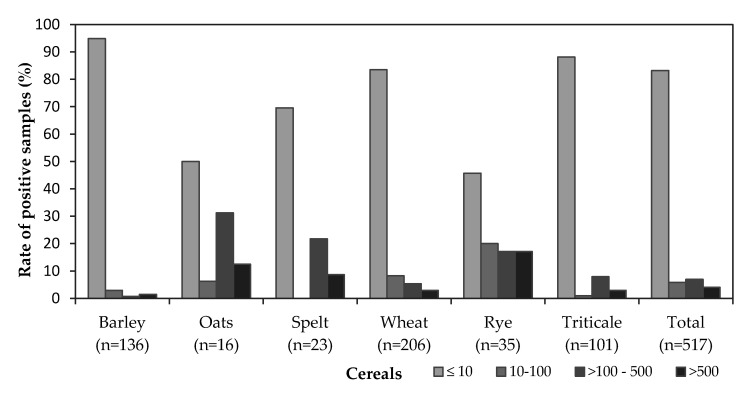
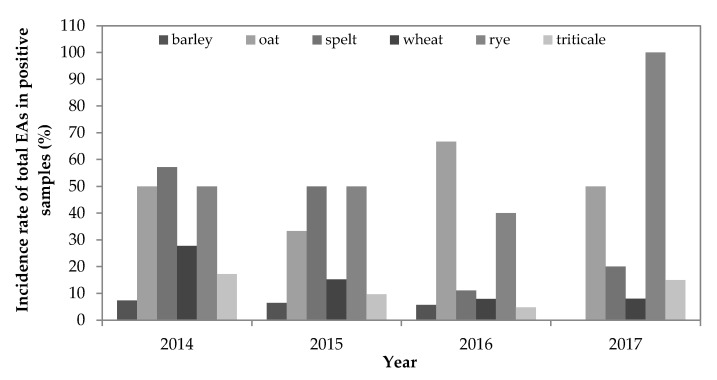
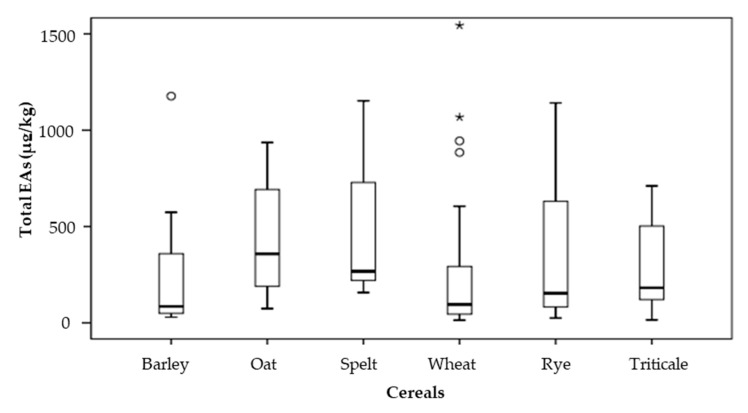
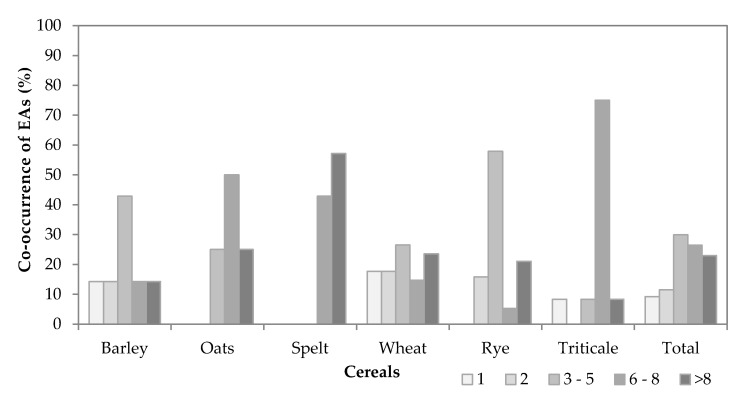
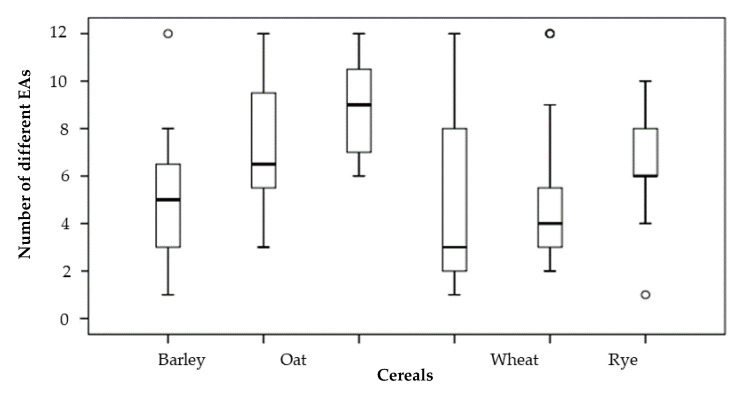
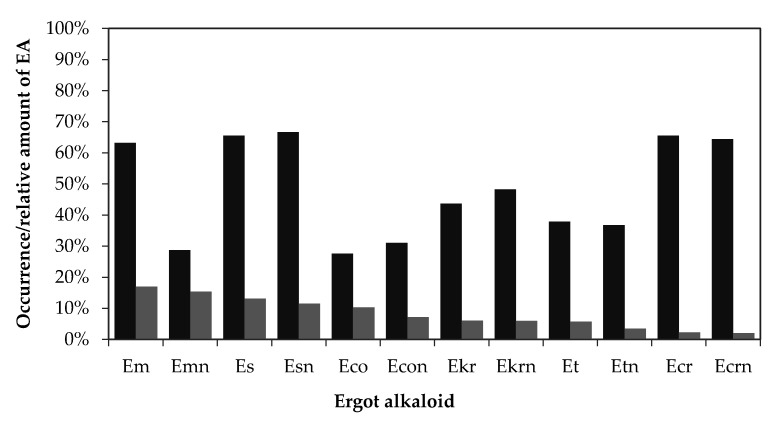
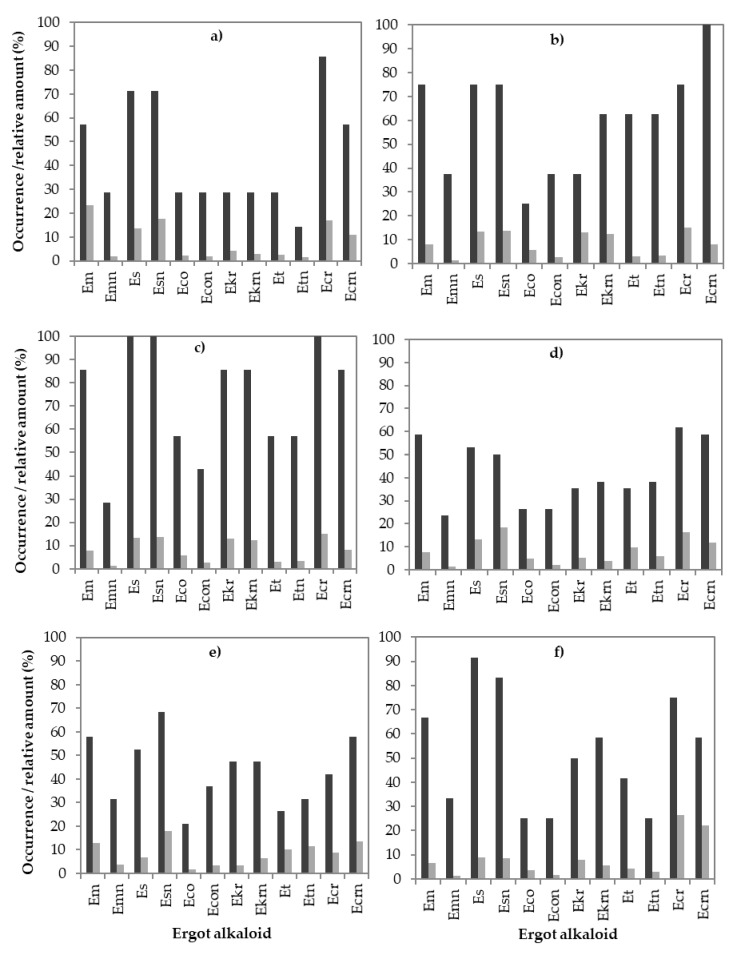
This four-year study reports the occurrence of ergot alkaloids (EAs) in cereals intended for animal feeding collected in Slovenia. A total of 517 samples of cereals were analysed using liquid chromatography-tandem mass spectrometry for the presence of EAs. The sample set included wheat, rye, triticale, oat, spelt and barley. The study revealed that 17% of the analysed cereal samples were contaminated with at least one ergot alkaloid. EAs have two epimeric forms: -ine and -inine. The incidence rates of the -ine and -inine forms in the analysed samples were 16% and 15%, respectively. The highest contamination rates were observed in rye (54%), oat (50%) and spelt (30%), where the highest mean concentrations of total EAs were also determined (502 µg/kg, 594 µg/kg and 715 µg/kg, respectively). However, the highest concentrations of total EAs were found in wheat and rye (4217 µg/kg and 4114 µg/kg, respectively). The predominant EAs were ergometrine, ergosine and ergocristinine. The occurrence of six or more ergot alkaloids was observed in 49% of the positive samples. A weak correlation (p = 0.284) in the positive samples was found between the mass of sclerotia and the total concentrations of EAs using the Spearman correlation coefficient.

Keywords: LC-MS/MS; cereals; correlation; ergot alkaloid occurrence; sclerotia; survey.


Conflict of interest statement

The authors declare no conflict of interest.

Figures

Figure 1
Figure 1
Chemical structures of EAs. (A) Ergometrine—Em and (B) ergotamine—Et, ergosine—Es, ergocornine—Eco, ergokriptine—Ekr and ergocrystine—Ecr.
Figure 2
Figure 2
Distribution of the total ergot alkaloid concentrations (µg/kg) in the samples analysed in the years 2014–2017. n: number of samples.
Figure 3
Figure 3
Yearly incidence of total ergot alkaloids (%) in the analysed samples. The samples containing one or more individual EAs at concentrations equal to or above the LOQ (10 µg/kg) were considered positive.
Figure 4
Figure 4
Box-plot graph summarizing the total content of 12 ergot alkaloids (as shown in the legend of Figure 7) in the positive samples (containing at least one EA with a concentration of 10 µg/kg or more) for each cereal species in the years 2014–2017. Median concentrations are indicated by horizontal lines in the boxes encompassing the 25th–75th percentiles. Outliers in the 95th percentiles are indicated as empty dots (○) and stars (*).
Figure 5
Figure 5
Co-occurrence of EAs (as indicated in the legend of Figure 7). Only positive samples are considered (containing at least one EA with a concentration of 10 µg/kg or more).
Figure 6
Figure 6
Number of different ergot alkaloids in cereals. Mean values are indicated by horizontal lines in the boxes encompassing the 25th–75th percentiles. Outliers in the 95th percentiles are indicated as empty dots (○).
Figure 7
Figure 7
Occurrences (dark bars, % of 87 positive samples) and relative amounts (light bars, % of the sum of individual EA concentration compared to the sum of total EA concentration (39100 µg/kg)) of the individual EAs in the positive cereal samples. Legend: Em—ergometrine, Emn—ergometrinine, Es—ergosine, Esn—ergosinine, Eco—ergocornine, Econ—ergocorninine, Ekr—ergocryptine, Ekrn—ergocryptinine, Et—ergotamine, Etn—ergotaminine, Ecr—ergocristine and Ecrn—ergocristinine.
Figure 8
Figure 8
Occurrences (dark bars, % of 87 positive samples) and relative amounts (light bars, % of the sum of individual EA concentration compared to the sum of total EA concentration (39,100 µg/kg)) of the individual EAs in different cereals: (a) barley, (b) oat, (c) spelt, (d) wheat, (e) rye and (f) triticale. Only positive samples are considered (containing at least one EA with a concentration of 10 µg/kg or more).

References

    1. European Food Safety Authority (EFSA) Scientific opinion on ergot alkaloids in food and feed. EFSA Panel on Contaminants in the Food Chain (CONTAM) EFSA J. 2012;10:2798–2956.
    1. Haarmann T., Rolke Y., Giesbert S., Tudzynski P. Ergot: From witchcraft to biotechnology. Mol. Plant Pathol. 2009;10:563–577. doi: 10.1111/j.1364-3703.2009.00548.x. - DOI - PMC - PubMed
    1. Krska R., Crews C. Significance, chemistry and determination of ergot alkaloids: A review. Food Addit. Contam. Part A. 2008;25:722–731. doi: 10.1080/02652030701765756. - DOI - PubMed
    1. Flieger M., Wurst M., Shelby R. Ergot alkaloids—Sources, structures, and analytical methods. Folia Microbiol. 1997;42:3–30. doi: 10.1007/BF02898641. - DOI - PubMed
    1. Buchta M., Cvak L. Ergot alkaloids and other metabolites of the genus Claviceps. In: Kren V., Cvak L., editors. Ergot: The Genus Claviceps. Harwood Academic Publishers; Amsterdam, The Netherlands: 1999. pp. 173–200.

Publication types

Substances

LinkOut - more resources