. 2020 Nov 21;9(11):1163.
doi: 10.3390/antiox9111163.

Sinapic Acid Inhibits Cardiac Hypertrophy via Activation of Mitochondrial Sirt3/SOD2 Signaling in Neonatal Rat Cardiomyocytes

Affiliations

Sinapic Acid Inhibits Cardiac Hypertrophy via Activation of Mitochondrial Sirt3/SOD2 Signaling in Neonatal Rat Cardiomyocytes

Ui Jeong Yun et al. Antioxidants (Basel). .

Abstract

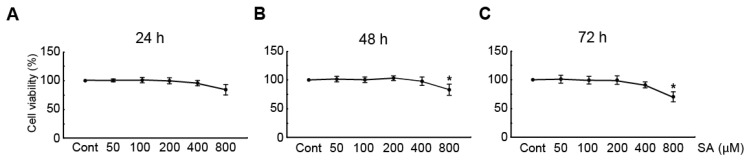
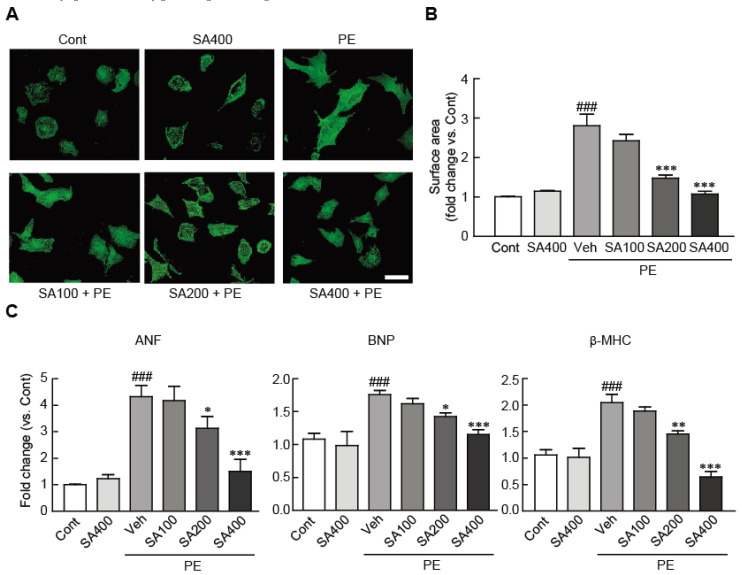
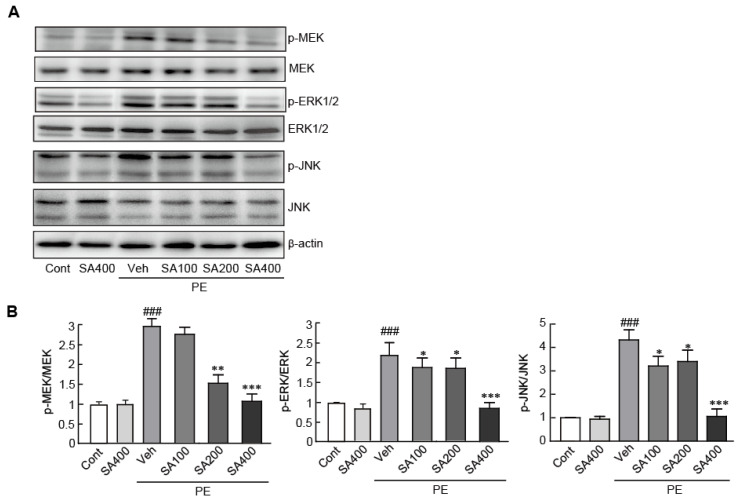
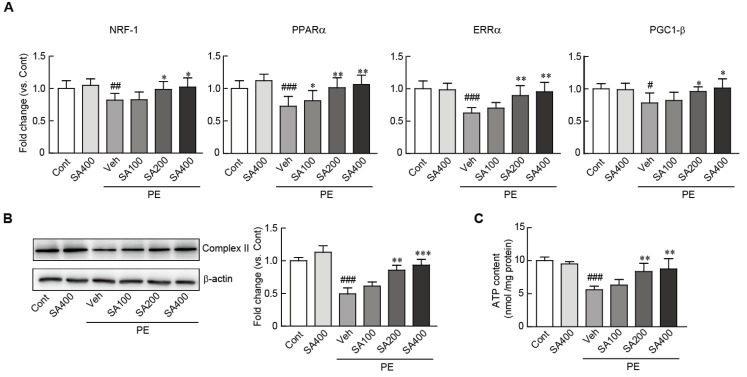
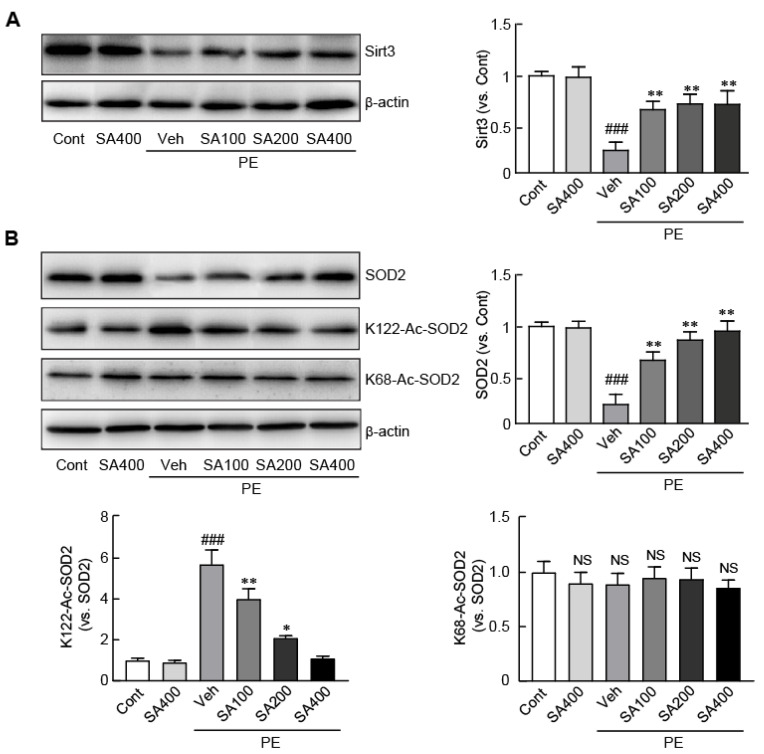
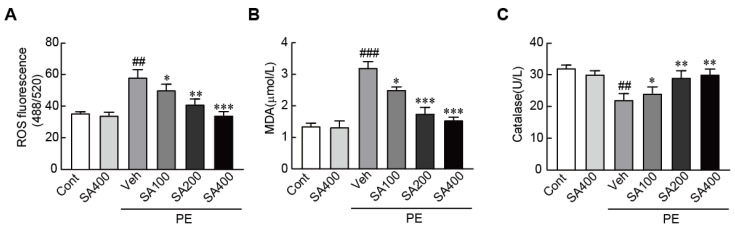
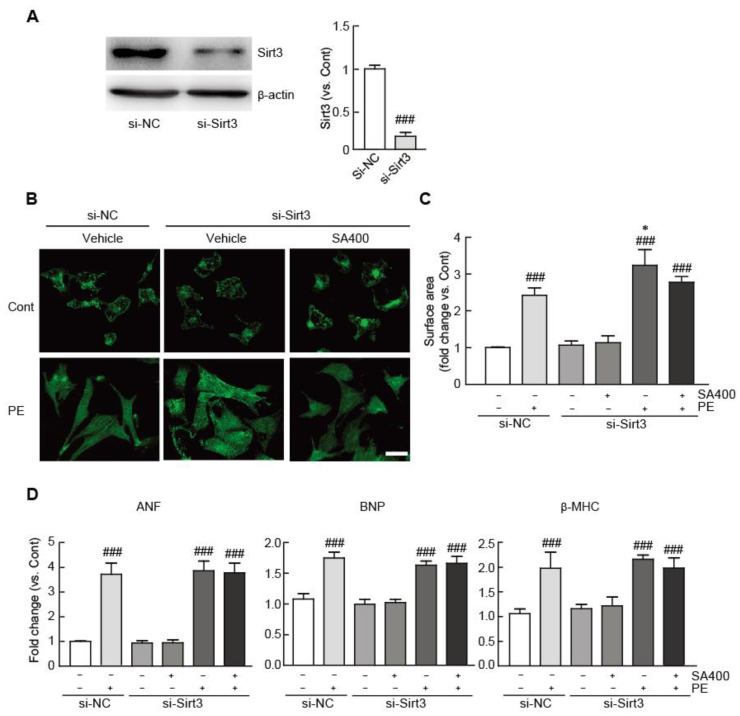
Sinapic acid (SA) is a naturally occurring phenolic compound with antioxidant properties. It also has a wide range of pharmacological properties, such as anti-inflammatory, anticancer, and hepatoprotective properties. The present study aimed to evaluate the potential pharmacological effects of SA against hypertrophic responses in neonatal rat cardiomyocytes. In order to evaluate the preventive effect of SA on cardiac hypertrophy, phenylephrine (PE)-induced hypertrophic cardiomyocytes were treated with subcytotoxic concentrations of SA. SA effectively suppressed hypertrophic responses, such as cell size enlargement, sarcomeric rearrangement, and fetal gene re-expression. In addition, SA significantly inhibited the expression of mitogen-activated protein kinase (MAPK) proteins as pro-hypertrophic factors and protected the mitochondrial functions from hypertrophic stimuli. Notably, SA activated Sirt3, a mitochondrial deacetylase, and SOD2, a mitochondrial antioxidant, in hypertrophic cardiomyocytes. SA also inhibited oxidative stress in hypertrophic cardiomyocytes. However, the protective effect of SA was significantly reduced in Sirt3-silenced hypertrophic cardiomyocytes, indicating that SA exerts its beneficial effect through Sirt3/SOD signaling. In summary, this is the first study to reveal the potential pharmacological action and inhibitory mechanism of SA as an antioxidant against cardiac hypertrophy, suggesting that SA could be utilized for the treatment of cardiac hypertrophy.

Keywords: SOD2; Sirt3; antioxidant; cardiac hypertrophy; oxidative stress; sinapic acid.


Conflict of interest statement

The authors declare no conflict of interest.

Figures

Figure 1
Figure 1
Cytotoxic effects of SA in neonatal rat cardiomyocytes. The MTT assay was performed for measuring the cell viability of cardiomyocytes, using DMSO (a vehicle-treated control) or SA at 50, 100, 200, 400, and 800 μM for (A) 24, (B) 48, and (C) 72 h. Data are expressed as the mean ± standard error of the mean (SEM). Significance was measured by one-way analysis of variance (ANOVA) with a Bonferroni post hoc test. * P < 0.05 vs. control group. Cont, control; SA, sinapic acid; MTT, 3-[4,5-dimethylthiazol-2-yl]-2,5-diphenyltetrazolium bromide.
Figure 2
Figure 2
SA attenuates hypertrophic responses in PE-treated cardiomyocytes. (A) Representative photograph of cardiomyocytes pretreated with 100, 200, and 400 μM SA for 24 h, followed by treatment with 100 μM PE. Sarcomeric organization was visualized by α-actinin staining. Scale bar, 50 μM. (B) Cell-surface areas were measured by using NIH ImageJ software (n = 100 cells per group). (C) qRT-PCR analysis of ANF, BNP, and β-MHC mRNA expression. The analyses were performed in triplicate, using three independent samples. Data are expressed as the mean ± standard error of the mean (SEM). Significance was assessed by one-way analysis of variance (ANOVA) with a Bonferroni post hoc test. ### P < 0.001 vs. the control group; * P < 0.05, ** P < 0.01, and *** P < 0.001 vs. the PE-only treated group. Veh, vehicle-treated; SA100, SA200, and SA400, 100, 200, and 400 μM SA-treated groups, respectively; PE, phenylephrine; Cont, control; SA, sinapic acid.
Figure 3
Figure 3
SA inhibits MAPK signaling in PE-induced hypertrophic cardiomyocytes. (A) The expression levels of total MAPK proteins (MEK, ERK1/2, and JNK) and phosphorylated forms of MAPK proteins (p-MEK, p-ERK1/2, and p-JNK) were measured by Western blot analysis. (B) The band densities were measured by using NIH ImageJ software. β-actin was used as a loading control. The analyses were performed in triplicate, using three independent samples. Data are expressed as the mean ± standard error of the mean (SEM). Significance was assessed by one-way analysis of variance (ANOVA) with a Bonferroni post hoc test. ### P < 0.001 vs. the control group; * P < 0.05 and ** P < 0.01, and *** P < 0.001 vs. the PE-only treated group. Veh, vehicle-treated; SA100, SA200, and SA400, 100, 200, and 400 μM SA-treated groups, respectively; MEK, MAPK/ERK kinase; PE, phenylephrine; Cont, control; SA, sinapic acid.
Figure 4
Figure 4
SA preserves mitochondrial integrity in PE-induced hypertrophic cardiomyocytes. (A) qRT-PCR analysis of mitochondrial biogenesis-related genes (NRF, PPARα, ERRα, and PGC1-β). (B) The expression level of complex II, a mitochondrial structure-related protein, was measured by Western blot analysis. The band densities were measured by using NIH ImageJ software. β-actin was used as a loading control. The analyses were performed in triplicate, using three independent samples. (C) ATP levels were luminometrically measured in SA-pretreated cardiomyocytes treated with PE. Data are expressed as the mean ± standard error of the mean (SEM). Significance was assessed by one-way analysis of variance (ANOVA) with a Bonferroni post hoc test. # P < 0.05, ## P < 0.01, and ### P < 0.001 vs. the control group; * P < 0.05 and ** P < 0.01, and *** P < 0.001 vs. the PE-only treated group. Veh, vehicle-treated; SA100, SA200, and SA400, 100, 200, and 400 μM SA-treated groups, respectively; PE, phenylephrine; Cont, control; SA, sinapic acid.
Figure 5
Figure 5
SA activates the Sirt3/SOD2 signaling pathway in PE-stimulated hypertrophic cardiomyocytes. (A) The expression level of Sirt3 was measured by Western blot analysis. (B) The expression levels of SOD2 and acetylated SOD2 at the 122nd and 68th lysine residues were measured by Western blot analysis. The band densities were measured by using NIH ImageJ software. β-actin was used as a loading control. Data are expressed as the mean ± standard error of the mean (SEM). Significance was assessed by one-way analysis of variance (ANOVA) with a Bonferroni post hoc test. ### P < 0.005 vs. the control group; * P < 0.05, ** P < 0.01, and *** P < 0.001 vs. the PE-only treated group. NS, not significant; K-122-Ac-SOD2, acetylation at the 122nd lysine residue of SOD2; K-68-Ac-SOD2, acetylation at the 68th lysine residue of SOD2; Veh, vehicle-treated; SA100, SA200, and SA400, 100, 200, and 400 μM SA-treated groups, respectively; PE, phenylephrine; Cont, control; SA, sinapic acid.
Figure 6
Figure 6
SA inhibits oxidative stress in PE-stimulated hypertrophic cardiomyocytes. (A) DCFH-DA dye for ROS production, (B) MDA, and (C) catalase were measured in cardiomyocytes pretreated with 100, 200, and 400 μM SA for 24 h, followed by treatment with 100 μM PE. Data are expressed as the mean ± standard error of the mean (SEM). Significance was assessed by one-way analysis of variance (ANOVA) with a Bonferroni post hoc test. ## P < 0.01 and ### P < 0.001 vs. the control group; * P < 0.05, ** P < 0.01, and *** P < 0.001 vs. the PE-only treated group. Veh, vehicle-treated; SA100, SA200, and SA400, 100, 200, and 400 μM SA-treated groups, respectively; MDA, malondialdehyde; PE, phenylephrine; Cont, control; SA, sinapic acid.
Figure 7
Figure 7
The anti-hypertrophic effect of SA is abrogated in Sirt3-silenced hypertrophic cardiomyocytes. (A) The expression level of Sirt3 was measured by Western blot analysis in the cardiomyocytes transfected with control siRNA or Sirt3 siRNA. The band densities were measured by using NIH ImageJ software. β-actin was used as a loading control. (B) Representative photograph of control siRNA- or Sirt3 siRNA mixture-transfected cardiomyocytes pretreated with 400 μM SA and treated with 100 μM PE. Sarcomeric organization was visualized by α-actinin staining. Scale bar, 50 μM. Cell surface areas were measured by using NIH ImageJ software (n = 100 cells per group). (C) qRT-PCR analysis of ANF, BNP, and β-MHC mRNA expression. The analyses were performed in triplicate, using three independent samples. Data are expressed as the mean ± standard error of the mean (SEM). Significance was assessed by one-way analysis of variance (ANOVA) with a Bonferroni post hoc test. ### P < 0.005 vs. the control group; * P < 0.05 vs. the control siRNA-transfected group treated with PE; si-NC, control siRNA-transfected; si-Sirt3, siRNA against the Sirt3-transfected group; SA400, 400 μM SA-treated group; PE, phenylephrine; SA, sinapic acid.

Similar articles

Cited by

References

    1. Nakamura M., Sadoshima J. Mechanisms of physiological and pathological cardiac hypertrophy. Nat. Rev. Cardiol. 2018;15:387–407. doi: 10.1038/s41569-018-0007-y. - DOI - PubMed
    1. Samak M., Fatullayev J., Sabashnikov A., Zeriouh M., Schmack B., Farag M., Popov A.F., Dohmen P.M., Choi Y.H., Wahlers T., et al. Cardiac Hypertrophy: An Introduction to Molecular and Cellular Basis. Med. Sci. Monit. Basic. Res. 2016;22:75–79. doi: 10.12659/MSMBR.900437. - DOI - PMC - PubMed
    1. Heineke J., Molkentin J.D. Regulation of cardiac hypertrophy by intracellular signalling pathways. Nat. Rev. Mol. Cell. Biol. 2006;7:589–600. doi: 10.1038/nrm1983. - DOI - PubMed
    1. Frey N., Katus H.A., Olson E.N., Hill J.A. Hypertrophy of the heart: A new therapeutic target? Circulation. 2004;109:1580–1589. doi: 10.1161/01.CIR.0000120390.68287.BB. - DOI - PubMed
    1. Katz A.M. Cardiomyopathy of overload. A major determinant of prognosis in congestive heart failure. N. Engl. J. Med. 1990;322:100–110. - PubMed

LinkOut - more resources