. 2020 Nov 20;20(22):6649.
doi: 10.3390/s20226649.

Simulation of Fresnel Zone Plate Imaging Performance with Number of Zones

Affiliations

Simulation of Fresnel Zone Plate Imaging Performance with Number of Zones

Ying Li et al. Sensors (Basel). .

Abstract

In recent years, integral imaging, a promising three-dimensional imaging technology, has attracted more and more attention for its broad applications in robotics, computational vision, and medical diagnostics. In the visible spectrum, an integral imaging system can be easily implemented by inserting a micro-lens array between a image formation optic and a pixelated detector. By using a micro-Fresnel Zone Plate (FZP) array instead of the refractive lens array, the integral imaging system can be applied in X-ray. Due to micro-scale dimensions of FZP in the array and current manufacturing techniques, the number of zones of FZP is limited. This may have an important impact on the FZP imaging performance. The paper introduces a simulation method based on the scalar diffraction theory. With the aid of this method, the effect of the number of zones on the FZP imaging performance is numerically investigated, especially the case of very small number of zones. Results of several simulation of FZP imaging are presented and show the image can be formed by a FZP with a number of zones as low as 5. The paper aims at offering a numerical approach in order to facilitate the design of FZP for integral imaging.

Keywords: X-ray integral imaging; fresnel zone plate; modeling; wave propagator.


Conflict of interest statement

The authors declare no conflict of interest.

Figures

Figure 1
Figure 1
Generalized schematic of Fresnel Zone Plate (FZP) optical system: The point source P on the plane (ξ,η) emitting a spherical wave is intercepted and diffracted by the FZP on the plane (x,y). The image of the source is formed on the plane (u,v). z1 and z2 represent respectively the source–FZP distance and the FZP–image distance.
Figure 2
Figure 2
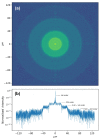
(a) False color image in logarithmic scale of the intensity distribution at the first focal plane of a FZP. The parameters of the FZP are focal length f=8.98 cm, radius r=20 μm, and number of zones N=40. The point source was set at an energy of 11 keV and situated at 100f prior the FZP. (b) Central row intensity profile of panel (a): the radii of 0th order, 3rd/−1st order, and 5th/−3rd order are, respectively, 20 μm, 40 μm, and 80 μm.
Figure 3
Figure 3
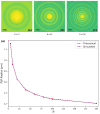
(ac) False color images of simulated Point Spread Function (PSF) on a logarithmic scale, when the number of zones N equals to 10, 40, and 100. (d) Theoretical and simulated PSF spot radius versus N.
Figure 4
Figure 4
False color numerical images of a USAF 1951 target are recorded at various distances from the image plane in focus (called focus). The recorded distance is referred to the focal plane under each image. The focus is taken as the origin, and the negative and positive signs, respectively, represent the directions closer and further to the FZP. The FZP has the same parameters for Figure 2. The object to FZP distance is 3f and leading to the creation of an image on focus is at 1.5f. Each image dimension is 120×120 μm2.
Figure 5
Figure 5
(ae) False color numerical images of the USAF 1951 test target imaged by FZP with different number of zones. The object–-FZP distance is 3f and the FZP–image distance is 1.5f. Each image dimension is 200×200 μm2. (f) Zoomed part of interest on the test chart: for the following part, the blue, orange and green colored elements of bars in group 2 are respectively noted as elements 2.2, 2.3, and 2.4.
Figure 6
Figure 6
Intensity profile plots of images in focus with various numbers of zones: the images are simulated under the same conditions of Figure 4. Three zoomed parts of plot corresponding to different groups of bars are given below the main plot.
Figure 7
Figure 7
Contrast plots of different width bars versus number of zones N:the images are simulated under the same conditions of Figure 4, the studied bars of test chart are shown in Figure 4f.
Figure 8
Figure 8
False color numerical images of the USAF 1951 test target imaged by refractive lens. The NA of the refractive lens equals to the NA of the FZP when the number of zones of FZP is 5, 20, 40, 60, and 100. Each image dimension is 200×200 μm2.
Figure 9
Figure 9
Contrast plots measured from the images formed by refractive lens: For the sake of clarity, the horizontal axis displays the number of zones of the FZP having the same NA than the refractive lens. Moreover, the images are simulated under the same conditions as for Figure 5.

References

    1. Lippmann G. Epreuves reversibles donnant la sensation du relief. J. Phys. Theor. Appl. 1908;7:821–825. doi: 10.1051/jphystap:019080070082100. - DOI
    1. Ng R., Levoy M., Brédif M., Duval G., Horowitz M., Hanrahan P. Ph.D. Thesis. Stanford University; Stanford, CA, USA: 2005. [(accessed on 19 November 2020)]. Light Field Photography with a Hand-Held Plenoptic Camera. Available online: https://hal.archives-ouvertes.fr/hal-02551481.
    1. Tian L., Waller L. 3D intensity and phase imaging from light field measurements in an LED array microscope. Optica. 2015;2:104–111. doi: 10.1364/OPTICA.2.000104. - DOI
    1. Van Daatselaar A.N., Van der Stelt P.F., Weenen J. Effect of number of projections on image quality of local CT. Dentomaxillofacial Radiol. 2004;33:361–369. doi: 10.1259/dmfr/23496562. - DOI - PubMed
    1. De González A.B., Mahesh M., Kim K.P., Bhargavan M., Lewis R., Mettler F., Land C. Projected cancer risks from computed tomographic scans performed in the United States in 2007. Arch. Intern. Med. 2009;169:2071–2077. doi: 10.1001/archinternmed.2009.440. - DOI - PMC - PubMed

LinkOut - more resources