. 2020 Nov 20;9(11):1613.
doi: 10.3390/plants9111613.

Automatic Stomatal Segmentation Based on Delaunay-Rayleigh Frequency Distance

Affiliations

Automatic Stomatal Segmentation Based on Delaunay-Rayleigh Frequency Distance

Miguel Carrasco et al. Plants (Basel). .

Abstract

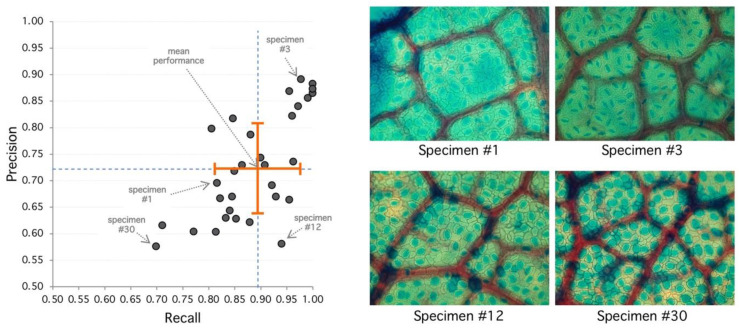
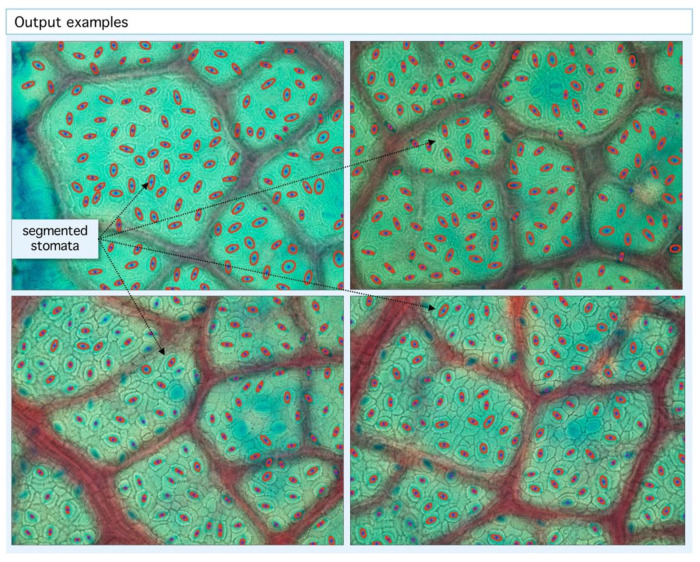
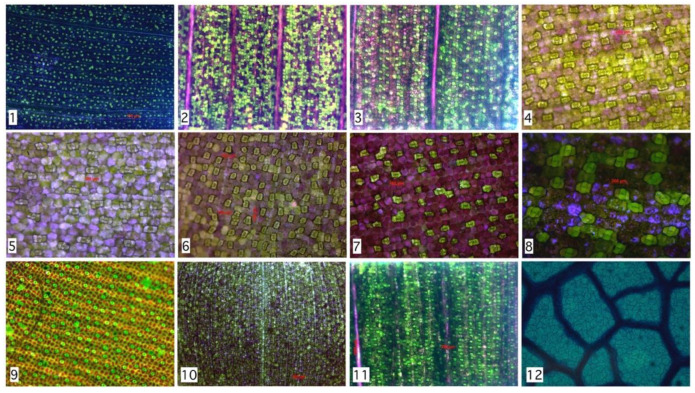
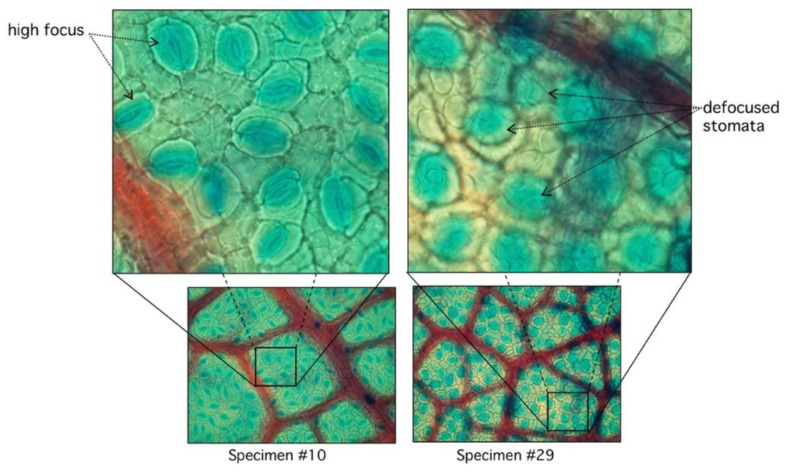
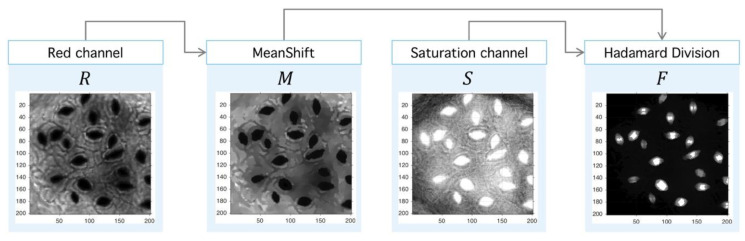
The CO2 and water vapor exchange between leaf and atmosphere are relevant for plant physiology. This process is done through the stomata. These structures are fundamental in the study of plants since their properties are linked to the evolutionary process of the plant, as well as its environmental and phytohormonal conditions. Stomatal detection is a complex task due to the noise and morphology of the microscopic images. Although in recent years segmentation algorithms have been developed that automate this process, they all use techniques that explore chromatic characteristics. This research explores a unique feature in plants, which corresponds to the stomatal spatial distribution within the leaf structure. Unlike segmentation techniques based on deep learning tools, we emphasize the search for an optimal threshold level, so that a high percentage of stomata can be detected, independent of the size and shape of the stomata. This last feature has not been reported in the literature, except for those results of geometric structure formation in the salt formation and other biological formations.

Keywords: Delaunay-Rayleigh frequency; image segmentation; stomatal segmentation.


Conflict of interest statement

The authors declare no conflict of interest.

Figures

Figure 1
Figure 1
Illustration of precision and recall concepts. True positive (TP) occurs when the distance between manual-coordinate (yellow cross) is less than a threshold with respect to the coordinate of the segmented-region (ellipses). False negative (FN) occurs when the algorithm does not find the stoma, even when it is present in the image. Finally, when the algorithm classifies a region where there is no stoma, we consider this coordinate as False Positive (FP). The ratio TP/(FP + TP) is known as precision (positive predictive value (PPV)), and the ratio (TP/TP + FN) is called recall (true positive rate (TPR)).
Figure 2
Figure 2
Performance of the proposed algorithm applied to 31 specimens of Hymenaea Courbaril (Jatoba Database). Overall recall and precision are 89.14% and 72.8%, respectively. Maximum recall performance is achieved at specimens #8, #9, and #10 with 100% and maximum precision performance is reached at 98% by specimen #3. Worst recall and precision performance is 70% and 58%, respectively, both at specimen #30.
Figure 3
Figure 3
Analysis of selected specimens. (Left) Best performance is achieved at the upper-right area of the diagram with high recall and precision. Worst performance is achieved at the lower-left area. Orange cross indicates mean (recall/performance 83%/72%) and standard deviation (8%/10%). (Right) Specimen #1 represents an average performance (85%/72%) with clear regions but high diffusion. Specimen #3 has 98%/89% detection performance, and stomata shows sharp borders with clear regions leading to good detection metrics. Specimen #12 shows 94%/58% with high recall and lower precision, explained by diffuse borders and poor region definition. Specimen #30 has the poorest performance with 70%/58% with very diffuse borders and poor regions with high false positive rate.
Figure 4
Figure 4
Example of segmentation output. Our algorithm is able to detect stomatal centroids (blue dots) and segmented areas (red ellipses). With the geometric information from centroid coordinates, statistics and tessellations are built.
Figure 5
Figure 5
Hand segmentation to 2842 stomata within 12 species as described in Table 1. Despite morphological and chromatically differences, the spatial distributions are similar to the example shown in Figure 4 (Hymenaea Courbaril).
Figure 6
Figure 6
Root-Mean-Square Deviation (RMSD) versus segmented stomata number and Rayleigh parameter. (a), the RMSD decreases as a power law with number of segmented stomata. (b), RMSD increases exponentially with Rayleigh parameter. High RMSD species (red labels) tend to have lower number of segmented regions and higher Rayleigh parameter.
Figure 7
Figure 7
Relationship between segmented region and Rayleigh distribution histogram. First column (stomata) shows different species analyzed. Second column (Delaunay center-of-mass) shows mass centers and corresponding tessellations. Third column (Zoom Region-of-Interest, ROI) shows region of interest. Fourth column (Distance distribution) shows sensibility of histogram to spatial distribution (more at https://github.com/mlacarrasco/drtb/tree/main/stomatasDB/output).
Figure 8
Figure 8
Comparison between high and low focused stomata. In specimen #10, stomata are clearly visible with sharp edges with very low RMSD (see Figure 7). Specimen #29 has diffused edges.
Figure 9
Figure 9
General process implemented in detection algorithm. (Left) Input RGB image from microscope. (Center) Sequence of processing: First, Preprocessing stage: Perona-Malik filtering followed by Meanshift clustering. Second, segmentation algorithm proposed (DRTB): binarization, labeling, tessellation, distance analysis, and segmentation stage plus optimal leveling. (Right) Final output image with segmented region and centroid based tessellation.
Figure 10
Figure 10
Image preprocessing with Perona-Malik (PM) filtering. PM has three main parameters: Δ, which represents the diffusion level; κ, which represents an advance-step (time in the original PDE framework); and the iteration number (advance-step times iteration number is the total time in the PDE framework). Four examples are shown to exemplify diffusion action over an image; higher Δ parameter means more diffuse image.
Figure 11
Figure 11
Image preprocessing with Perona-Malik (PM) filtering. After the PM usage (see Figure 10) the image is decomposed into red, green, and blue channels (RGB decomposition) with a standard routine (see shared code at GitHub). The red channel PR is used later in the next process.
Figure 12
Figure 12
Image preprocessing with Meanshift-Hadamard division. After the PM usage (see Figure 10), the filtered red-channel tPR is used as input for Meanshift; the output M(tPR) is combined with the saturation channel of the original image PS through the Hadamard division, and this later image is subject to clustering.
Figure 13
Figure 13
Binary segmentation and Delaunay tessellation. (Left) Grey-scale image (see Figure 12) is subject to the process of binarization at the l-level. (Right) Different binarization threshold results in different tessellations. The best tessellation is found through an optimization procedure applied over the RMSD, with respect to an ideal Rayleigh distribution and the empirical histogram.
Figure 14
Figure 14
Delaunay tessellation over ROI (red square). (Left) Meanshift image and binarized image. (Center) Zoom over the ROI shows the segmented regions and its centroids (yellow dots). A Delaunay tessellation is built from centroids; note that centroid positions are dependent on the binarization level l. (Right) After the centroids are fixed and the tessellation is built, the set di of all found distances are used to calculate a histogram, which is used for RMSD analysis.
Figure 15
Figure 15
Sensibility analysis of binarization level and RMSD optimization procedure. (Left) Different histograms corresponding to different binarization levels. (Upper right) RMSD sensibility with respect to binarization level. The level of binarization minimizing the RMSD error is used for the final tessellation. (Lower right) Final output of the proposed algorithm with the positions of stomata fixed at tessellation nodes.

Similar articles

References

    1. Fanourakis D., Nikoloudakis N., Pappi P., Markakis E., Doupis G., Charova S., Delis C., Tsaniklidis G. The Role of Proteases in Determining Stomatal Development and Tuning Pore Aperture: A Review. Plants. 2020;9:340. doi: 10.3390/plants9030340. - DOI - PMC - PubMed
    1. Fanourakis D., Aliniaeifard S., Sellin A., Giday H., Körner O., Nejad A.R., Delis C., Bouranis D., Koubouris G., Kambourakis E., et al. Stomatal behavior following mid- or long-term exposure to high relative air humidity: A review. Plant Physiol. Biochem. 2020;153:92–105. doi: 10.1016/j.plaphy.2020.05.024. - DOI - PubMed
    1. Pillitteri L.J., Torii K.U. Mechanisms of Stomatal Development. Annu. Rev. Plant Biol. 2012;63:591–614. doi: 10.1146/annurev-arplant-042811-105451. - DOI - PubMed
    1. Zhu Z., Piao S., Myneni R.B., Huang M., Zeng Z., Canadell J.G., Ciais P., Sitch S., Friedlingstein P., Arneth A., et al. Greening of the Earth and its drivers. Nat. Clim. Chang. 2016;6:791–795. doi: 10.1038/nclimate3004. - DOI
    1. Franks P.J., Drake P.L., Beerling D.J. Plasticity in maximum stomatal conductance constrained by negative correlation between stomatal size and density: An analysis usingEucalyptus globulus. Plant Cell Environ. 2009;32:1737–1748. doi: 10.1111/j.1365-3040.2009.002031.x. - DOI - PubMed

Grants and funding

LinkOut - more resources