. 2020 Nov 20;21(22):8798.
doi: 10.3390/ijms21228798.

Short Disordered Epitope of CRTAM Ig-Like V Domain as a Potential Target for Blocking Antibodies

Affiliations

Short Disordered Epitope of CRTAM Ig-Like V Domain as a Potential Target for Blocking Antibodies

Julio Angel Vázquez-Martínez et al. Int J Mol Sci. .

Abstract

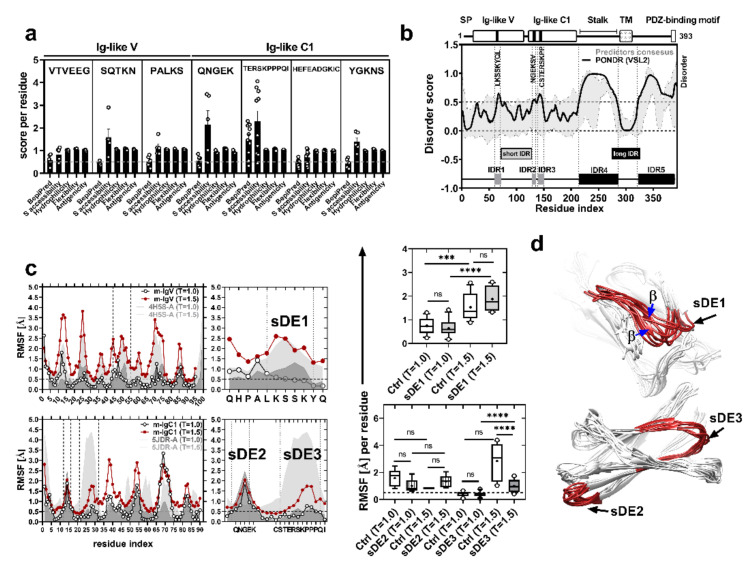
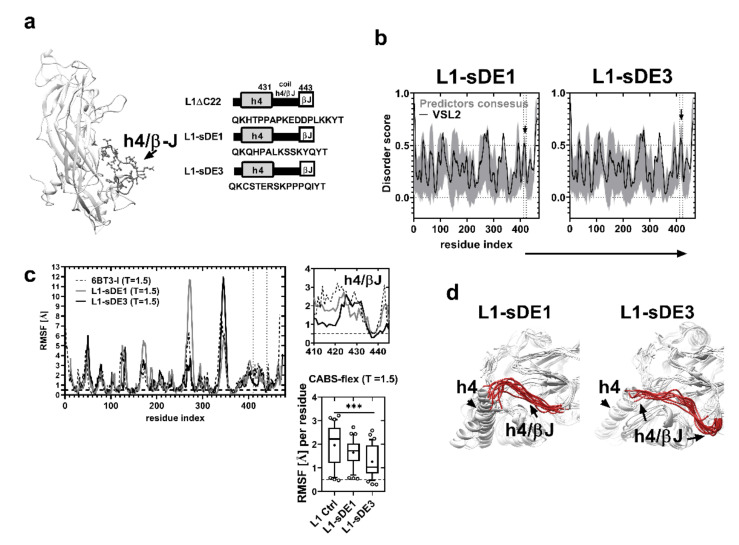
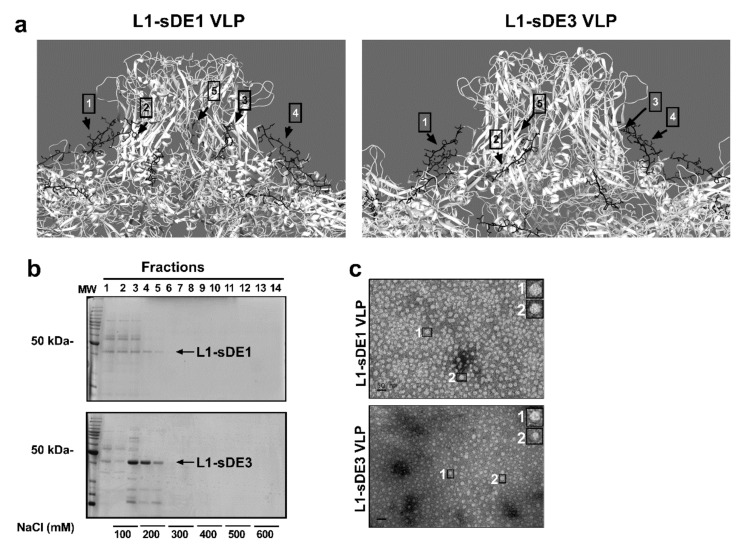
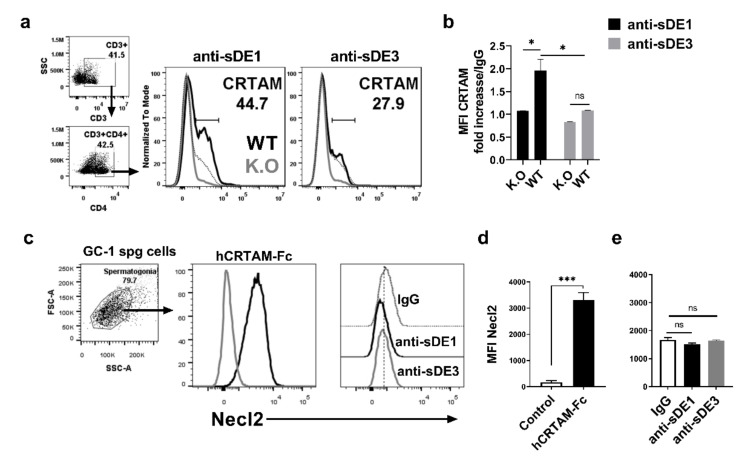
Class-I Restricted T Cell-Associated Molecule (CRTAM) is a protein that is expressed after T cell activation. The interaction of CRTAM with its ligand, nectin-like 2 (Necl2), is required for the efficient production of IL-17, IL-22, and IFNγ by murine CD4 T cells, and it plays a role in optimal CD8 T and NK cell cytotoxicity. CRTAM promotes the pro-inflammatory cytokine profile; therefore, it may take part in the immunopathology of autoimmune diseases such as diabetes type 1 or colitis. Thus, antibodies that block the interaction between CRTAM and Necl2 would be useful for controlling the production of these inflammatory cytokines. In this work, using bioinformatics predictions, we identified three short disordered epitopes (sDE1-3) that are located in the Ig-like domains of murine CRTAM and are conserved in mammalian species. We performed a structural analysis by molecular dynamics simulations of sDE1 (QHPALKSSKY, Ig-like V), sDE2 (QRNGEKSVVK, Ig-like C1), and sDE3 (CSTERSKKPPPQI, Ig-like C1). sDE1, which is located within a loop of the contact interface of the heterotypic interaction with Nectl2, undergoes an order-disorder transition. On the contrary, even though sDE2 and sDE3 are flexible and also located within loops, they do not undergo order-disorder transitions. We evaluated the immunogenicity of sDE1 and sDE3 through the expression of these epitopes in chimeric L1 virus-like particles. We confirmed that sDE1 induces polyclonal antibodies that recognize the native folding of CRTAM expressed in activated murine CD4 T cells. In contrast, sDE3 induces polyclonal antibodies that recognize the recombinant protein hCRTAM-Fc, but not the native CRTAM. Thus, in this study, an exposed disordered epitope in the Ig-like V domain of CRTAM was identified as a potential site for therapeutic antibodies.

Keywords: CRTAM; Intrinsically Disordered Regions; Necl2; VLPs; short-disordered epitopes.


Conflict of interest statement

The authors declare that they have no conflict of interest.

Figures

Figure 1
Figure 1
Short disordered epitopes of CRTAM Ig-like domains. (a) Linear B-cell epitope predictions by different algorithms (threshold = 0.5, 10% F.P). Each point represents the score for each residue of the epitope sequence. (b) Prediction of the intrinsically disordered region of the murine CRTAM sequence. The top panel shows the scheme of the CRTAM protein: Ig-like variable and constant domains, stalk, transmembrane (TM), cytoplasmic region, and PDZ-binding motif ESIV. The black lines in the Ig-like domains represent the locations of short disordered epitopes (sDEs); the predictor consensus is shaded in gray (standards errors from algorithms: IUPRED2A, PrDOS, DISOPRED3, and DisEMBL), and PONDR-VSL2 is indicated by the black line. The groups of residues (peaks) with scores of ≥0.5 are defined as short (gray boxes) or long (black boxes) intrinsically disordered regions (IDR1-5). (c) Behavior of the amino acid fluctuations according to CABS-flex coarse-grained molecular dynamics. The plot represents the RMSF of the control structure (4H5S-A) or murine CRTAM models (m-IgV or m-IgC1) in two conditions (T = 1.0 and T = 1.5). The RMSF averages of sDE1-3 are shown in the box and whisker (min to max) plots and were evaluated by one-way ANOVA (*** p < 0.001, **** p < 0.0001, ns = not significant). (d) Structures are representative of 10 models using CABS-flex MD at T = 1.5 from Ig-like V or C1 domains: each sDE is shown in red, and ambiguous structures are indicated with blue arrows.
Figure 2
Figure 2
L1 epitopes are short disordered regions. (a) Prediction of the intrinsically disordered region of the L1 HPV16 sequence (6BT3-I). PONDR (black line) and predictor consensus (dark gray shades) are shown (dotted line, threshold = 0.5). The light gray boxes designate the described antigenic loops of the L1 viral protein (B/C, D/E, F/G, H/I, and h4/βJ). (b,c) RMSF (Å) from CABS-flex at T = 1.5 and average relative SASA (Å2) from L1 antigenic loops, evaluated by one-way ANOVA (**** p < 0.0001). (d) Representation of the surface accessibility of antigenic loops (white surfaces labeled with black arrows) in the L1 pentamer (PDB: 3J6R): the loops are representative of 10 models predicted by CABS-flex, and their ambiguous folding regions are indicated (black arrows).
Figure 3
Figure 3
CRTAM sDEs retain their flexibility in chimeric L1 viral protein. (a) L1 3D model (the h4/βJ loop is indicated). Chimeric construct scheme (right) of each synthetic gene; different structures are indicated by gray shaded boxes (helix 4), white boxes (βJ), and thick black lines (h4/βJ loop). The top panel shows the native residue sequence (L1ΔC22), and the middle and bottom panels show the CRTAM epitopes that were replaced in the native sequence (L1-sDE1 and L1-sDE3). (b) Prediction of the intrinsically disordered region of chimeric viral protein sequences: the gray shaded areas and black line denote the predictor consensus and PONDR-VSL2, respectively; the residues that constitute IDR and CRTAM epitopes are indicated with black arrows. (c) Behavior of RMSF of chimeric viral proteins and control from CABS-flex MD at T = 1.5: the top panel (right) shows a close-up of a selected area corresponding to the h4/βJ loop (430–443); the bottom panel (right) shows the average RMSF of sDEs from chimeric viral proteins at T = 1.5, evaluated by one-way ANOVA (*** p < 0.001). (d) Three-dimensional models from chimeric L1 proteins: CRTAM sDEs in the h4/βJ loop are in red, and the h4 helix structures are indicated with black arrows.
Figure 4
Figure 4
Chimeric viral proteins assembled into virus-like particles. (a) Full chimeric viral capsid of each construct reconstructed by crystal symmetry coordinates of the reported L1 structure: disordered epitopes are in black (sDE1 and sDE3), labeled with black arrows and numbers for each chimeric L1 monomer. (b) SDS-PAGE of the fraction from chromatographic purification of L1-sDE1 (top) or L1-sDE3 (bottom). Black arrows show the molecular weights of purified proteins, and the concentrations of NaCl used for purification are indicated at the bottom of the figure. (c) Transmission electron microscopy of chimeric viral proteins assembled into VLPs. A close-up view of assembled VLPs, scale bar = 50 nm.
Figure 5
Figure 5
Polyclonal anti-sDE1 antibodies recognize the native CRTAM expressed in T cells and do not cross-react with Necl2. (a) Histogram of CRTAM expression in CD4 T cells from CRTAM knockouts (gray line) or from C57BL6 (black line). Cells were stained with polyclonal anti-sDE1, anti-sDE3, or polyclonal IgG (dotted line). (b) The bar graph displays the reactivity of polyclonal anti-sDE1 or anti-sDE3 normalized against the control (rabbit polyclonal IgG) as the mean fluorescence intensity (MFI) of CRTAM expressed in CD4 T cells. Splenocytes from C57Bl/6 mice or CRTAM knockout mice were stimulated with ionomycin/PMA for 14 h, and then cells were stained and analyzed by flow cytometry. Stimulated or unstimulated cells were gated on CD3+CD4+. The data are expressed as the mean and standard error from three independent experiments, with three wild-type mice and three KO mice in each experiment. (c) FACS and histogram of Necl2 expression in GC-1 spg cells. The spermatogonia cell line was stained with polyclonal anti-sDE1, anti-sDE3, or IgG. The soluble recombinant protein (hCRTAM-Fc) was used as a positive control, as previously reported [21,22,25,37]. (d,e) The bar graph shows the MFI of four conditions with three independent experiments. The statistical analysis was performed with one-way ANOVA, * p < 0.05, *** p < 0.001, ns = not significant.

Similar articles

References

    1. Dunker A.K., Obradovic Z. The protein trinity—linking function and disorder. Nat. Biotechnol. 2001;19:805–806. doi: 10.1038/nbt0901-805. - DOI - PubMed
    1. Dunker A.K., Lawson J.D., Brown C.J., Williams R.M., Romero P., Oh J.S., Oldfield C.J., Campen A.M., Ratliff C.M., Hipps K.W., et al. Intrinsically disordered protein. J. Mol. Graph. Model. 2001;19:26–59. doi: 10.1016/S1093-3263(00)00138-8. - DOI - PubMed
    1. Uversky V.N., Gillespie J.R., Fink A.L. Why are “natively unfolded” proteins unstructured under physiologic conditions? Proteins: Struct. Funct. Bioinform. 2000;41:415–427. doi: 10.1002/1097-0134(20001115)41:3<415::AID-PROT130>3.0.CO;2-7. - DOI - PubMed
    1. Dyson H.J. Making Sense of Intrinsically Disordered Proteins. Biophys. J. 2016;110:1013–1016. doi: 10.1016/j.bpj.2016.01.030. - DOI - PMC - PubMed
    1. Yoon M.-K., Mitrea D.M., Ou L., Kriwacki R.W. Cell cycle regulation by the intrinsically disordered proteins p21 and p27. Biochem. Soc. Trans. 2012;40:981–988. doi: 10.1042/BST20120092. - DOI - PMC - PubMed

LinkOut - more resources