. 2020 Nov 25;287(1939):20202063.
doi: 10.1098/rspb.2020.2063. Epub 2020 Nov 25.

Species richness promotes ecosystem carbon storage: evidence from biodiversity-ecosystem functioning experiments

Affiliations

Species richness promotes ecosystem carbon storage: evidence from biodiversity-ecosystem functioning experiments

Shan Xu et al. Proc Biol Sci. .

Abstract

Plant diversity has a strong impact on a plethora of ecosystem functions and services, especially ecosystem carbon (C) storage. However, the potential context-dependency of biodiversity effects across ecosystem types, environmental conditions and carbon pools remains largely unknown. In this study, we performed a meta-analysis by collecting data from 95 biodiversity-ecosystem functioning (BEF) studies across 60 sites to explore the effects of plant diversity on different C pools, including aboveground and belowground plant biomass, soil microbial biomass C and soil C content across different ecosystem types. The results showed that ecosystem C storage was significantly enhanced by plant diversity, with stronger effects on aboveground biomass than on soil C content. Moreover, the response magnitudes of ecosystem C storage increased with the level of species richness and experimental duration across all ecosystems. The effects of plant diversity were more pronounced in grasslands than in forests. Furthermore, the effects of plant diversity on belowground plant biomass increased with aridity index in grasslands and forests, suggesting that climate change might modulate biodiversity effects, which are stronger under wetter conditions but weaker under more arid conditions. Taken together, these results provide novel insights into the important role of plant diversity in ecosystem C storage across critical C pools, ecosystem types and environmental contexts.

Keywords: ecosystem carbon stock; meta-analysis; microbial biomass carbon; plant biomass; plant species richness; soil carbon.


Conflict of interest statement

We declare we have no competing interests.

Figures

Figure 1.
Figure 1.
Conceptual model for the potential relationships between plant species richness, carbon pools, and different ecological and experimental modulators. (+): positive effect; (−): negative effect. (Online version in colour.)
Figure 2.
Figure 2.
The distribution of sites across all ecosystems. Green circles represent grassland, blue triangles represent forest and pink diamonds represent wetland. (Online version in colour.)
Figure 3.
Figure 3.
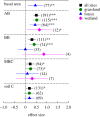
The effects of plant species richness on basal area, aboveground biomass (AB), belowground biomass (BB), microbial biomass carbon (MBC) and soil carbon (Soil C) content across all ecosystems, in grassland, forest and wetland. Black squares represent data from all sites, green circles represent data from grassland, blue triangles represent data from forest and pink diamonds represent data from wetland. Effect sizes are shown as natural log-response ratios for n studies per response variable. Confidence intervals of an effect size overlapping zero (dashed line) indicates no change relative to controls, whereas effects are significant when confidence intervals do not overlap with zero (indicated by asterisks, *p < 0.05, **p < 0.01, ***p < 0.001). Numbers in parentheses represent the number of observations for each parameter. (Online version in colour.)
Figure 4.
Figure 4.
The pair-wise relationships among the response ratios of the four variables aboveground biomass (AB), belowground biomass (BB), microbial biomass carbon (MBC) and soil carbon (soil C) content in grassland, forest and wetland: (a) AB versus BB, (b) AB versus MBC, (c) BB versus MBC, (d) AB versus soil C, (e) BB versus soil C and (f) MBC versus soil C. Green circles represent data from grassland; blue triangles represent data from forest; and pink diamonds represent data from wetland. The black line represents the linear regression line across all ecosystems, the green line represents the linear regression line in grassland, whereas the pink line represents the linear regression line in wetland. Regression lines are shown for significant relationships (p < 0.05). (Online version in colour.)
Figure 5.
Figure 5.
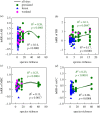
Relationships between plant species richness and the response magnitude (LnRR) of (a) aboveground biomass (AB), (b) belowground biomass (BB), (c) microbial biomass carbon (MBC), (d) as well as soil carbon (soil C) content across all ecosystems. Green circles represent data from grassland; blue triangles represent data from forest; and pink diamonds represent data from wetland. The black line represents the linear regression line across all ecosystems, whereas the green line represents the linear regression line in grassland. The relationships were significant when p < 0.05. No significant relationships were found in forest and wetland. (Online version in colour.)
Figure 6.
Figure 6.
Relationships of LnRR of aboveground biomass (AB), belowground biomass (BB), microbial biomass carbon (MBC), as well as soil carbon (soil C) content and aridity index, plot area (m2) and experimental duration (year) across all ecosystems. The green circle represents data from grassland, the blue triangle represents data from forest and the pink diamond represents data from wetland. The black line represents the linear regression line across all ecosystems, whereas the green line represents the linear regression line in grassland; and the blue line represents the linear regression line in forest. The relationships were significant when p < 0.05. (Online version in colour.)
Figure 7.
Figure 7.
The effects of plant species richness on soil respiration, litter decomposition, soil physico-chemical properties and soil microbial communities (a) across all ecosystems, (b) in grassland and (c) in forest. SR, soil respiration; MR, microbial respiration; N, nitrogen; C/N, carbon to nitrogen ratio; litter k, litter decomposition rate; NH4+, ammonium; NO3, nitrate; P, phosphorus; F/B, fungi to bacteria ratio; G+, Gram-positive bacterial biomass; G−, Gram-negative bacterial biomass; G+/G−, Gram-positive to Gram-negative bacterial biomass ratio. Effect sizes are shown as natural log-response ratios for n studies per response variable. Effects are significant when confidence intervals do not overlap with zero (indicated by asterisks, *p < 0.05, **p < 0.01, ***p < 0.001). Numbers in parentheses represent the number of observations for each parameter. (Online version in colour.)

References

    1. Cardinale BJ, et al. 2012. Biodiversity loss and its impact on humanity. Nature 486, 59–67. ( 10.1038/nature11148) - DOI - PubMed
    1. Tilman D, Isbell F, Cowles JM. 2014. Biodiversity and ecosystem functioning. Annu. Rev. Ecol. Evol. Syst. 45, 471–493. ( 10.1146/annurev-ecolsys-120213-091917) - DOI
    1. Eisenhauer N, et al. 2019. A multitrophic perspective on biodiversity–ecosystem functioning research. Adv. Ecol. Res. 61, 1–54. ( 10.1016/bs.aecr.2019.06.001) - DOI - PMC - PubMed
    1. Chapin FS III, Diaz S. 2020. Interactions between changing climate and biodiversity: shaping humanity's future. Proc. Natl Acad. Sci. USA 117, 6295–6296. ( 10.1073/pnas.2001686117) - DOI - PMC - PubMed
    1. Harrison S, Spasojevic MJ, Li D. 2020. Climate and plant community diversity in space and time. Proc. R. Soc. Lond. B 117, 4464–4470. ( 10.1073/pnas.1921724117) - DOI - PMC - PubMed

Publication types

LinkOut - more resources