

Quantitative DCE-MRI: an efficient diagnostic technique for evaluating early micro-environment permeability changes in ankylosing spondylitis
- PMID: 33234145
- PMCID: PMC7685584
- DOI: 10.1186/s12891-020-03805-1
Quantitative DCE-MRI: an efficient diagnostic technique for evaluating early micro-environment permeability changes in ankylosing spondylitis
Abstract
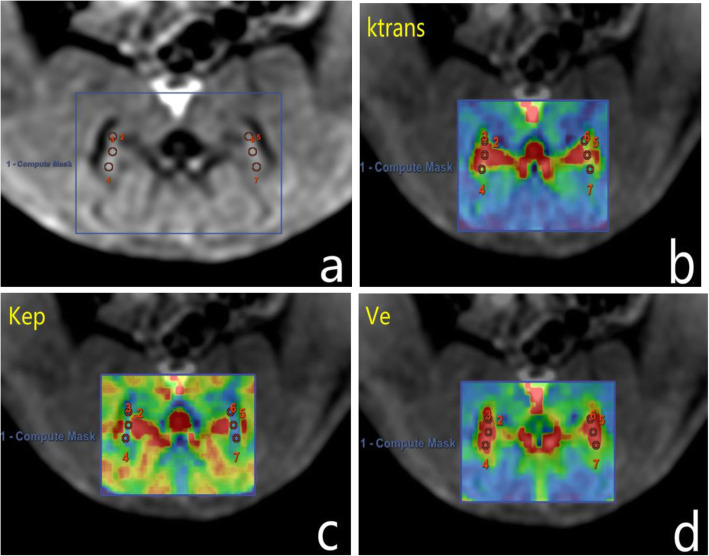
Background: In the management of early inflammatory joint of ankylosing spondylitis (AS), there is a need for reliable noninvasive quantitative monitoring biomarker to closely assess status of synovitis progression. Cognizant to this,studies geared on improving techniques for quantitative evaluation of micro-environment permeability of the joint space are necessary. Such improved techniques may provide tissue perfusion as important biological parameters and can further help in understanding the origin of early changes associated with AS. The purpose of this study was to prospectively evaluate the diagnostic performance and determine longitudinal relationships of early micro-environment active in the joint space of the sacroiliac joint (SIJ) with a rat model by using quantitative dynamic contrast-enhanced magnetic resonance imaging (DCE-MRI).
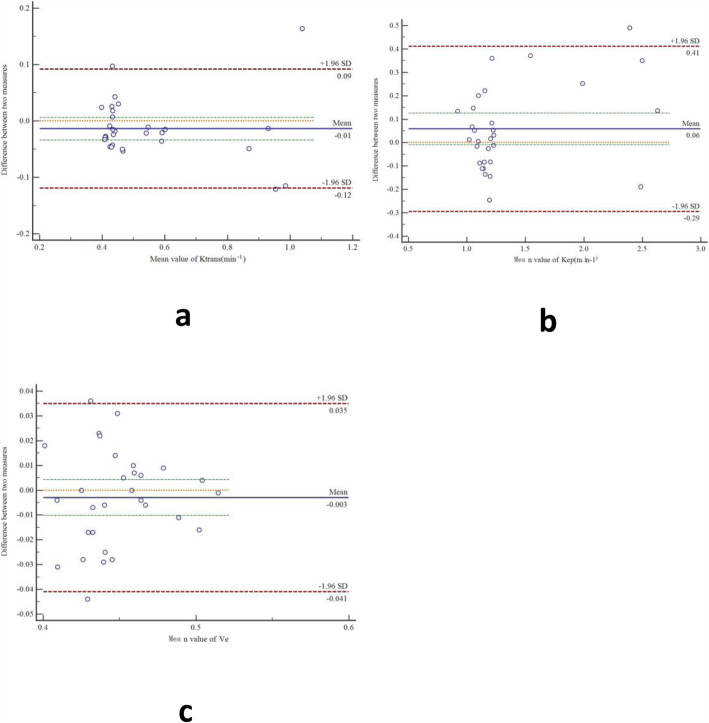
Methods: Thirty wistar male rats were randomly assigned to the model (n = 15) or control (n = 15) group. All rats underwent DCE-MRI of SIJ region at fixed time points (12, 17 and 22 weeks),between September 2018 and October 2019. Differences in permeability parameters between the two groups at the same time point were compared by using an independent samples t test. Spearman correlations of DCE-MRI parameters with different time points in model group were analyzed. All statistical analyses were performed with software.
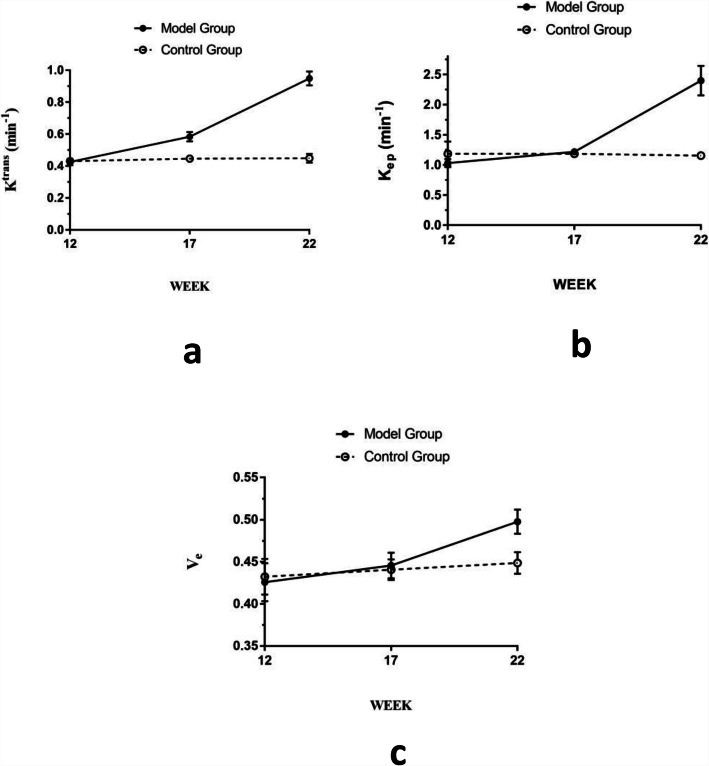
Results: At 12 weeks,the Ktrans,Kep and Ve values in the model group were slightly lower than those in control group,but all the differences were not statistically significant (p > 0.05). Compared with control group,the transfer constant (Ktrans) values increased significantly at 17 weeks and 22 weeks in model group,while the rate constant (Kep) and volume of extravascular extracellular space (Ve) significantly increased only at 22 weeks(p < 0.05). The Ktrans,Kep and Ve were positively correlated with increasing time points (r = 0.946, P<0.01 for Ktrans; r = 0.945, P<0.01 for Kep; and r = 0.832, P<0.01 for Ve).
Conclusion: Quantitative DCE-MRI parameters are valuable for evaluating the early longitudinal relationship of micro-environment permeability changes in the joint space of SIJ.
Keywords: Animal model; Ankylosing spondylitis; Dynamic contrast-enhanced magnetic resonance imaging; Quantitatively micro-environment; Sacroiliac joint.
Conflict of interest statement
The authors declare that they have no competing interests.
Figures
Similar articles
-
Dynamic contrast-enhanced magnetic resonance imaging and diffusion-weighted imaging in the activity staging of terminal ileum Crohn's disease.World J Gastroenterol. 2020 Oct 21;26(39):6057-6073. doi: 10.3748/wjg.v26.i39.6057. World J Gastroenterol. 2020. PMID: 33132655 Free PMC article.
-
Comparison of semi-quantitative and quantitative dynamic contrast-enhanced MRI evaluations of vertebral marrow perfusion in a rat osteoporosis model.BMC Musculoskelet Disord. 2017 Nov 14;18(1):446. doi: 10.1186/s12891-017-1800-1. BMC Musculoskelet Disord. 2017. PMID: 29137612 Free PMC article.
-
Quantitative dynamic contrast-enhanced magnetic resonance imaging in a VX2 rabbit liver tumour model using different gadolinium-based contrast agents: comparison of DCE-MRI quantitative results between Magnevist and Eovist.BJR Case Rep. 2017 Apr 12;3(3):20160099. doi: 10.1259/bjrcr.20160099. eCollection 2017. BJR Case Rep. 2017. PMID: 30363268 Free PMC article.
-
Assessment of active and inactive sacroiliitis in patients with ankylosing spondylitis using quantitative dynamic contrast-enhanced MRI.J Magn Reson Imaging. 2017 Jul;46(1):71-78. doi: 10.1002/jmri.25559. Epub 2016 Nov 16. J Magn Reson Imaging. 2017. PMID: 27865027
-
Evaluation of microvascular permeability of skeletal muscle and texture analysis based on DCE-MRI in alloxan-induced diabetic rabbits.Eur Radiol. 2021 Aug;31(8):5669-5679. doi: 10.1007/s00330-021-07705-3. Epub 2021 Feb 5. Eur Radiol. 2021. PMID: 33547478
Cited by
-
Changes of DCE-MRI Parameters in Patients with Rheumatoid Arthritis before and after Therapy and Their Value for the Efficacy Evaluation of Patients.Evid Based Complement Alternat Med. 2021 Oct 18;2021:6848359. doi: 10.1155/2021/6848359. eCollection 2021. Evid Based Complement Alternat Med. 2021. Retraction in: Evid Based Complement Alternat Med. 2023 Jun 21;2023:9895802. doi: 10.1155/2023/9895802. PMID: 34707673 Free PMC article. Retracted.
References
MeSH terms
Substances
Grants and funding
LinkOut - more resources
Full Text Sources
Medical
Research Materials
